Success Amid Risk
Trading Moving Average Pullbacks
by Steve Palmquist
Many traders have found success in trading pullbacks. But even a popular system needs to incorporate risk management.
Every evening, I look over a dozen different scans and select trading techniques that are best suited to the current market environment. Because the market constantly changes, it is important to have multiple techniques in your toolbox. But how do you know if a scan is suited for the current market?
To answer this question, you must understand how each system is affected by a variety of market parameters. This analysis also makes you more aware of how you can manage your risks.
FIRST STEPS
Pullback techniques are based on the idea that trends continue, and the best way to trade them is to look for a pullback in the trend because it usually represents a lower-risk entry point.
Prior to trading a system, I want to have a clear understanding of issues, such as:
One of the systems in my trading toolbox looks for stocks in an uptrend that have not been below the 30-day simple moving average for at least 30 days, and have currently pulled back to within 1.5% of the 30-day average. The system then triggers if the stock moves above the previous day's high the following day. I evaluated how this moving average pullback system (MAPS) performs using AIQ Systems' Expert Design Studio (EDS) backtesting capability. The EDS code for the basic system is shown in the sidebar, "The EDS code for moving average pullback system."How does the system behave when the market is in an uptrend? How does the system behave when the market is in a downtrend? How does the system behave when the market is moving sideways? How do price and volume affect the system? How does trigger-day volume affect the system?
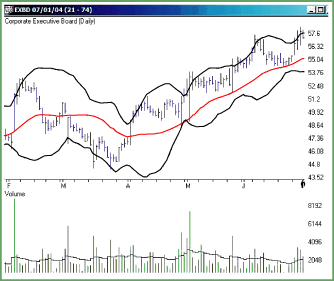
You can see an example of a MAPS stock in Figure 1. I found EXBD by running the basic MAPS scan on June 23, 2004. EXBD had been above the 30-day average (shown in red) for at least 30 days and then pulled back to within 1.5% of the 30-day average on June 23. The following day, EXBD triggered by moving above the previous day's high of $54.88. Five days later, it hit a high of more than $58.

FIGURE 1: EXAMPLE MAPS STOCK FOUND WITH INITIAL SCAN. On 6/23/04, the stock price of EXBD pulled back to the 30-day moving average, after which it moved up more than $3.
For a system to be worth trading, there must be three key characteristics in the market environment in which it is intended to be used:
1. Winning trades must occur more often than losing trades.If a trading system has these three characteristics, then it has a positive expectancy, and we find it of interest.
2. The average gain of the winning trades must be larger than the average loss of the losing trades.
3. The system should show better returns than just trading a market index like the Standard & Poor's 500 (SPX).
...Continued in the April issue of Technical Analysis of STOCKS & COMMODITIES
Excerpted from an article originally published in the April 2005 issue of Technical Analysis of STOCKS & COMMODITIES magazine. All rights reserved. © Copyright 2005, Technical Analysis, Inc.
Return to April 2005 Contents