GO BACK
WEALTH-LAB: MOVING AVERAGE PULLBACKS
Wealth-Lab's ChartScript for the moving average pullback system (MAPS)
discussed by Steve Palmquist in this issue of S&C incorporates the
ideas that Palmquist suggests would generate the best results for the strategy.
Specifically, the implementation enters trades if and only if the stock's
volume on the signal bar is greater than its average 20-day volume, which
is further constrained to be greater than 300,000. In addition, as was
recommended, the method uses a three-day time-based exit.
Instead of backtesting MAPS in a piecemeal fashion based on what we
assumed to be subjectively drawn trendlines to determine bullish or bearish
market phases, we used indicators from Wealth-Lab's Code Library to calculate
and draw logarithmic trendline projections of the two most recent 8% peaks/troughs
in the specified index series. Using the relationship between the index's
closing price and the trendline projections, the BearInhibit function determines
the market's phase, which in turn is used as an inhibiting condition for
MAPS. Consequently, a complete portfolio simulation may be run over any
date range, while MAPS patiently waits for "better times." Alternatively,
using the ChartScript Window (Figure 2) you can quickly identify the bearish
periods to avoid.

Figure 2: WEALTH-LAB, MAPS. The Nasdaq price series and trendline
projections are plotted in the upper pane, where a red background indicates
a bearish market phase. Likewise, a blue background in the price pane shows
that a stock's closing price series has been above its moving average for
30 days.
WealthScript Code
{$I 'VolumeColor'}
{$I 'TrendLinePeaks'}
{$I 'TrendLineTroughs'}
const IDX = '.IXIC';
const bLOG = true;
const REV = 8; // Peak/Trough reversal percentage
var Bar, Start, p, hSMA, hAvgVol, hProximity, IDXPane: integer;
var hPeakPrj, hTrghPrj, hIDX_C, hIDX_L: integer;
var Setup, Rising, HigherHigh, CloseToPullback, Inhibited: boolean;
{ Trade inhibit based on index trend lines }
function BearInhibit( Bar: integer ): boolean;
begin
var TroughTransition: boolean = TroughBar( Bar, hIDX_L, REV ) <> TroughBar( Bar - 1, hIDX_L, REV );
  if ( @hIDX_C[Bar] > @hPeakPrj[Bar] ) or
     ( ( ROC( Bar, hPeakPrj, 1 ) < 0 ) and
       ( @hIDX_C[Bar] > @hPeakPrj[Bar] ) ) then
    Inhibited := false
  else if not TroughTransition then
    if ( ROC( Bar, hTrghPrj, 1 ) > 0 ) and ( @hIDX_C[Bar] > @hTrghPrj[Bar] ) then
      Inhibited := false
    else if CrossUnder( Bar, hIDX_C, hTrghPrj ) then
      Inhibited := true;
  Result := Inhibited;
  if Inhibited then
    SetPaneBackgroundColor( Bar, IDXPane, #RedBkg )
end;
{ Index trend indicators, filter, and plot }
SetPrimarySeries( IDX );
IDXPane := CreatePane( 100, true, true );
SetLogScale( IDXPane, bLOG );
hIDX_C := #Close;
hIDX_L := #Low;
hPeakPrj := TrendLinePeaksSeries( #High, REV, bLOG );
hTrghPrj := TrendLineTroughsSeries( #Low, REV, bLOG );
PlotSymbol( IDX, IDXPane, #Gray, #Candle );
DrawLabel( IDX, IDXPane );
PlotSeries( hPeakPrj, IDXPane, #Green, #Dotted );
PlotSeries( hTrghPrj, IDXPane, #Fuchsia, #Dotted );
RestorePrimarySeries;
hAvgVol := SMASeries( #Volume, 20 );
hSMA := SMASeries( #Close, 30);
PlotSeriesLabel( hSMA, 0, #Teal, #Thin, 'SMA(Close,30)' );
PlotSeriesLabel( hAvgVol, 1, #Blue, #Thin, 'SMA(Volume,20)' );
hProximity := SubtractSeries( #Close, hSMA );
{ Execute MAPS Trading System }
InstallTimeBasedExit( 3 );
Start := Round( Max( Max( 30, TrendPeaksValidBar ), TrendTroughsValidBar ) );
for Bar := Start to BarCount - 1 do
begin
  ApplyAutoStops( Bar );
{ Lt. blue background if 30 days above SMA }
  if Lowest( Bar, hProximity, 30 ) >= 0 then
    SetPaneBackgroundColor( Bar, 0, #BlueBkg );
  if not BearInhibit( Bar ) then
  begin
    Setup := ( Lowest( Bar, hProximity, 30 ) >= 0 )
         and ( @hAvgVol[Bar] > 300000 )
         and ( Volume( Bar ) > @hAvgVol[Bar] );
    HigherHigh := PriceHigh( Bar ) > PriceHigh( Bar - 1 );
    Rising := Lowest( Bar, #Close, 5 ) > Highest( Bar - 20, #Close, 20 );
    CloseToPullback := @hProximity[Bar] < 0.015 * PriceClose( Bar );
    if Setup and Rising and CloseToPullback and HigherHigh then
      BuyAtMarket( Bar + 1, '' );
  end;
end;
--Robert Sucher
www.wealth-lab.com
GO BACK
AMIBROKER: MOVING AVERAGE PULLBACKS
In his article "Trading Moving Average Pullbacks," Steve Palmquist presents
a short-term trading system that uses pullbacks as an entry setup and the
next day's higher high as a trigger. Such systems can be easily coded in
AmiBroker Formula Language as presented in Listing 1. We have added a few
things that were not mentioned in the article, such as limits on the number
of simultaneously open positions and single position values, as well as
a fixed time-based stop so all trades are closed on the fifth day since
the entry. We have also run a backtest on a portfolio consisting of 100
stocks belonging to the Nasdaq 100 index over a period from January 1,
2000, to December 31, 2004. During that period, the system generated a
profit of +118% (+17% compounded annual return) with -8.7% maximum system
drawdown. In the very same period, the Nasdaq-100 index lost -56%.

FIGURE 3: AMIBROKER, moving average pullbacks. Here is a sample AmiBroker
screenshot showing the results of backtesting the system on a portfolio
of the 100 largest Nasdaq stocks.
LISTING 1
// Moving Average Pullback system
RisingCloses = LLV( Close, 5 ) > Ref( HHV( Close, 20 ), -20 );
PMA = MA( Close, 30 );
NotBelowPullbackMA = Sum( Close < PMA, 30 ) == 0;
CloseToPullbackMA = ( Close - PMA ) < 0.015 * Close;
// setup conditions for next day buy stop order
Setup = RisingCloses AND NotBelowPullbackMA AND CloseToPullbackMA;
TriggerPrice = Ref( High, -1 );
// buy only if stock opens higher than yesterdays high
Buy = Ref( Setup, -1 ) AND High >  TriggerPrice;
BuyPrice = Max( Open, TriggerPrice );
Sell = False; // sell only via N-bar stop
// time-based stop (for backtesting)
ApplyStop( stopTypeNBar, stopModeBars, 5 );
SetTradeDelays( 0, 0, 0, 0 );
// no more than 3 simultaneous positions open
SetOption("MaxOpenPositions", 3 );
PositionSize = -33; // 3% of capital in single security
--Tomasz Janeczko, AmiBroker.com
www.amibroker.com
GO BACK
eSIGNAL: MOVING AVERAGE PULLBACKS
For this month's article by Steve Palmquist, "Trading Moving Average
Pullbacks," we've provided an indicator in eSignal code, MAPS.efs (downloadable
from www.esignalcentral.com, and also posted at Traders.com). The study
has options to configure the moving average length, price source, and calculation
type via the Edit Studies option (Chart Options-->Edit Studies). There are
also formula parameters for the percent envelope and the number of bars
to define the trend. The default study parameters as described in the article
are set for use with the daily interval. The formula may also be used on
intraday intervals, but the study parameters will need to be reconfigured,
based on the chosen symbol and interval. The study is also compatible for
backtesting with the Strategy Analyzer.

Figure 4: eSIGNAL, MAPS. Here is a demonstration of the moving average
pullback system in eSignal.
To discuss these studies or to download a complete copy of the formula,
please visit the EFS Library Discussion Board forum under the Bulletin
Boards link at www.esignalcentral.com.
Moving Average Pullbacks (MAPS.efs)
/*****************************************************************
Provided By : eSignal (c) Copyright 2005
Description:  Moving Average Pullback System - by Steve Palmquist
Version 1.0  2/10/2005
Notes:
April 2005 Issue - "Success Amid Risk - Trading Moving Average Pullbacks"
Formula Parameters:                 Defaults:
MA Length                           30
MA Source                           Close
MA Type                             SIMPLE
Pullback Percent Envelope           1%
Trend Bars                          30
***************************************/
function preMain() {
    setPriceStudy(true);
    setStudyTitle("Moving Average Pullback System ");
    setShowTitleParameters(false);
    setCursorLabelName("+1\%", 0);
    setCursorLabelName("MA", 1);
    setCursorLabelName("-1\%", 2);
    setCursorLabelName("Trend Count", 3);
    setDefaultBarFgColor(Color.blue, 0);
    setDefaultBarFgColor(Color.red, 1);
    setDefaultBarFgColor(Color.blue, 2);
    setDefaultBarFgColor(Color.grey, 3);

    var fp1 = new FunctionParameter("nLength", FunctionParameter.NUMBER);
        fp1.setName("MA Length");
        fp1.setDefault(30);
        fp1.setLowerLimit(1);
    var fp2 = new FunctionParameter("sSource", FunctionParameter.STRING);
        fp2.setName("MA Source");
        fp2.setDefault("Close");
        fp2.addOption("Open");
        fp2.addOption("High");
        fp2.addOption("Low");
        fp2.addOption("Close");
        fp2.addOption("HL/2");
        fp2.addOption("HLC/3");
        fp2.addOption("OHLC/4");
    var fp3  = new FunctionParameter("type", FunctionParameter.STRING);
        fp3.setName("MA Type");
        fp3.setDefault("SIMPLE");
        fp3.addOption("SIMPLE");
        fp3.addOption("EXPONENTIAL");
        fp3.addOption("WEIGHTED");
        fp3.addOption("VOLUMEWEIGHTED");
    var fp4 = new FunctionParameter("nPBpercent", FunctionParameter.NUMBER);
        fp4.setName("Pullback Percent Envelope");
        fp4.setDefault(1);
        fp4.setLowerLimit(0);
        fp4.setUpperLimit(100);
    var fp5 = new FunctionParameter("nTrendBars", FunctionParameter.NUMBER);
        fp5.setName("Number of Bars for Trend");
        fp5.setDefault(30);
        fp5.setLowerLimit(1);
}
var study = null;
var bt = true;      // back testing on
var nTrendCntr = 0;
var nTrendCntr1 = 0;// previous bar's nTrendCntr
var sSide = 0;      // 1 = obove MA, -1 = below MA
var sSide1 = 0;     // previous bar's sSide
var bInit = true;   // initialization routine.
var bLongTrigger = false;
var bShortTrigger = false;
var vPosition = 0;  // 0 = no position, 1 = long, -1 = short
var nTriggerIndex = null;
var nBarCount = 0;  // bar counter for exit strategy
function main(nLength, sSource, type, nPBpercent, nTrendBars) {
    var nState = getBarState();
    if (nState == BARSTATE_ALLBARS || bInit == true) {
        study = new MAStudy(nLength, 0, sSource, eval("MAStudy." + type));
        if (close(0) > vMA) sSide = 1;
        else sSide = -1;
        setCursorLabelName("+" + nPBpercent + "\%", 0);
        setCursorLabelName("-" + nPBpercent + "\%", 2);
        bt = true;
        bInit = false;
    }

    var vMA = study.getValue(MAStudy.MA);
    var vMA1 = study.getValue(MAStudy.MA, -1);
    if (vMA == null || vMA1 == null) return;

    if (nState == BARSTATE_NEWBAR) {
        nTrendCntr1 = nTrendCntr;
        nTrendCntr += 1;
        sSide1 = sSide;
        nBarCount += 1;
        if (getCurrentBarIndex() < 0) bt = true;
        else bt = false;
    }

    if (sSide == 1 && low(-1) < vMA1) sSide = -1;
    else if (sSide == -1 && high(-1) > vMA1) sSide = 1;

    if (nState == BARSTATE_NEWBAR && bLongTrigger == false && bShortTrigger == false) {
        if (nTrendCntr1 >= nTrendBars) {
            if (sSide1 == 1 && vPosition != 1) {
                if ( Math.abs((low(-1) - vMA1)/vMA1) <= (nPBpercent/100) ) {
                    bLongTrigger = true;
                    nTriggerIndex = getCurrentBarIndex();
                }
            } else if (sSide1 == -1 && vPosition != -1) {
                if ( Math.abs((vMA1 - high(-1))/vMA1) <= (nPBpercent/100) ) {
                    bShortTrigger = true;
                    nTriggerIndex = getCurrentBarIndex();
                }
            }
        }
    }

    // Position Exit
    if (vPosition != 0 && nBarCount == 3) {
        if (vPosition == 1) {
            longExit();
        } else if (vPosition == -1) {
            shortExit();
        }
    }

    // Position Entry
    if (getCurrentBarIndex() == nTriggerIndex) {
        if (bLongTrigger == true) {
            if (high(0) > high(-1)) longEntry();
        } else if (bShortTrigger == true) {
            if (low(0) < low(-1)) shortEntry();
        }
    } else {
        bLongTrigger = false;
        bShortTrigger = false;
    }
    if (vPosition == 1) setBarBgColor(Color.green);
    if (vPosition == -1) setBarBgColor(Color.red);

    if (sSide1 != sSide) nTrendCntr = 0;  // reset trend

    return new Array(((nPBpercent/100)*vMA)+vMA, vMA, vMA-((nPBpercent/100)*vMA), nTrendCntr+"");
}
/***** Support Functions *****/
function longEntry() {
    bLongTrigger = false;
    vPosition = 1;
    setBarBgColor(Color.green);
    var nEntryPrice = high(-1);
    if (open(0) > nEntryPrice) nEntryPrice = open(0);
    if (bt == true) {
        Strategy.doLong("Buy", Strategy.LIMIT, Strategy.THISBAR, null, nEntryPrice);
    }
    nBarCount = 0;
    return;
}
function shortEntry() {
    bShortTrigger = false;
    vPosition = -1
    setBarBgColor(Color.red);
    var nEntryPrice = low(-1);
    if (open(0) < nEntryPrice) nEntryPrice = open(0);
    if (bt == true) {
        Strategy.doShort("Short", Strategy.LIMIT, Strategy.THISBAR, null, nEntryPrice);
    }
    nBarCount = 0;
    return;
}
function longExit() {
    vPosition = 0;
    if (bt == true) Strategy.doSell("Long Stop", Strategy.MARKET, Strategy.THISBAR);
    return;
}
function shortExit() {
    vPosition = 0;
    if (bt == true) Strategy.doCover("Short Stop", Strategy.MARKET, Strategy.THISBAR);
    return;
}
--Jason Keck
eSignal, a division of Interactive Data Corp.
800 815-8256, www.esignalcentral.com
GO BACK
METASTOCK: MOVING AVERAGE PULLBACKS
Steve Palmquist's article, "Trading Moving Average Pullbacks," introduces
his moving average pullback system (MAPS). An exploration to search for
these signals can be created in MetaStock with the following steps:
1. Select Tools > The Explorer.
2. Click New to open the Exploration Editor.
3. Type a name for the Exploration.
4. Select the Filter tab, which is in the middle on the right-hand
side.
5. Click in the larger window and type in the following formula:
LLV(C,5)>Ref(HHV(C,20),-20) AND
Sum(C<Mov(C,30,S),30)=0 AND
((C-Mov(C,30,S))<(0.015*C))
6. Click OK to close the editor.
The securities found by this exploration will be possible candidates
for MAPS trades. The entry rules say to buy tomorrow if the security trades
above the current day's high.
A system test for MAPS can be created as follows:
1. Select Tools > the Enhanced System Tester.
2. Click New.
3. Enter a name for the system.
4. Select the Buy Order tab and enter the following formula:
setup:=LLV(C,5)>Ref(HHV(C,20),-20) AND
Sum(C<Mov(C,30,S),30)=0 AND
((C-Mov(C,30,S))<(0.015*C));
Ref(setup,-1) AND H>Ref(H,-1)
5. Select the Sell Order tab and enter this formula:
Simulation.CurrentPositionAge=3
The above system uses a function for the sell condition that is only available
in MetaStock version 8.0 or later. If you are using a version of MetaStock
earlier than 8.0, then replace step 5 above with the following steps:
1. Click the Stops button.
2. In the Stops window, select the Inactivity tab.
3. Set the Positions to "Long" and the Method to "Percent."
4. Set the Minimum Change to "9999."
5. Set the Periods to "3."
6. Click OK to close the Stops window.
--William Golson
Equis Internationa
GO BACK
TRADING SOLUTIONS: MOVING AVERAGE PULLBACKS
In his article in this issue, Steve Palmquist describes a system for
trading moving average pullbacks. This system can be entered into TradingSolutions
as follows. A simple exit rule of exiting after three bars is used for
testing.
Name: Moving Average Pullback System
Inputs: Close
Enter Long (when all are true):
GT (Lowest ( Close, 5), Lag (Highest (Close, 20), 20))
LT (Count (LT (Close, MA(Close, 30)), 30), 1)
LT (Sub (Close, MA(Close, 30)), Mult(0.015, Close))
Exit Long
Rule_ExitOnLength(3,0)
This system is available in a function file that can be downloaded
from the TradingSolutions website in the Solution Library section, as well
as displayed here for copying and pasting. As with many indicators, these
values can make good inputs to neural network predictions.

Figure 7: TRADING SOLUTIONS, MAPS. Here is a sample TradingSolutions
chart displaying Steve Palmquist's moving average pullback system.
--Gary Geniesse
NeuroDimension, Inc.
800 634-3327, 352 377-5144
https://www.tradingsolutions.com
GO BACK
NEUROSHELL TRADER: MOVING AVERAGE PULLBACKS
Steve Palmquist's moving average pullback system (MAPS) can be easily
implemented in NeuroShell Trader by combining a few of NeuroShell Trader's
800+ indicators with NeuroShell Trader's Trading Strategy Wizard.
To recreate the MAPS trading system in NeuroShell, select "New Trading
Strategy ..." from the Insert menu and enter the following entry and exit
conditions in the appropriate locations of the Trading Strategy Wizard:
Generate a buy long Stop order if All of the following are true:
A>B ( PriceLow ( Close, 5 ), Lag ( PriceHigh ( Close, 20 ), 20 ) )
A<B ( Sum ( A<B ( Close, Average ( Close, 30 ) ), 30 ), 1 )
A<B ( Subtract ( Close, Average ( Close, 30 ) ), Multiply2 ( 0.015, Close ) )
Stop Price:  High
Generate a sell short MARKET order if ALL of the following are true:
BarsSinceEntryFilled=X ( Trading Strategy, 3 )
If you have NeuroShell Trader Professional, you can also choose
whether the system parameters should be optimized. After backtesting the
trading strategy, use the "Detailed Analysis ..." button to view the backtest
and trade-by-trade statistics for MAPS.

Figure 8: NeuroShell, MAPS. Here is a sample Neuroshell chart demonstrating
Steve Palmquist's MAPS.
--Marge Sherald, Ward Systems Group, Inc.
301 662-7950, sales@wardsystems.com
www.neuroshell.com
GO BACK
INVESTOR/RT: MOVING AVERAGE PULLBACKS
Here is the syntax required to create a signal that will detect the
buy conditions described by Steve Palmquist in his article in this issue
on the moving average pullback system.
MIN(LO.1, 5) > MAX(HI.21, 20)
AND MIN(CL.1 - MA.1, 30) >= 0
AND (CL.1 - MA.1) < (0.015 * CL.1)
AND HI > HI.1
The first line detects whether the symbol is in an uptrend (if the
minimum low of the previous five days is higher than the highest high of
the 20-day period ending 21 days back). The second line detects that the
symbol has been at or above its 30-period moving average (MA) for the previous
30 days. The third line detects whether the price closed within 1.5 of
its MA on the previous day. The last line makes sure the high of current
day rose above the high of the previous day.
The chart in Figure 9 shows the MAPS buy condition being detected by
a signal marker on both 11/24/2003 and 11/25/2003 for Alcoa Inc. [AA].
AA proceeded to run up about 20% before the year was over.

FIGURE 9: investor/rt, MAPS. Here's a sample Investor/RT daily candlestick
chart of Alcoa [AA] showing a MAPS buy signal on 11/24/03 and 11/25/03.
The purple line represents the 30-day moving average of the close.
To learn more about the Investor/RT RTL language, visit https://www.linnsoft.com/tour/scanElems.htm.
--Chad Payne, Linn Software
www.linnsoft.com, info@linnsoft.com
GO BACK
PROPHET.NET: TRADING MOVING AVERAGE PULLBACKS
The moving average pullback technique, described by Steve Palmquist,
is available on the Prophet.Net website (https://www.Prophet.net) to all
premium members. No coding is required on the part of the user. The indicator
is built into the JavaCharts applet.
The moving average pullback technique seeks to find reduced risk entry
points by isolating pullbacks in trends. In Prophet JavaCharts, this technique
is available through the Moving Average Pullback study. For one-click access
to this study, go to JavaCharts from <https://www.prophet.net/analyze/javacharts.jsp>.
Alternatively, click the Analyze tab on the Prophet.net website and then
click the JavaCharts selection (Prophet.Net : Analyze : JavaCharts), as
shown in Figure 10.

FIGURE 10: PROPHET.NET, JAVACHARTS. Access the moving average pullback
system through the Analyze tab at the Prophet.Net website.
Click on the Tools menu -- also accessible by right-clicking anywhere
on the chart -- and choose Apply Studies from the Studies menu item. The
list of available studies (approximately 150, shown in alphabetical order)
is in the second dropdown menu; you can choose the Moving Average Pullback
from this list (Figure 11).
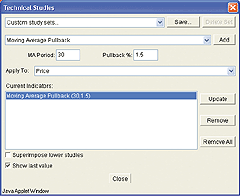
FIGURE 11: PROPHET.NET, MAPS. Customize the MA Period and Pullback
% in the Technical Studies screen.
When using the moving average pullback in JavaCharts, you can customize
the MA Period and Pullback %. The MA Period is the length of time used
in calculating the moving average. The Pullback % is the percentage of
the price retraction required to generate a signal. A default MA Period
of 30 and Pullback % of 1.5 are provided; these are the values used in
the article, so you should only change these parameters if you would like
to customize the indicator.
The study appears as a binary graph in a lower window. When pullback
conditions have been met as defined in Palmquist's article -- last N days
above MA(N) and pullback of the close price within pullback percent -- the
value of the study turns to +1.
The example in Figure 12 shows Johnson and Johnson's steady rise from
April 2001 to April 2002. A vertical line appears in the moving average
pullback lower panel on February 11, 2002, when the moving average pullback
value flipped from -1.00 to +1.00. This marks an entry point and is followed
by a subsequent six-week rise in Johnson and Johnson's stock price.
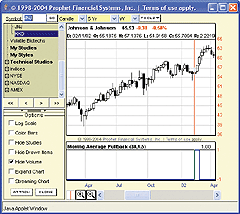
FIGURE 12: PROPHET.NET, MAPS. Johnson and Johnson rises steadily
from April 2001 to April 2002. A vertical line appears in the moving average
pullback lower panel on February 11, 2002, when the moving average pullback
value flipped from -1.00 to +1.00. This marks an entry point and is followed
by a subsequent six-week rise in Johnson and Johnson's stock price.
Full access to the JavaCharts study set requires a premium membership
at Prophet. Premium memberships at Prophet.Net start at $14.95 per month;
real-time market data is available for equities, options, and futures.
A seven-day, risk-free trial is available by following this link, which
will provide immediate access to all features and studies: <https://www.prophet.net/tasc>.
--Jai Saxena
Prophet Financial Systems, Inc.
650 322-4183 ext. 107
jai@prophet.net
GO BACK
NEOTICKER: MOVING AVERAGE PULLBACKS
The trading signal and system presented in Steve Palmquist's article
"Trading Moving Average Pullbacks" can be implemented using a formula language
indicator named moving average pullbacks (Listing 1), which is a system
with one plot that shows system equity.
Using Scan Workshop, the system can be applied to a list of stocks,
and symbols can be sorted according to their respective final equity level.
This will show which symbols are most (or least) profitable during the
designated testing period.
Scan Workshop is a tool in NeoTicker for scanning symbols using existing
chart setups. It can collect and sort indicator calculation results (Figure
13). In this scan, the Nasdaq 100 symbols list is used, and results are
sorted by amount of final trading system equity. In looking over some sorted
trading system results, we observe about 50 stocks in the Nasdaq 100 that
are making money or breaking even using the moving average pullback system
(MAPS).
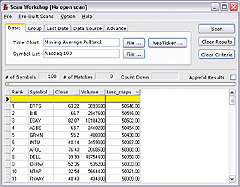
Figure 13: NEOTICKER, MAPS. Scan Workshop is a tool in NeoTicker
for scanning symbols using existing chart setups. It can collect and sort
indicator calculation results, such as in this example.
Palmquist's article presents the results of a portfolio trading system.
NeoTicker can develop a portfolio trading system using Delphi script, called
moving average pullbacks portfolio (Listing 2). It can generate trades
for all stocks in the portfolio and show the resulting equity curve of
the whole portfolio. Detailed statistics such as annual return on investment
(ROI) and percentage winners are all shown under one performance report
(Figure 14). This allows collection and comparison of necessary statistics
of the portfolio with a single run.
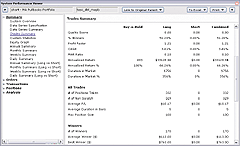
Figure 14: NEOTICKER, MAPS. Detailed statistics such as annual return
on investment (ROI) and percentage winners are all shown under one performance
report. This allows collection and comparison of necessary statistics of
the portfolio with a single run.
To run the portfolio system in a single chart, first you must add a
list of symbols. To add a list of symbols, open the Chart Manager, click
on the Data tab, click on the "Add List" button, select from the available
symbol lists or a customized symbol list produced from scanning results.
Then add the trading system to any one data series in the chart, and the
system will apply the system rules to all the data series present in that
chart (Figure 15). The chart is illegible when all data series are visible,
so at the Chart Manager's Data tab, click on the "Hide all" button, then
show only the data series of a particular symbol when closer examination
is required.
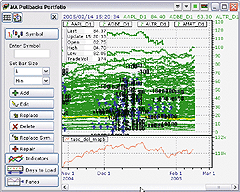
Figure 15: NEOTICKER, MAPS. Here is a sample chart showing the moving
average pullback system. The Delphi script for this system shown
in Listing 2 can generate trades for all stocks in the portfolio and show
the resulting equity curve of the whole portfolio.
This system can handle any number of symbols and produce portfolio trading
results as one system. With this setup, testing results from the filtered
symbol list sorted by price or average volume are produced by changing
the symbol list and the parameters in the system.
Listing 1
$mysize := param2;
$pullback_threshold := average(data1, param1)*0.015;
ltavg := if(c(0)<average(data1, param1), 0, ltavg+1);
mysignal := (c(0)-average(data1, param1))<$pullback_threshold;
longatmarket(mysignal(1)>0 and ltavg(1)>=30 and llv(c,5)>hhv(20,c,20),
             $mysize, "pullback trigger long");
$mylongperiod := if(openpositionlong>0, $mylongperiod+1, 0);
longexitatmarket(openpositionlong>0 and $mylongperiod>2,
                 $mysize, "exit after 3 days");
plot1 := currentequity;
Listing 2
function tasc_del_mapb : double;
var ind_ma, ind_hhv, ind_llv : varinat;
    str_ma, str_hhv, str_llv : string;
    pullback_threshold : double;
    above_period, mysize, i : integer;
begin
   if heap.size = 0 then
   begin
      heap.allocate (dataseries.count);
      heap.fill (0, dataseries.count-1, 0);
   end;
   above_period := 30;
   mysize := param2.int;
   for i := 0 to dataseries.count-1 do
   begin
      str_ma  := 'myma' + ntlib.integer2str(i);
      str_hhv := 'myhhv' + ntlib.integer2str(i);
      str_llv := 'myllv' + ntlib.integer2str(i);
      ind_ma  := itself.makeindicator (str_ma, 'average',
                       ['#'+ntlib.integer2str(i+1)], [param1.str]);
      ind_hhv := itself.makeindicator (str_hhv, 'hhv',
                       ['#'+ntlib.integer2str(i+1)], ['20']);
      ind_llv := itself.makeindicator (str_llv, 'llv',
                       ['#'+ntlib.integer2str(i+1)], ['5']);
      pullback_threshold := ind_ma.value[1]*0.015;
      if trade.openpositionflatex [i+1] then
      begin
         if (heap.value [i]>above_period) and
            (ind_ma.value [1]-dataseries.items [i+1].value [0]<
             pullback_threshold) and
            (ind_llv.value [0]>ind_hhv.value [20]) then
            trade.longatmarketex (i+1, mysize,
                  'long ' + dataseries.items [i+1].symbol);
      end
      else
      begin
         if (dataseries.items [i+1].date[0]-
             trade.openpositionentrydatetimeex [i+1]) > 3 then
             trade.longexitatmarketex(i+1, mysize,
                   'exit ' + dataseries.items [i+1].symbol);
      end;
      if dataseries.items [i+1].value [0]>ind_ma.value [0] then
         heap.value [i] := heap.value [i]+1
      else
         heap.value [i] := 0;
   end;
   result := trade.currentequity;
end;
Both single instrument and portfolio trading system code will
be available for download in the Yahoo! NeoTicker User Group.
--Kenneth Yuen, TickQuest Inc.
www.tickquest.com
GO BACK
TRADE NAVIGATOR: MOVING AVERAGE PULLBACKS
In Trade Navigator, you can create custom criteria to filter through
all of the symbols and display only symbols that meet the conditions in
the criteria you have set up.
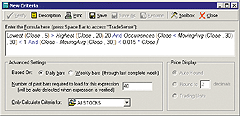
FIGURE 16: TRADE NAVIGATOR, MAPS. Here is the formula in Trade Navigator
for the moving average pullback criteria.
Functions used to create moving average pullbacks, such as MovingAvg,
Lowest, and Occurrences, are already included in the Trade Navigator program.
To create and use the criteria for moving average pullbacks in Trade Navigator,
follow these steps:
1. Go to the Edit menu and click on Criteria. This will bring
up the Trader's Toolbox already set to the Criteria tab.
2. Click on the New button.
3. Type the following formula into the Function window (Figure 17):
Lowest (Close , 5) > Highest (Close , 20).20
 And Occurrences (Close < MovingAvg (Close , 30) , 30) < 1
 And (Close - MovingAvg (Close , 30)) < 0.015 * Close
4. Click on the Verify button.
5. Next to "Only Calculate Criteria for:", select All Stocks.
6. Click on the Save button, type in "Moving Average Pullbacks" as
the name of the function, and then click the OK button.
7. You will be asked if you would like to recalculate the criteria
now. Click Yes.
To get the filtered list of symbols, simply go to the dropdown menu
on the symbol grid (Figure 17) and select your function "Moving Average
Pullbacks" from the list.
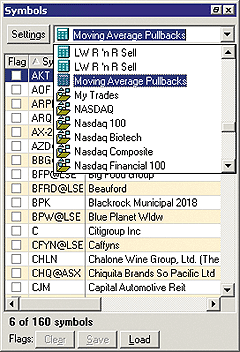
FIGURE 17: TRADE NAVIGATOR, MAPS. Here's an example of a symbol grid.
This will narrow down the list of symbols to just those stocks meeting
the conditions for moving average pullbacks.
To use the criteria in a filter, do the following:
1. Go to the Edit menu and click on Filters. This will bring
up the Trader's Toolbox already set to the Filters tab.
2. Click on the New button.
3. Scroll through the list (Figure 18) and select "moving average pullbacks."
4. With "moving average pullbacks" highlighted, click on the Add Condition
button.
5. Scroll through the list again and select other criteria you wish
to add.
6. Click the Add Condition button then click Save.
7. Type in a name for the filter and click OK.
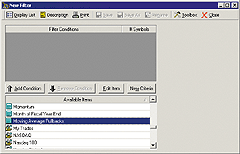
FIGURE 18: TRADE NAVIGATOR, MAPS. Here's an example of a filter
window in Trade Navigator.
--Michael Herman
Genesis Financial Technologies
https://www.GenesisFT.com
GO BACK
ASPEN GRAPHICS: MOVING AVERAGE PULLBACKS
In Steve Palmquist's article, "Trading Moving Average Pullbacks," a
strategy for using MAPS is outlined in great detail. Using the Aspen Graphics
4.0 formula writer, the user can quickly produce this indicator through
the application of three custom formulas.
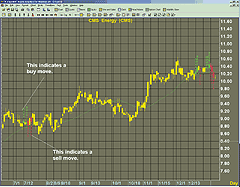
FIGURE 19: aspen graphics, MAPS. Here's a sample Aspen Software
chart displaying the moving average pullback system.
Backtesting is stressed heavily in this article. The suggested backtesting
methods described by Palmquist are easily achieved by combining Aspen's
access to historical data with our volume and moving average studies.
FORMULA 1
In the first formula, the variable Ma=30 sets the simple moving average
to 30 periods. The variable Divirg=30 sets the number of days that the
price must remain above the moving average. Then a Boolean value is returned
dependant on the conditions set by Palmquist's method.
MaDivirg(series,Ma=30,Divirg=30)=begin
retval=0
count=0
for x=0 to Divirg-1 begin
if $1[x]>savg($1,Ma)[x] then count = count +1
end
if count >= Divirg then begin
if $1<=savg($1,Ma)*1.015 then retval=1
end
retval
end
FORMULA 2
In this second formula, we link all parameters used in the entire set
of formulas in order to provide for modification at any point in the application
of this formula set. In addition, we test for a higher high after a true
condition is returned from the previous formula. Then, to finish, we return
a second true value three days after the initial trigger to indicate the
sell.
MaDivirgBuySell(series,Ma=30,Divirg=30)=begin
retval=0
if MaDivirg($1,Ma,Divirg)[1]==1 then begin
if $1.high>$1.high[1] then retval=1
end
if MaDivirgBuySell($1)[3]==1 then retval=2
retval
end
FORMULA 3
This final formula combines all the conditional statements of the previous
two formulas with Boolean return values that will place colored text on
your chart at the buy and sell points. This is the formula that will be
applied to the chart as an overlay.
MaDivirg_BS(input)=begin
retval=' '
if MaDivirgBuySell($1)==1 then retval = 'Buy'|clr_green|arrow|vertical
if MaDivirgBuySell($1)==2 then retval = 'Sell'|clr_red|Below|vertical
retval
end
In addition to the formulas for the MAPS, we have also included
a color rule that will further enhance your charting functionality by coloring
the buy and sell bars accordingly.
Color Rule
if(MaDivirgBuySell($1)==1,clr_green,if(MaDivirgBuySell($1)==2,clr_red,clr_yellow))
For more information and assistance in producing this indicator
on your Aspen system, contact Aspen Research Group Technical Support at
(970) 945-2921.
--Keli Harrison
Aspen Research Group, 800 359-1121
support@aspenres.com
www.aspenres.com
GO BACK
BULLCHARTS: MOVING AVERAGE PULLBACKS
In this issue, Steve Palmquist describes how to trade moving average
pullbacks. The BullScript version of Palmquist's formula is shown below.
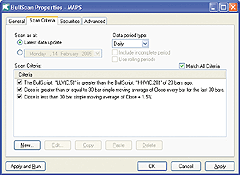
To enter the MAPS calculation into BullCharts, follow the steps below:
1. Select Indicator Builder located in the Tools menu.
2. Press the New button to create a new indicator.
3. Enter the formula name "MAPS."
{The MAPS indicator}
[citation="Stocks & Commodities, Apr 05 - Trading Moving Average Pullbacks by Steve Palmquist"]
[target=Price]
periods := input("Time periods", 30, 1);
pc := input("% within MA", 1.5, 0);
RisingCloses := llv(C,5) > hist(hhv(C,20),20);
PullbackMA := MA(C,periods);
NotBelow := alltrue(C>=PullbackMA, periods);
CloseToPullback := C-PullbackMA < pc*C/100;
MAPullback := RisingCloses and NotBelow and CloseToPullback;
{ Display results }
PullbackMA;
[linestyle=marker; marker=type1]
MAPullback;
4. Enter the following BullScript and press OK.
TRADESTATION: MOVING AVERAGE PULLBACKS
WEALTH-LAB: MOVING AVERAGE PULLBACKS
AMIBROKER: MOVING AVERAGE PULLBACKS
eSIGNAL: MOVING AVERAGE PULLBACKS
METASTOCK: MOVING AVERAGE PULLBACKS
TRADING SOLUTIONS: MOVING AVERAGE PULLBACKS
NEUROSHELL TRADER: MOVING AVERAGE PULLBACKS
INVESTOR/RT: MOVING AVERAGE PULLBACKS
PROPHET.NET: TRADING MOVING AVERAGE PULLBACKS
NEOTICKER: MOVING AVERAGE PULLBACKS
TRADE NAVIGATOR: MOVING AVERAGE PULLBACKS
ASPEN GRAPHICS: MOVING AVERAGE PULLBACKS
BULLCHARTS: MOVING AVERAGE PULLBACKS
TECHNIFILITER PLUS: MOVING AVERAGE PULLBACKS
SMARTRADER: MOVING AVERAGE PULLBACKS
STOCKWIZ: TRADING MOVING AVERAGE PULLBACKS


