GO BACK
WEALTH-LAB: PROFIT WITH ETFs
Editor's note: Wealth-Lab code is already provided in the article
"Profit With ETFs" in this issue by authors Gerald and Trent Gardner.
GO BACK
TRADESTATION: RSI TIMING MODEL FOR ETFs
Gerald and Trent Gardner's article in this issue, "Profit With ETFs,"
describes a portfolio trading system. Individual entries are based on changes
in the value of J. Welles Wilder's relative strength index (RSI) and on
a 200-bar moving average. Profit targets are based on two-bar changes in
price. Positions can have a maximum duration of six bars, not including
the bar of entry. EasyLanguage code for this strategy is presented here.
The article also outlines portfolio management rules. These involve
limiting the system to a maximum of three positions at a time.
To download the EasyLanguage code for the strategy, go to the TradeStation
and EasyLanguage Support Forum (https://www.tradestation.com/Discussions/Forum.aspx?
Forum_ID=213). After logging into the support forum, search for the file
"Gardner-Etf.eld." If you've been to the support forum before, you may
not have to log in when you return.
TradeStation does not endorse or recommend any particular strategy.

FIGURE 3: TRADESTATION, PORTFOLIO TRADING. Here is an example
of the Gardners' ETF trading strategy applied to a daily chart of S&P
Depository Receipts (SPY). Price and trading is displayed in the upper
subgraph. The blue line is a 200-day moving average. The lower subgraph
displays a two-day RSI. When the RSI drops below 2, the color changes.
Strategy:  Gardener-ETFs
inputs:
    Price( High ),
    AvgLength( 200 ),
    RSIThresholdToday( 2 ),
    RSIThresholdYesterday( 1 ),
    ExitLookback( 2 ),
    ExitPercent( 7.5 ),
     MaxPositionLength( 6 ),
    LimitOffsetPercent( 2.5 ) ;
variables:
    ExitPercentMult( 0 ),
    LimitPercentMult( 0 ),
    MaxBarsSinceEntry( 0 ),
    AvgValue( 0 ),
    RSIValue( 0 ) ;
if CurrentBar = 1 then
    begin
    ExitPercentMult = 1 + 0.01 * ExitPercent ;
    LimitPercentMult = 1 + 0.01 * LimitOffsetPercent ;
    MaxBarsSinceEntry = MaxPositionLength - 1 ;
    end ;
AvgValue = Average( Price, AvgLength ) ;
RSIValue = RSI( Price, 2 ) ;
if RSIValue < RSIThresholdToday
    and RSIValue[1] > RSIThresholdYesterday
    and Price > AvgValue
then
    Buy( "LE" ) next bar Low * LimitPercentMult limit ;
if MarketPosition = 1 and ( Price > High[ExitLookBack]
 or Price > Price[ExitLookBack] * ExitPercentMult or
 BarsSinceEntry >= MaxBarsSinceEntry ) then
    Sell( "LX" ) next bar at market ;
--Mark Mills
TradeStation Securities, Inc.
A subsidiary of TradeStation Group, Inc.
www.TradeStation.com
GO BACK
eSIGNAL: PROFIT WITH ETFs
For this month's tip, we've provided the formula Rsi_TimingModel.efs
based on the formula code given in Gerald and Trent Gardner's article in
this issue, "Profit With Etfs."
The study is a long-only strategy configured for backtesting with the
Strategy Analyzer. The strategy colors the price bar corresponding to the
entry and exit trades. The price bar will be colored green on entry; red
for the time-out exit; red for the two-bar high plus 7.5% exit; and yellow
for the two-bar high exit. See Figure 4 for a sample eSignal chart.

FIGURE 4: eSIGNAL, GARDNERS' TIMING MODEL. This eSignal
chart shows an example trade entered on 4/15/1999 (green bar) and its corresponding
exit trade on 4/22/1989 (red bar).
To discuss these studies or download a complete copy of the formula code,
please visit the Efs Library Discussion Board forum under the Forums link
at www.esignalcentral.com or visit our Efs KnowledgeBase at www.esignalcentral.com/support/kb/efs/.
/*********************************
Provided By:
    eSignal (Copyright © eSignal), a division of Interactive Data
    Corporation. 2007. All rights reserved. This sample eSignal
    Formula Script (EFS) is for educational purposes only and may be
    modified and saved under a new file name.  eSignal is not responsible
    for the functionality once modified.  eSignal reserves the right
    to modify and overwrite this EFS file with each new release.

Description:        Profit With ETFs
                    by Gerald Gardner and Trent Gardner
Version:            1.0  4/15/2008
Notes:
* June 2008 Issue of Stocks and Commodities Magazine
* Study requires version 8.0 or later.
* Study is configured for back testing only.
**********************************/
function preMain(){
    setStudyTitle("RSI Timing Model");
    setPriceStudy(true);
    setColorPriceBars(true);
    setDefaultPriceBarColor(Color.grey);
    setCursorLabelName("Entry",0);
    setCursorLabelName("Target",1);
    setCursorLabelName("H2",2);
    setPlotType(PLOTTYPE_FLATLINES,0);
    setPlotType(PLOTTYPE_FLATLINES,1);
    setPlotType(PLOTTYPE_FLATLINES,2);
    setDefaultBarFgColor(Color.blue,0);
    setDefaultBarFgColor(Color.red,1);
    setDefaultBarFgColor(Color.red,2);
    setDefaultBarThickness(2,0);
    setDefaultBarThickness(2,1);
    setDefaultBarThickness(2,2);
}
var bInit = false;
var xRSI  = null;
var xSMA  = null;
var BarCounter  = 0;
var bVersion    = null;
var Entry = null;
var Target = null;
var H2 = null;
function main(){
    if (bVersion == null) bVersion = verify();
    if (bVersion == false) return;
    if(bInit == false){
        xRSI  = rsi(2,high());
        xSMA  = sma(200);
        bInit = true;
    }


    if(xSMA.getValue(0) == null || xRSI.getValue(-1) == null || getCurrentBarIndex() == 0) return;

    if(getBarState() == BARSTATE_NEWBAR){
        if(Strategy.isLong()){
            BarCounter++;
        }else{
            BarCounter = 0;
        }
    }

    if (Strategy.isLong() == false) {
        Entry = null;
        Target = null;
        H2 = null;
    }

    if(Strategy.isLong()){
        Target = (high(-2)*1.075);
        H2     = high(-2);
        if(BarCounter == 6){
            Strategy.doSell("TimeOut Exit", Strategy.MARKET, Strategy.THISBAR);
            setPriceBarColor(Color.red);
        }
        else if(high(0) > (high(-2)*1.075) && low(0) < (high(-2)*1.075)){
            Strategy.doSell("Limit Exit", Strategy.LIMIT, Strategy.THISBAR, Strategy.ALL, (high(-2)*1.075));
            setPriceBarColor(Color.cyan);
        }
        else if(close(0) > high(-2)){
            Strategy.doSell("H2 Exit", Strategy.CLOSE, Strategy.THISBAR);
            setPriceBarColor(Color.yellow);
        }
    }

    if(!Strategy.isLong()){
        if(xRSI.getValue(0) < 2 && xRSI.getValue(-1) > 1 && close(0) > xSMA.getValue(0)){
            if(low(0) < (low(-1)*1.025) && high(0) > (low(-1)*1.025)){
                Entry = (low(-1)*1.025);
                Strategy.doLong("Enter Long", Strategy.LIMIT, Strategy.THISBAR, Strategy.DEFAULT, (low(-1)*1.025));
                setPriceBarColor(Color.lime);
                BarCounter = 1;
            }
        }
    }


    return new Array (Entry, Target, H2);
}
function verify() {
    var b = false;
    if (getBuildNumber() < 779) {
        drawTextAbsolute(5, 35, "This study requires version 8.0 or later.",
            Color.white, Color.blue, Text.RELATIVETOBOTTOM|Text.RELATIVETOLEFT|Text.BOLD|Text.LEFT,
            null, 13, "error");
        drawTextAbsolute(5, 20, "Click HERE to upgrade.@URL=https://www.esignal.com/download/default.asp",
            Color.white, Color.blue, Text.RELATIVETOBOTTOM|Text.RELATIVETOLEFT|Text.BOLD|Text.LEFT,
            null, 13, "upgrade");
        return b;
    } else {
        b = true;
    }

    return b;
}
--Jason Keck
eSignal, a division of Interactive Data Corp.
800 815-8256, www.esignalcentral.com
GO BACK
AMIBROKER: RSI TIMING MODEL FOR ETFs
In "Profit With ETFs" by Gerald and Trent Gardner in this issue, the
authors present a simple trading system based on the relative strength
index.

FIGURE 5: AMIBROKER, PORTFOLIO SIMULATION. A portfolio equity chart
(upper pane) is shown together with the system percentage drawdown chart
(lower pane).
Backtesting of the system was performed on a basket on 100 ETFs. Coding
such a system and performing portfolio-level backtesting is very easy in
AmiBroker. It's just a matter of picking the watchlist to test on, setting
up a portfolio money allocation scheme, and setting up the trading entry/exit
rules.
The code listing provided here shows a ready-to-use formula. To use
it, simply enter the code into the Formula Editor, then choose the Tools->
Backtest menu from the editor. You may need to adjust the From-To date
range and define the watchlist for the test using the Filter window. In
a few seconds the portfolio-level backtest is finished and you can display
equity and test reports.
AmiBroker code:
// settings
SetTradeDelays( 0, 0, 0, 0 );
SetOption("MaxOpenPositions", 3 );
SetPositionSize( 33, spsPercentOfEquity );
// trading rules follow
r = RSIa( High, 2 );
/* entry */
Entry = r < 2 AND Ref( r, -1 ) > 1 AND Close > MA( Close, 200 );
EntryPrice = 1.025 * Ref( Low, -1 );
Buy = Ref( Entry, -1 ) AND Low <= EntryPrice;
/* exits */
ApplyStop( stopTypeNBar, stopModeBars, 6 );
ExitAtOpen = Ref( Close > Ref( High, -2 ), -1 );
TargetPrice = 1.075 * Ref( High, -2 );
LimitExit = High >= TargetPrice;
SellPrice = IIf( ExitAtOpen, Open, TargetPrice );
Sell = ExitAtOpen OR LimitExit;
--Tomasz Janeczko
www.amibroker.com
GO BACK
METASTOCK: RSI TIMING MODEL FOR ETFs
It is possible to replicate the test discussed in Gerald and Trent Gardner's
article in this issue, "Profit With ETFs," in MetaStock, but it requires
a slightly unusual setup:
1. Select Tools > the Enhanced System Tester
2. Click New
3. Enter a name, "Timing Model for ETFs"
4. Select the Buy Order tab and enter the following formula:
 RSI(H,2)<2 AND
      Ref(RSI(H,2),-1)>1 AND
    C>Mov(C,200,s)
5. Set the Order Type to Stop Limit
6. Select the Limit or Stop Price and enter the following formula:
L*1.025
7. On the Strategic Delay (bars) line, set Day to 1
8. Select the Sell Order tab and enter the following formula:
C>Ref(H,-2) OR
C>Ref(C*1.075,-2) OR
Simulation.CurrentPositionAge>=6
9. Set the Order Type to Stop Limit
10. Select the Limit or Stop Price and enter the following formula:
If(C>Ref(H,-2), Ref(H,-2),
If(C>Ref(C*1.075,-2) , Ref(C*1.075,-2), C))
11. Click OK to close the system editor.
Then, when running a trading simulation, you must also make one additional
setting change:
1. On the third screen (System Testing Options), click the More button
in the lower-right corner. This brings up a new window.
2. Click the Trade Execution tab.
3. Make sure Realistic Market Prices is not checked.
4. Set the Delay Order Opening value to zero.
5. Click OK to close the window.
6. Continue setting up the simulation as you wish.
Once you have made this setting change, this setting
will remain until you change it to something else.
--William Golson
Equis International
www.MetaStock.com
GO BACK
NEUROSHELL TRADER: RSI TIMING MODEL FOR
ETFs
The Rsi system described by Gerald and Trent Gardner in "Profit With
ETFs" in this issue can be easily implemented in NeuroShell Trader by combining
a few of NeuroShell Trader's 800+ indicators. See Figure 6 for a sample
chart demonstration.

FIGURE 6: NEUROSHELL TRADER, ETF RSI CHART. Here is a NeuroShell
Trader chart that demonstrates Gerald and Trent Gardner's RSI trading system.
To recreate the Gardners' RSI trading strategy, select "New Trading
Strategy..." from the Insert menu and enter the following in the appropriate
locations of the Trading Strategy Wizard:
Buy long, limit order, if all of the following are true:
A<B( RSI( High, 2 ), 2 )
A>B( Lag( RSI( High, 2), 1), 1 )
A>B( Close, Avg( Close, 200 ) )
Limit Price: Multiply2( 1.025, Low )
Sell long, limit order, if all of the following are true:
A=B(Close, Close )
Limit Price: IfThenElse( And2( A>B(Close, Lag(High,2)), BarsSinceFill>=X(Trading
Strategy, 6) ), Low, Mult2(1.075,High) )
To implement the authors' restriction to not trade an additional Etf
if three are already being traded, you can add the following rule to the
long-entry conditions or to a second strategy that utilizes the output
signals of the first:
A<B ( ChartPageSum ( Position (Trading Strategy, 0) ), 3 )
If you have NeuroShell Trader Professional, you can also choose whether
the system parameters should be optimized. After backtesting the trading
strategies, use the "Detailed Analysis ..." button to view the backtest and
trade-by-trade statistics.
Users of NeuroShell Trader can go to the STOCKS & COMMODITIES section
of the NeuroShell Trader free technical support website to download a copy
of this or any previously published Traders' Tips.
For more information on NeuroShell Trader, visit www.NeuroShell.com.
--Marge Sherald, Ward Systems Group, Inc.
301 662-7950, sales@wardsystems.com
www.neuroshell.com
GO BACK
BLOCKS SOFTWARE: RSI TIMING MODEL FOR ETFs
Note: To use the charts and layouts referenced in this article, you
will need the free Blocks software. Go to www.Blocks.com to download the
software and get detailed information on the available datapacks.
The model presented by Gerald and Trent Gardner in their article in
this issue, "Profit With ETFs," can be easily implemented in Blocks. To
download a layout built around this model, click the Share button, click
the Layouts tab, type in "Profit with ETFs," then click the Search button.
Figure 7 shows the "Profit with ETFs" layout in Blocks. We built this
layout using a combination of drag-and-drop conditions from the chart as
well as RealCode conditions that let you take advantage of real .Net code.
Trade entry markers are displayed in green on the chart and trade exit
markers in red.

FIGURE 7: BLOCKS, ETF TRADING MODEL. The scan lights on
the watchlist show you which ETFs in the list are meeting the entry and
exit rules. The condition markers on the chart show when these rules were
met for every point in time on the active symbol.
The watchlist on the left in Figure 7 is a list of all ETFs in the
Blocks database filtered to only scan ETFs with a 90-day average volume
of more than one million shares. The green and red scan lights on the chart
show the ETFs currently passing the entry rules (green) and exit rules
(red). We're using a daily time frame here, but you can chart and scan
on any time frame.
For more information and to view Blocks tutorial videos, go to www.Blocks.com.
-- Patrick Argo and Bruce Loebrich
Worden Brothers, Inc.
GO BACK
STRATASEARCH: RSI TIMING MODEL FOR ETFs
During volatile market periods like we're currently seeing, many traders
move toward less volatile products as well as diversification across industries.
ETFs can be a good option in such cases, so the trading system presented
by Gerald and Trent Gardner in their article in this issue, "Profit With
ETFs," is quite timely.
In our tests of their system, we recreated a sector containing the 100
ETF symbols given in the article and ran the system as described. Indeed,
the system performed as suggested, with many positive qualities. There
was a significant profit, high percentage of profitable trades, low drawdowns,
and short holding periods. A Monte Carlo analysis also showed that these
characteristics carried across the entire range of signals and not just
those from the portfolio selection.

FIGURE 8: STRATASEARCH, ETF TRADING SYSTEM. The results
show a system with significant profit but with a relatively low average
trade return percent.
A primary area of concern for this system, however, is the relatively
low return per trade. At roughly 0.70% return per trade, there is very
little room for spread and slippage. In fact, figuring even half a percentage
point loss for slippage would evaporate the majority of the profits. Nevertheless,
the fact that this system had trades in the market only 25% of the time
means there is significant potential to make improvements to the system.
As with all other Traders' Tips, additional information -- including
plug-ins -- can be found in the Shared Area of the StrataSearch user forum.
This month's plug-in contains a prebuilt trading rule that will allow you
to include this indicator in your automated searches. Simply install the
plug-in and let StrataSearch identify whether there are supporting indicators
that might prove helpful.
//***************************************
// Position Entry
//***************************************
rsi2(high, 2) < 2 and
ref(rsi2(high, 2), -1) > 1 and
close > mov(close, 200, simple)
Order Type: Limit
low * 1.025
//****************************************
// Position Exit
//****************************************
close > ref(high, -2)
Order Type: Limit
ref(high, -2) * 1.075
--Pete Rast
Avarin Systems Inc
www.StrataSearch.com
GO BACK
OMNITRADER: RSI TIMING MODEL FOR ETFs
To help implement the system discussed in Gerald and Trent Gardner's
article in this issue, "Profit With ETFs," we are providing three files:
RsiforEtfs.txt, EtfStop.txt, and GardnerEtfs.ots.
The first file, RsiforEtfs.txt, is an OmniLanguage system that fires
entry signals based on the Gardners' RSI conditions. The second file, EtfStop.txt,
is an OmniLanguage stop that provides exit signals when the Etf closes
above the high two bars prior.
The last file, GardnerEtfs.ots, is the Omnitrader strategy, which implements
the trading methodology the Gardners describe. In addition, the OmniLanguage
indicator StdRsi.txt has been included.
By default, OmniTrader uses a slightly modified Rsi calculation. For
this reason, the StdRsi indicator should be used when using the RsiforEtfs
system (Figure 9).

FIGURE 9: OMNITRADER, ETF trading system. Here's a daily
price chart of IJY with the Gardners' system and strategy plotted.
To use the indicator, first copy the following files to the appropriate
locations:
RSIforETFs.txt (C:\Program Files\Nirvana\OT2008\VBA\Systems), StdRSI.txt
(C:\Program Files\Nirvana\OT2008\VBA\Indicators), ETFStop.txt (C:\Program
Files\Nirvana\OT2008\VBA\Stops), and GardnerETFs.ots (C:\Program Files\Nirvana\OT2008\Strategies).
Next, open OmniTrader and click Edit:OmniLanguage. You should see the
RsiforEtfs, StdRsi, and EtfStop in the Project pane. Click "compile." Now
the code is ready to use.
For more information and complete source code, visit https://www.omnitrader.com/ProSI.
#System
**********************************************************************
* RSI for ETFs (RSIforETFs.txt)
* by Jeremy Williams
* Dec. 10, 2007
*
* Adapted from Technical Analysis of Stocks & Commodities
* June 2008
*
* Summary:
* This system generates signals based on the RSI methodology Gerald
* Gardner described in "Profit With ETF's" from the June 2008 edition
* of Technical Analysis of Stocks & Commodities. For more
* information, see Trader's Tips in the June 2008 issue of Technical
* Analysis of Stocks & Commodities.
*
* Note: Here, the RSI is based on the close.
*
* Parameters:
* Periods - Specifies the number of periods for the RSI calculation
*
**********************************************************************
#Param "Periods",2
Dim myRSI As Single
Calculate the RSI Indicator
myRSI = stdRSI(Periods)
If the entry conditions are met fire a long signal
If (myRSI <2) And (myRSI[1] > 1) Then
Signal = LongSignal
End if
Plot the System with the trigger line
SetScales(0,100)
PlotLabel(2)
Plot("myRSI",myRSI)
#Stop
*******************************************************************
* ETF Stop (ETFStop.txt)
* by Jeremy Williams
* April 14,2008
*
* Adapted from Technical Analysis of Stocks & Commodities
* June 2008
*
* Summary:
*
* This stop generates exit signals when the a bar closes above its
* high from two bars prior. It is described in Gerald
* Gardner's article "Profit With ETF's" from the June 2008 edition
* of Technical Analysis of Stocks & Commodities. For more
* information, see Trader's Tips in the June 2008 issue of Technical
* Analysis of Stocks &Commodities.
*
* Parameters:
*
* Period - Specifies the number of periods used in the calculation
*
********************************************************************
#Param "Periods",2
If exit conditions are met, fire exit signal
If signal = longsignal And c>h[periods] Then
Signal = ExitSignal
Else if signal = shortsignal and c<low[periods] then
Signal = ExitSignal
End if
--Jeremy Williams, Trading Systems Researcher
Nirvana Systems, Inc.
www.omnitrader.com
www.nirvanasystems.com
GO BACK
AIQ: RSI TIMING MODEL FOR ETFs
The AIQ code for Gerald and Trent Gardner's article in this issue, "Profit
With ETFs," is given here. We used the RSI based on the close.
I ran simulations using a list of 447 ETFs. I used a long list because
I noticed that there are not enough trades generated from the system when
shorter lists are used, leaving much of the capital idle.
Since the trading system uses a limit-order entry, we cannot, in good
conscience, use a ranking formula such as relative strength or even the
one the authors suggest (alphabet sort) since we do not know which signals
will get filled first. In order to get an idea of the effect of trade selection,
I ran 20 tests using a random-number generator to choose the trades when
there were more than one trade signal per day (Figure 10).
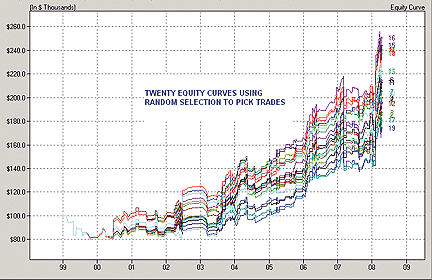
FIGURE 10: AIQ, TRADE SELECTION FOR ETF TRADING SYSTEM.
Here is an example of 20 equity curves generated by using a random-number
generator to choose which signal to trade.
The average return on investment varied from a low of 6.18% per
year to a high of 10.41% per year with an average of 8.34% and a standard
deviation of 1.24. I ran these tests putting 100% of available capital
into each trade with only one trade allowed open at any time. I also ran
a test using relative strength to sort the trades even though it would
be difficult to apply this to actual trading. The relative strength curve
showed a return on investment of 10.11%, which is on the high side compared
to the 20 random curves. The equity curve from this test is shown in Figure
11 and is compared to the S&P 500 index.
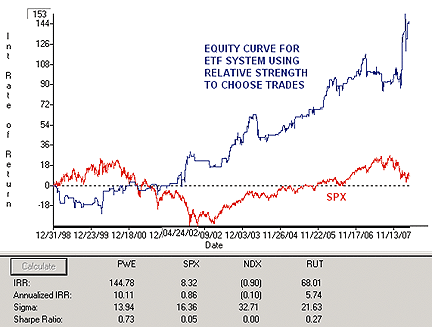
FIGURE 11: AIQ, RETURN ON INVESTMENT. This sample equity
curve was generated by using long-term relative strength (AIQ formula)
to select trades. You can compare this equity curve to the S&P 500
index (SPX).
The AIQ code can be downloaded from the AIQ website at www.aiqsystems.com
and also from www.tradersedge systems.com/traderstips.htm.
!! PROFITING WITH ETFs
! Authors: Gerald Gardner & Trent Gardner, TASC June 2008
! Coded by: Richard Denning 04/10/08
! CODING ABBREVIATIONS:
H    is [high].
H2    is val([high],2).
L    is [low].
L1     is val([low],1).
C    is [close].
C1    is val([close],1).
O    is [open].
PEP    is {position entry price}.
PD    is {position days}.
!! RSI WILDER
! To convert Wilder averaging to exponential averaging:
! ExponentialPeriods = 2 * WilderPeriod - 1.
U     is C - C1.
D     is C1 - C.
W1    is 2.
rsiLen1    is 2 * W1 - 1.
AvgU     is ExpAvg(iff(U>0,U,0),rsiLen1).
AvgD     is ExpAvg(iff(D>=0,D,0),rsiLen1).
rsi2     is 100-(100/(1+(AvgU/AvgD))).
!! TRADING SYSTEM ENTRY RULES:
! 1) Today's close is greater than 200 SMA and
! 2) Today the two-period RSI crosses below 2
! 3) Enter on a limit order next day at today's low times 1.025
! 4) When more signnals than needed choose by alphabetic sort
!    based on the ETFs name
SetUp    if C > simpleavg(C,200) and rsi2 < 2 and valrule(rsi2 >=2,1).
Buy    if valrule(SetUp,1) and L<L1*1.025 and hasdatafor(210)>=201.
EntryPr    is min(O,L1 * 1.025).
!! TRADING SYSTEM EXIT RULES:
! 1) Profit target on limit set to high of two bars ago * 1.075 or
! 2) Next day profit exit if today's close is greater than high of
!          two bars ago then exit at market next day or
! 3) Exit next bar at market if position days >= 6.
ProfitTgt  if H > H2 * 1.075.
ProfitNext if C > H2.
TimeExit   if PD >= 6.
Exit    if ProfitTgt or valrule(ProfitNext,1) or valrule(TimeExit,1).
ExitPrice is iff(ProfitTgt and not valrule(ProfitNext,1) and
       not valrule(TimeExit,1),H2*1.075,iff(valrule(ProfitNext,1),O,
       iff(valrule(TimeExit,1),O,-99))).
--Richard Denning, AIQ Systems
richard.denning@earthlink.net
GO BACK
CQG: RSI TIMING MODEL FOR ETFs
Here is the CQG trading system definition to go with Gerald and Trent
Gardner's article in this issue, "Profit With ETFs."
A CQG component pac is available at the CQG website (https://www.cqg.com/Support/Downloads.aspx)
to install this system in CQG.
Trading system: ETFSystem
    Parameters:
      Target = 1.075
    Costs: 0.00 per trade
    Entry#1
      Name: t1
      Type: Long
      Order: Limit
      Signal: P1:= (Low(@))*1.025;
       t1:= RSI(@,Period:=2,InputChoice:=#High) < 2 AND
            RSI(@,Period:=2,InputChoice:=#High)[-1] > 1 AND
            Close(@) > MA(@,MAType:=Sim,Period:=200,InputChoice:=#Close);

      t1[-1]
      And
      Low(@) <= P1[-1]
      Price: P1:= (Low(@))*1.025;

      P1[-1]
      Limit Price: 0
      Size: 1
      Exit#1 (on)
        Name: x1b
        Order: Limit
        Signal: BarsSinceEntry(@,EntryOffset:=0,EntryType:=All,WhichTrades:=ThisTradeOnly) > 1
         and
        High(@)[-1]>  High(@)[-3]*Target
         and
        Low(@)[-1]>= High(@)[-3]*Target

        Price:  High(@)[-3]*Target
        Limit Price: 0
        Size: OpenPositionEntrySize(@,WhichTrades:=ThisTradeOnly)
      Exit#2 (on)
        Name: x2
        Order: Market
        Signal: X2:= Close(@)>  High(@)[-2];

        X2[-1]
        Price: Open(@)
        Limit Price: 0
        Size: OpenPositionEntrySize(@,WhichTrades:=ThisTradeOnly)
      Exit#3 (on)
        Name: x3
        Order: Market
        Signal:  BarsSinceEntry(@,EntryOffset:=0,EntryType:=All,WhichTrades:=ThisTradeOnly)>=6
        Price:  Open(@)
        Limit Price: 0
        Size: OpenPositionEntrySize(@,WhichTrades:=ThisTradeOnly)
--Thom Hartle
www.CQG.com
GO BACK
ASPEN RESEARCH: RSI TIMING MODEL FOR ETFs
The timing model presented in "Profit With ETFs" by Gerald and Trent
Gardner in this issue can be easily recreated in Aspen Graphics Workstation
4.20. Aspen also offers several ways to view the timing model.
Figure 12 is an overlay on a candlestick chart. It displays not only
the bar in which one should enter and exit a position in IGM, but also
at what price points to set the limits.
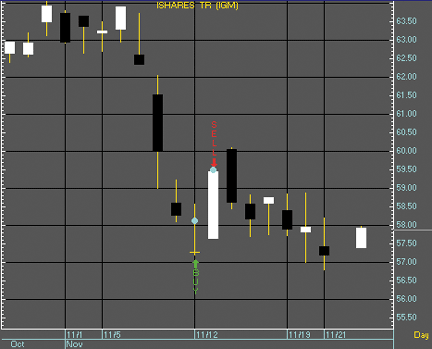
FIGURE 12: NEOTICKER, ETF trading system. The RSI and moving
average system plots current equity in NeoTicker.
Figure 13 presents another way of looking at the same time period
for IGM. An Aspen color rule is used to indicate which bars offer good
entry and exit points according to the timing model.
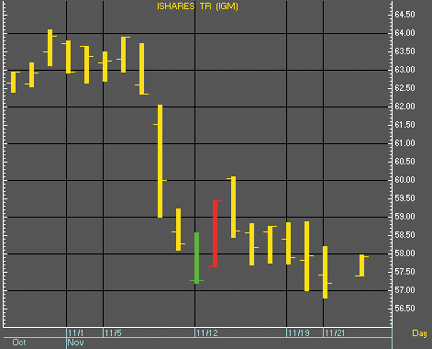
FIGURE 13: NEOTICKER, PERORMANCE REPORT. For a performance
report that provides detailed analysis of the system, right-click "system
plot" on the chart and select Trading System> Open Performance Viewer.
The best approach in Aspen is to create a formula that returns a
minimum number of values. This formula can be used to serve multiple-view
applications and also email alerts and alarms.
Aspen users can download the complete timing model page suite from:
https://www.aspenres.com/forums/viewtopic.php?f=3&t=18.
timingModel(input, period = 200) = begin
retval = nonum
testval = timingModelInTrade($1, 200)
if(testVal == 1 and timingModelInTrade($1, 200)[1] != 1 ) then
retval = buy'|ftiny|clr_green|vertical|arrow|below
if(testVal == 2 and timingModelInTrade($1, 200)[1] != 2 ) then
retval = sell'|ftiny|clr_red|vertical|arrow|above
retval
end
timingPositionVals(input, period = 200, entry = 1.00025, exit = 1.00075) = begin
retval = nonum
testVal = timingModelInTrade($1, period)
testVal2 = timingModelInTrade($1, period)[1]
if(testVal == 1) then retval = $1.low[1] * entry
if(testVal == 2 and testVal2 != 2) then retval = $1 * exit
retval
end
timingModelInTrade(series, period = 200) = begin
retval = timingModelInTrade($1)[1]
percPrice = $1 * 1.075
if(rsi($1.high,2) < 2 and rsi($1.high, 2)[1] > 1 and
$1 > savg($1, period) ) then retval = 1
if(retval == 1 and $1 > $1.high[2] or
$1 > percPrice) then retval = 2
if( retval == nonum) then retval = 0
retval
end
For a free trial of Aspen Graphics, please contact our sales department
at sales@aspenres.com, 800 359-1121, or visit our website at https://aspenres.com.
--Jeremiah Adams
Aspen Research Group, LTD
800 359-1121, support@aspenres.com
GO BACK
NEOTICKER: RSI TIMING MODEL FOR ETFs
Here is the NeoTicker formula language that can be used to implement
the RSI and moving average trading system presented in "Profit With ETFs"
by Gerald and Trent Gardner.
The trading system is named "TASC Profit with ETF" (Listing 1). It has
two parameters: the RSI period and moving average period. Both are integer
values that must be greater than 1. The system plots current equity (Figure
14).
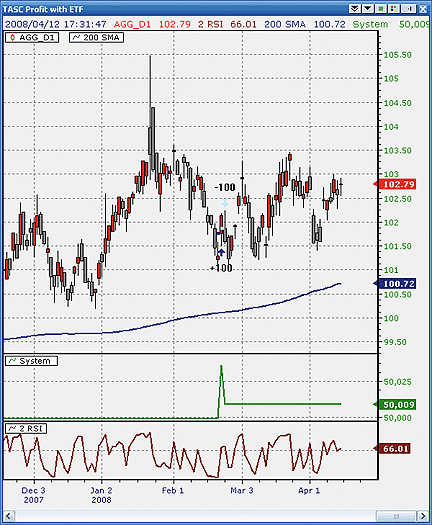
FIGURE 14: NEOTICKER, ETF trading system. The RSI and moving
average system plots current equity in NeoTicker.
The trading system is coded according to the code given in the article's
sidebar. It trades only the long side. For a performance report that provides
detailed analysis of the system, right-click "system plot" on the chart
and select Trading System> Open Performance Viewer (Figure 15).
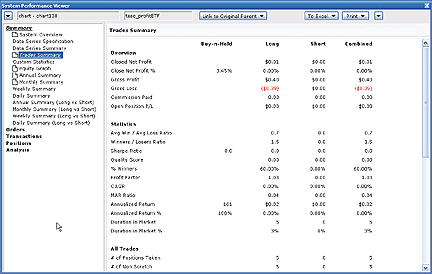
FIGURE 15: NEOTICKER, PERFORMANCE REPORT. For a performance report
that provides detailed analysis of the system, right-click "system plot"
on the chart and select Trading System> Open Performance Viewer.
A downloadable version of this system will be available at NeoTicker's
blog site.
LISTING 1
RSIval := rsindexmod (high, param1);
longlimit ((openpositionflat > 0) and
           (RSIval < 2) and (RSIval(1) > 1) and
           (barsnum > param2) and (data1 > average(data1, param2)),
           low*1.025,
           defaultordersize,
           "long limit signal");
longexitatmarket((openpositionlong > 0) and
                 ((data1 > high(2)) or
                  ((barsnum-openpositionentrybar) > 6)),
                  defaultordersize,
                  "exit stop");
longexitlimit(openpositionlong > 0,
              h(2)*1.075,
              defaultordersize,
              "exit target");
plot1 := currentequity;
--Kenneth Yuen, TickQuest Inc.
www.tickquest.com
GO BACK
NINJATRADER: RSI TIMING MODEL FOR ETFs
The timing model strategy discussed in "Profit With ETFs" by Gerald
and Trent Gardner in this issue is available for download from www.ninjatrader.com/SC/June2008SC.zip.
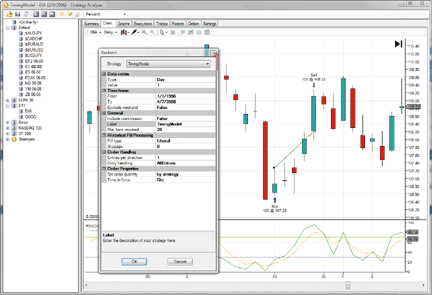
FIGURE 16: NINJATRADER, ETF TIMING MODEL. The screenshot
shows the TimingModel strategy backtested in the Strategy Analyzer against
the DIA ETF.
Once it is downloaded, from within the NinjaTrader Control Center window,
select the menu File > Utilities > Import NinjaScript and select the downloaded
file. This strategy is for NinjaTrader version 6.5 or greater.
You can review the strategy's source code by selecting the menu Tools
> Edit NinjaScript > Strategy from within the NinjaTrader Control Center
window and selecting TimingModel.
NinjaScript strategies are compiled DLLs that run native, not interpreted,
which provides you with the highest performance possible.
--Raymond, NinjaTrader, LLC
www.ninjatrader.com
GO BACK
TRADINGSOLUTIONS: RSI TIMING MODEL FOR
ETFs
In "Profit With ETFs" in this issue, authors Gerald and Trent Gardner
outline an entry/exit system based on several simple rules. The TradingSolutions
formula for this system is shown here and is also available as a function
file that can be downloaded from the TradingSolutions website (www.tradingsolutions.com)
in the Free Systems section.
System Name: ETF Timing System
Inputs: High,, Close
Enter Long when all of these are true:
1. LT (RSI (High, 2), 2)
2. GT (Lag (RSI (High, 2), 1), 1)
3. GT (Close, MA (Close, 200))
4. LE (Close, Lag (High, 2))
Exit Long when any of these are true:
1. GT (Close, Lag (High, 2))
2. GE (Close, Mult (1.075, Lag (High, 2)))
3. Rule_ExitOnLength(6,0)
--Gary Geniesse
NeuroDimension, Inc.
800 634-3327, 352 377-5144
www.tradingsolutions.com
GO BACK
TRADE NAVIGATOR: RSI TIMING MODEL
FOR ETFs
Authors Gerald and Trent Gardner in their article in this issue, "Profit
With ETFs," offer timing rules for trading ETFs.
A complete mechanical trading system based on this strategy can be accessed
by downloading the specially created file, "SC0608." Platinum owners of
Trade Navigator can create their own rules and use the strategy for backtesting
and charting; gold owners are able to download the file and apply the strategy
to a chart.
Strategies are created by clicking Edit and then Strategies. The strategy
consists of four rules, one entry, and one exit. From within the New Strategy
window, click New Rule, then create the rule.
Use the sample chart in Figure 17 and following table to construct the
rules according to specifications.
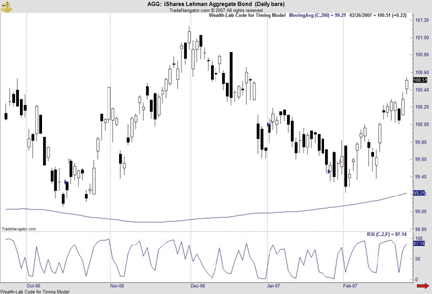
FIGURE 17: TRADE NAVIGATOR, GARDNER TIMING MODEL. Here is
the Gardners' RSI and moving average timing model applied to a chart of
AGG (ishares Lehman Aggregate Bond).
Rules:
Rule Name:    Beyond 7.5% Increase of Two Days Ago
Condition:    IF True
Action:    Long Exit (SELL)
Order Type:    Limit
Limit Price:    Close.2 * 1.075
Exit on Entry Bar:    True
_____________________________________________________________
Rule Name:    Exceed High of Two Days Ago
Condition:    IF True
Action:    Long Exit (SELL)
Order Type:    LIMIT
Limit Price:    High.2
Exit on Entry Bar:    True
_____________________________________________________________
Rule Name:    Six Day Exit
Condition:    IF Bars Since Entry >= 6
Action:    Long Exit (SELL)
Order Type:    MARKET
Exit on Entry Bar:    False
_____________________________________________________________
Rule Name:   Trade Entry Long
Condition:   IF RSI (High, 2, False) < 2 And RSI (High, 2, False) > 1 And Close > Moving Avg. (Close, 200)
Action:      Long Entry
Order Type:  Market
After creating the four rules, save the strategy.
The downloadable file for this month includes a symbol group made up
of ETFs. This should provide the basket of symbols that the article endorses
for use with the strategy. To download the file, click on File and then
Update Data. Click Download Special File and type "SC0608." Click Start,
and then follow the upgrade prompts.
--Dave Kilman
Genesis Financial Technologies, Inc.
www.GenesisFT.com
GO BACK
VT TRADER: RSI TIMING MODEL FOR ETFs
In "Profit With ETFs" in this issue, Gerald and Trent Gardner discuss
the use of a simple RSI and moving average trading system to trade ETFs
(or other tradable instruments). The VT Trader code and instructions for
recreating the Gardners' trading system are as follows.
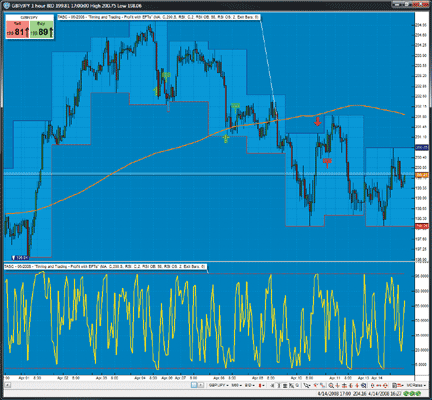
FIGURE 18: VT TRADER, GARDNER TRADING SYSTEM. Here is the
Gardners' RSI and moving average trading system on a GBP/JPY one-hour candle
chart.
Gardner's RSI/Moving Average Trading System
1. Navigator Window>Tools>Trading Systems Builder>[New] button
2. In the Indicator Bookmark, type the following text for each field:
Name: TASC - 06/2008 - Gardner's Traders Tip
Short Name: tasc_Gardmer
Label Mask: TASC - 06/2008 - Gardner's Traders Tip (MA: %pr1%,%tp1%,%mTp1%,
   RSI: %rsipr%,%rsitpr%, RSI OB: %RSIOBL%, RSI OS: %RSIOSL%, Exit Bars: %ExitTradeBars%)
3. In the Input Bookmark, create the following variables:
[New] button... Name: pr1 , Display Name: MA Price , Type: price , Default: Close
[New] button... Name: tp1 , Display Name: MA Periods , Type: integer , Default: 200
[New] button... Name: mTp1 , Display Name: MA Type , Type: MA Type , Default: Simple
[New] button... Name: rsipr , Display Name: RSI Price , Type: Price , Default: Close
[New] button... Name: rsitpr , Display Name: RSI Periods , Type: integer , Default: 2
[New] button... Name: RsiOBL , Display Name: RSI Overbought Level , Type: integer , Default: 98
[New] button... Name: RSIOSL , Display Name: RSI Oversold Level , Type: integer , Default: 2
[New] button... Name: ExitTradeBars , Display Name: Exit Trade After n-Bars? ,
   Type: integer (with bounds) , Default: 6
4. In the Output Bookmark, create the following variables:
    [New] button...
Var Name: MA
Name: MA
* Checkmark: Indicator Output
Select Indicator Output Bookmark
Color: blue
Line Width: slightly thicker
Line Style: solid
Placement: Price Frame
    [OK] button...
    [New] button...
Var Name: RSIndex
Name: RSI
* Checkmark: Indicator Output
Select Indicator Output Bookmark
Color: green
Line Width: thin
Line Style: solid
Placement: Additional Frame 1
    [OK] button...
    [New] button...
Var Name: RSIOB
Name: RSI Overbought Level
* Checkmark: Indicator Output
Select Indicator Output Bookmark
Color: red
Line Width: thin
Line Style: dashed
Placement: Additional Frame 1
    [OK] button...
    [New] button...
Var Name: RSIOS
Name: RSI Oversold Level
* Checkmark: Indicator Output
Select Indicator Output Bookmark
Color: red
Line Width: thin
Line Style: dashed
Placement: Additional Frame 1
    [OK] button...
    [New] button...
Var Name: LongEntrySignal
Name: LongEntrySignal
Description: Long Entry Signal Alert
* Checkmark: Graphic Enabled
* Checkmark: Alerts Enabled
Select Graphic Bookmark
Font [...]: Up Arrow
Size: Medium
Color: Blue
Symbol Position: Below price plot
Select Alerts Bookmark
Alerts Message: Long Entry Signal!
Choose sound for audible alert
[OK] button...
[New] button...
Var Name: LongExitSignal
Name: LongExitSignal
Description: Long Exit Signal Alert
* Checkmark: Graphic Enabled
* Checkmark: Alerts Enabled
Select Graphic Bookmark
Font [...]: Exit Sign
Size: Medium
Color: Blue
Symbol Position: Above price plot
Select Alerts Bookmark
Alerts Message: Long Exit Signal!
Choose sound for audible alert
[OK] button...
[New] button...
Var Name: ShortEntrySignal
Name: ShortEntrySignal
Description: Short Entry Signal Alert
* Checkmark: Graphic Enabled
* Checkmark: Alerts Enabled
Select Graphic Bookmark
Font [...]: Down Arrow
Size: Medium
Color: Red
Symbol Position: Above price plot
Select Alerts Bookmark
Alerts Message: Short Entry Signal!
Choose sound for audible alert
[OK] button...
[New] button...
Var Name: ShortExitSignal
Name: ShortExitSignal
Description: Short Exit Signal Alert
* Checkmark: Graphic Enabled
* Checkmark: Alerts Enabled
Select Graphic Bookmark
Font [...]: Exit Sign
Size: Medium
Color: Red
Symbol Position: Below price plot
Select Alerts Bookmark
Alerts Message: Short Exit Signal!
Choose sound for audible alert
[OK] button...
[New] button...
Var Name: OpenBuy
Name: OpenBuy
Description: Automated Open Buy Trade Command
* Checkmark: Trading Enabled
Select Trading Bookmark
Trade Action: Buy
Traders Range: 5
Hedge: no checkmark
EachTick Count: 1
[OK] button...
[New] button...
Var Name: CloseBuy
Name: CloseBuy
Description: Automated Close Buy Trade Command
* Checkmark: Trading Enabled
Select Trading Bookmark
Trade Action: Sell
Traders Range: 5
Hedge: no checkmark
EachTick Count: 1
[OK] button...
[New] button...
Var Name: OpenSell
Name: OpenSell
Description: Automated Open Sell Trade Command
* Checkmark: Trading Enabled
Select Trading Bookmark
Trade Action: Sell
Traders Range: 5
Hedge: no checkmark
EachTick Count: 1
[OK] button...
[New] button...
Var Name: CloseSell
Name: CloseSell
Description: Automated Close Sell Trade Command
* Checkmark: Trading Enabled
Select Trading Bookmark
Trade Action: Buy
Traders Range: 5
Hedge: no checkmark
EachTick Count: 1
[OK] button...
5. In the Formula Bookmark, copy and paste the following formula:
{Provided By: Visual Trading Systems, LLC & Capital Market Services, LLC (c) Copyright 2008}
{Description: RSI & Moving Average Trading System}
{Notes: June 2008 T.A.S.C. magazine - Gerald & Trend Gardner's Traders Tip}
{tasc_Gardner Version 1.0}
{Moving Average}
MA:= mov(pr1,tp1,mTp1);
{Relative Strength Index}
rsi_r:= (rsipr - ref(rsipr,-1));
rsi_rs:= Wilders(if(rsi_r>0,rsi_r,0),rsitpr) / Wilders(if(rsi_r<0,Abs(rsi_r),0),rsitpr);
RSIndex:= 100-(100/(1+rsi_rs));
RSIOB:= RsiOBL;
RSIOS:= RSIOSL;
{Define Final Trade Entry/Exit Criteria}
LongEntryCond1:= C>MA;
LongEntryCond2:= RSIndex<RSIOS;
LongEntryCond3:= ref(RSIndex,-1)>(RSIOS-1);
ShortEntryCond1:= C<MA;
ShortEntryCond2:= RSIndex>RSIOB;
ShortEntryCond3:= ref(RSIndex,-1)<(RSIOB+1);
LongEntrySetup:= Cross((LongEntryCond1+LongEntryCond2+LongEntryCond3),2.5);
LongExitSetup:= Cross((ShortEntryCond1+ShortEntryCond2+ShortEntryCond3),2.5);
ShortEntrySetup:= Cross((ShortEntryCond1+ShortEntryCond2+ShortEntryCond3),2.5);
ShortExitSetup:= Cross((LongEntryCond1+LongEntryCond2+LongEntryCond3),2.5);
{Define Final Trade Entry/Exit Signal Criteria}
LongEntrySignal:= (LongTradeAlert=0 AND ShortTradeAlert=0 AND LongEntrySetup) OR
                  (LongTradeAlert=0 AND Cross(0.5,ShortTradeAlert) AND LongEntrySetup) OR
                  (LongTradeAlert=0 AND ShortExitSetup);
LongEntryPrice:= valuewhen(1,LongEntrySignal,C);
BarsSinceLongEntry:= BarsSince(LongEntrySignal);
LongEntryInitialStop:= if(LongTradeAlert=1 OR LongEntrySignal OR LongExitSignal,
                       LongEntryPrice - (ref(C,-2)*0.75), null);
LongEntryProfitTarget:= if(LongTradeAlert=1 OR LongEntrySignal OR LongExitSignal,
                        LongEntryPrice + (ref(C,-2)*0.75), null);
LongExitSignal:= (LongTradeAlert=1 AND Cross(LongEntryInitialStop,C))
              OR (LongTradeAlert=1 AND Cross(C,LongEntryProfitTarget))
              OR (LongTradeAlert=1 AND BarsSinceLongEntry=ExitTradeBars)
              OR (LongTradeAlert=1 AND LongExitSetup);
LongExitPrice:= valuewhen(1,LongExitSignal,C);
ShortEntrySignal:= (ShortTradeAlert=0 AND LongTradeAlert=0 AND ShortEntrySetup) OR
                   (ShortTradeAlert=0 AND Cross(0.5,LongTradeAlert) AND ShortEntrySetup) OR
                   (ShortTradeAlert=0 AND LongExitSetup);
ShortEntryPrice:= valuewhen(1,ShortEntrySignal,C);
BarsSinceShortEntry:= BarsSince(ShortEntrySignal);
ShortEntryInitialStop:= if(ShortTradeAlert=1 OR ShortEntrySignal OR ShortExitSignal,
                        ShortEntryPrice + (ref(C,-2)*0.75), null);
ShortEntryProfitTarget:= if(ShortTradeAlert=1 OR ShortEntrySignal OR ShortExitSignal,
                         ShortEntryPrice - (ref(C,-2)*0.75), null);
ShortExitSignal:= (ShortTradeAlert=1 AND Cross(C,ShortEntryInitialStop))
               OR (ShortTradeAlert=1 AND Cross(ShortEntryProfitTarget,C))
               OR (ShortTradeAlert=1 AND BarsSinceShortEntry=ExitTradeBars)
               OR (ShortTradeAlert=1 AND ShortExitSetup);
ShortExitPrice:= valuewhen(1,ShortExitSignal,C);
{Simulated Open Trade Determination and Trade Direction}
LongTradeAlert:= SignalFlag(LongEntrySignal,LongExitSignal);
ShortTradeAlert:= SignalFlag(ShortEntrySignal,ShortExitSignal);
{Create Auto-Trading Functionality}
OpenBuy:= LongEntrySignal and (eventCount('OpenBuy')=eventCount('CloseBuy'));
CloseBuy:= LongExitSignal and (eventCount('OpenBuy')>eventCount('CloseBuy'));
OpenSell:= ShortEntrySignal and (eventCount('OpenSell')=eventCount('CloseSell'));
CloseSell:= ShortExitSignal and (eventCount('OpenSell')>eventCount('CloseSell'));
6. Click the "Save" icon to finish building the Gardner's trading system.
To attach the trading system to a chart (Figure 18), select the "Add Trading
System" option from the chart's contextual menu, select "TASC - 06/2008
-- Gardners Traders Tip" from the trading systems list, and click the [Add]
button.
To learn more about VT Trader, visit www.cmsfx.com.
--Chris Skidmore, CMS Forex
(866) 51-CMSFX, trading@cmsfx.com
www.cmsfx.com
GO BACK
MISTIGRIFX: RSI TIMING MODEL FOR ETFs
Here is code for use in Mistigri FX to go with the article, "Profit
With ETFs," by Gerald and Trent Gardner in this issue.
//+--------
+
//|                                TASC062008-TimingModel.mq4 |
//|                            Copyright © 2008, MistigriFX.com |
//|                                   https://www.MistigriFX.com |
//+--------
+
#property copyright "Copyright © 2008, MistigriFX.com"
#property link      "https://www.MistigriFX.com"
//+--------
+
//| expert extern inputs                                             |
//+--------
+
extern double        Lots = 0.01;
extern int     TakeProfit = 50;
extern int       StopLoss = 50;
extern int    MagicNumber = 98878787;
//+--------
+
//| expert Global Vars                                               |
//+--------
+
datetime  CurrTime = 0;
datetime  PrevTime = 0;
  string   Symbole = "";
     int TimeFrame = 0;
     int    Ticket = 0;
//+--------
+
//| expert init / deinit                                             |
//+--------
+
int init()
{
    CurrTime = iTime( Symbole, TimeFrame, 1 );
    PrevTime = iTime( Symbole, TimeFrame, 2 );
     Symbole = Symbol();
   TimeFrame = PERIOD_D1;
// The system was developped for Daily data but you could replace
// PERIOD_D1 with 0 for testing other timeframes.
   return(0);
}
int deinit() { return(0); }
//+--------
+
//| expert start function                                            |
//+--------
+
int start()
{
   CurrTime = iTime( Symbole, TimeFrame, 1 );
   if( CurrTime != PrevTime )
   {
         double  RSI1 =   iRSI( Symbole, TimeFrame, 2, PRICE_HIGH, 1 );
         double  RSI2 =   iRSI( Symbole, TimeFrame, 2, PRICE_HIGH, 2 );
         double   SMA =    iMA( Symbole, TimeFrame, 200, 0, MODE_SMA, PRICE_CLOSE, 1 );
         double CLOSE = iClose( Symbole, TimeFrame, 1 );
         double CLOS2 = iClose( Symbole, TimeFrame, 3 );
         double HIGH2 =  iHigh( Symbole, TimeFrame, 3 );

      //----
      if( CountAll( Symbole, MagicNumber ) == 0 )
      {
         if( RSI1 < 2.0 && RSI2 > 1.0 && CLOSE > SMA )
         {
            RefreshRates();
            Ticket = OrderSend( Symbole, OP_BUY, Lots, Ask, 0, Ask - ( StopLoss * Point ),
                     Bid + ( TakeProfit * Point ), "", MagicNumber, 0, Green );
            if( Ticket < 0 )
            {
               Alert( GetLastError() );
               return(-1);
            }
         }
         // This is not for ETF so why not use Sell Signals as well :)
         else
         if( RSI1 > 98.0 && RSI2 < 99.0 && CLOSE < SMA )
         {
            RefreshRates();
            Ticket = OrderSend( Symbole, OP_SELL, Lots, Bid, 0, Bid + ( StopLoss * Point ),
                     Ask - ( TakeProfit * Point ), "", MagicNumber, 0, Red );
            if( Ticket < 0 )
            {
               Alert( GetLastError() );
               return(-1);
            }
         }
      }
      else
      {
         OrderSelect( Ticket, SELECT_BY_TICKET, MODE_TRADES );

         if(                            CLOSE > HIGH2 ||
             ( ( CLOSE - CLOS2 )/ CLOSE )*100.0 > 7.5 ||
             TimeDay( CurrTime - OrderOpenTime() ) > 6
         )
         {
            if( OrderType() == OP_BUY  ) { OrderClose( Ticket, OrderLots(),Ask, 0 , Pink); }
            if( OrderType() == OP_SELL ) { OrderClose( Ticket, OrderLots(),Bid, 0 , Pink); }
         }
      }
      PrevTime = CurrTime;
   }
   //----
   return(0);
}
//+--------
+
//+--------
+
//+   CountAll Function                                              |
//+--------
+
int CountAll( string Sym, int Mgc )
{
   int Count = 0;

   for( int i = OrdersTotal()-1; i >=0; i-- )
   {
      OrderSelect( i, SELECT_BY_POS, MODE_TRADES );
      if( OrderSymbol() == Sym )
      {
         if( OrderMagicNumber() == Mgc ) { Count++; }
      }
   }
   return( Count );
}
-- Patrick Nouvion
MistigriFX.com, a div. of Mistigri.net
admin@mistigri.net
GO BACK
Return to June 2008 Contents
Originally published in the June 2008 issue of Technical Analysis
of STOCKS & COMMODITIES magazine. All rights reserved. © Copyright
2008, Technical Analysis, Inc.


