August 2008
TRADERS' TIPS
You can copy these formulas and programs for easy use in your spreadsheet or analysis software. Simply "select" the desired text by highlighting as you would in any word processing program, then use your standard key command for copy or choose "copy" from the browser menu. The copied text can then be "pasted" into any open spreadsheet or other software by selecting an insertion point and executing a paste command. By toggling back and forth between an application window and the open Web page, data can be transferred with ease.
This month's tips include formulas and programs for:
TRADESTATION: PREMIER STOCHASTIC OSCILLATOR
WEALTH-LAB: PREMIER STOCHASTIC OSCILLATOR
eSIGNAL: PREMIER STOCHASTIC OSCILLATOR
AMIBROKER: PREMIER STOCHASTIC OSCILLATOR
METASTOCK: PREMIER STOCHASTIC OSCILLATOR
NEUROSHELL TRADER: PREMIER STOCHASTIC OSCILLATOR
WORDEN BROTHERS BLOCKS: PREMIER STOCHASTIC OSCILLATOR
STRATASEARCH: PREMIER STOCHASTIC OSCILLATOR
AIQ: PREMIER STOCHASTIC OSCILLATOR
TD AMERITRADE: PREMIER STOCHASTIC OSCILLATOR
CQG: PREMIER STOCHASTIC OSCILLATOR
ASPEN RESEARCH: PREMIER STOCHASTIC OSCILLATOR
NEOTICKER: PREMIER STOCHASTIC OSCILLATOR
INVESTOR/RT: PREMIER STOCHASTIC OSCILLATOR
METATRADER 4: PREMIER STOCHASTIC OSCILLATOR
NINJATRADER: PREMIER STOCHASTIC OSCILLATOR
MULTICHARTS: PREMIER STOCHASTIC OSCILLATOR
VT TRADER: PREMIER STOCHASTIC OSCILLATOR
or return to August 2008 Contents
Editor's note: This month's Traders' Tips are based on Lee Leibfarth's article in this issue, "Premier Stochastic Oscillator."
Code for TradeStation is already provided in Leibfarth's article. Additional EasyLanguage code contributed by TradeStation is presented here.
Readers will find our Traders' Tips section in its entirety at the STOCKS & COMMODITIES website at www.Traders.com in the Traders' Tips area, from where the code can be copied and pasted into the appropriate program. In addition, the code for each program is usually available at the respective software company's website. Thus, no retyping of code is required for Internet users.
For subscribers, the EasyLanguage code found in Leibfarth's article
in this issue can be copied and pasted into TradeStation from the Subscriber
Area at www.Traders.com. Login is required.
TRADESTATION: PREMIER STOCHASTIC OSCILLATOR
Lee Leibfarth's article in this issue, "Premier Stochastic Oscillator," describes an update to the classic stochastic indicator. We have developed EasyLanguage code to allow this indicator to be applied to a list of symbols in a RadarScreen window.
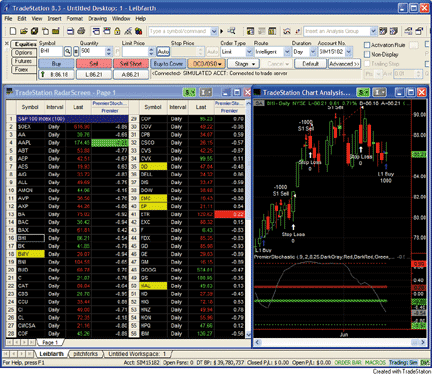
FIGURE 1: TRADESTATION, PREMIER STOCHASTIC OSCILLATOR. Here is a demonstration of the PremierStochasticRS indicator applied to a list of symbols in RadarScreen (left). Green cells indicate a cross down through a trigger line. A red cell denotes a cross up through a trigger line. A chart of BHI with the premier stochastic indicator applied is also shown (right). The chart uses different EasyLanguage code than the RadarScreen, but the calculations are the same. The premier stochastic strategy is running on the BHI chart. A cross down took place on the previous bar, so a long entry is visible on the current bar.The indicator code highlights indicator crosses of various trigger lines. When the indicator crosses down through a trigger line, the background of the RadarScreen cell for the associated symbol turns a shade of green. When the indicator crosses up through a trigger line, the background color of the cell for that symbol turns a shade of red.
To download the EasyLanguage code for this study and for the original premier stochastic oscillator indicator and strategy, go to the TradeStation and EasyLanguage Support Forum (https://www.tradestation.com/Discussions/forum.aspx?Forum_ID=213). Search for the file "LeibfarthPremier.Eld."
This article is for informational purposes. No type of trading or investment
recommendation, advice, or strategy is being made, given, or in any manner
provided by TradeStation Securities or its affiliates.
Indicator:  PremierStochasticRS
inputs:
    Line1( 0.9 ),
    Line2( 0.2 ),
    StochLength( 8 ),
    Period( 25 ),
    ColorPremier( Yellow ),
    ColorLine1( Magenta ),
    ColorLine2( Red ),
    ColorLine3( DarkGreen ),
    ColorLine4( Green ) ,
    TextColor1( White ),
    TextColor2( White ),
    TextColor3( White ),
    TextColor4( Black ) ;
variables:
    DummyVar( 0 ),
    oFastK( 0 ),
    oFastD( 0 ),
    oSlowK( 0 ),
    oSlowD( 0 ),
    Length( 0 ),
    NormStoch( 0 ),
    SmoothStoch( 0 ),
    eValue( 0 ),
    Premier( 0 ) ;
DummyVar = Stochastic( High, Low, Close, StochLength, 1,
 3, 1, oFastK, oFastD, oSlowK, oSlowD ) ;
Length = iff( Period < 0, 1, SquareRoot( Period ) ) ;
NormStoch = 0.1 * ( oSlowK - 50 ) ;
SmoothStoch = XAverage( XAverage( NormStoch, Length ),
 Length ) ;
eValue = ExpValue( SmoothStoch ) ;
Premier = ( eValue - 1 ) / ( eValue + 1 ) ;
Plot1( Premier, "Premier" ) ;
if Premier crosses over Line1 then
    begin
    SetPlotBGColor( 1, ColorLine1 ) ;
    SetPlotColor( 1, TextColor1 ) ;
    end
else if Premier crosses over Line2 then
    begin
    SetPlotBGColor( 1, ColorLine2 ) ;
    SetPlotColor( 1, TextColor2 ) ;
    end
else if Premier crosses under -Line1 then
    begin
    SetPlotBGColor( 1, ColorLine3 ) ;
    SetPlotColor( 1, TextColor3 ) ;
    end
else if Premier crosses under -Line2 then
    begin
    SetPlotBGColor( 1, ColorLine4 ) ;
    SetPlotColor( 1, TextColor4 ) ;
    end ;
--Mark Mills
TradeStation Securities, Inc.
A subsidiary of TradeStation Group, Inc.
www.TradeStation.com
WEALTH-LAB: PREMIER STOCHASTIC OSCILLATOR
Here is the C# code that implements the premier stochastic oscillator (PSO), as described in Lee Leibfarth's article in this issue, in Wealth-Lab Developer 5.1.
We've set up a system with entries triggered by the premier stochastic oscillator and a pair of percentage-based profit target and stop-loss exits. Following Leibfarth's guidelines on keeping the reward/risk ratio, a profit target by default is twice the size of the stop-loss -- but you can interactively configure all of them by simply dragging the parameter sliders (see the lower-left corner of Figure 2).
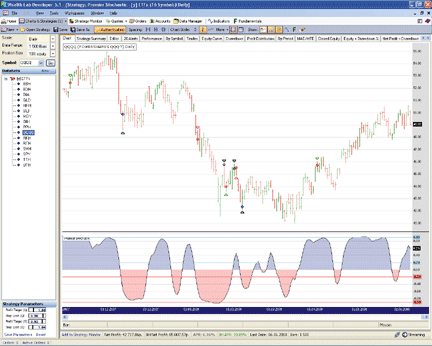
FIGURE 2: WEALTH-LAB, PREMIER STOCHASTIC OSCILLATOR. The premier stochastic oscillator turned out to be a timely countertrend technique.A test of this strategy on a portfolio of liquid ETFs revealed its profitability without optimization, and the drawdown was quite moderate (Figure 3).
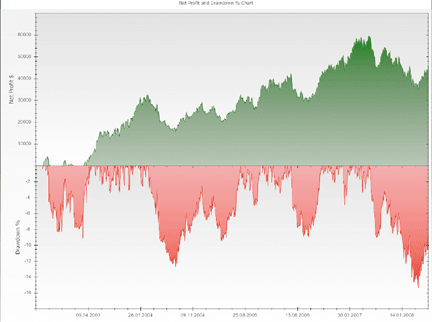
FIGURE 3: WEALTH-LAB, PROFIT. Here is a combined view of net profit and drawdown (%) from the premier stochastic strategy in WL Developer 5.1.
Strategy Code:
using System;
using System.Collections.Generic;
using System.Text;
using System.Drawing;
using WealthLab;
using WealthLab.Indicators;
namespace WealthLab.Strategies
{
    // Premier Stochastic
    public class PremierStochastic : DataSeries
    {
        public PremierStochastic(Bars bars): base(bars, "Premier Stochastic")
        {
            this.FirstValidValue = 8*3;
            EMACalculation m = EMACalculation.Modern;
            StochK K = StochK.Series( bars, 8 );
            EMA S = EMA.Series( EMA.Series( ( (K - 50) * 0.1 ), 5, m ), 5, m );
            for (int bar = FirstValidValue; bar < bars.Count; bar++)
            {
                this[bar] = ( Math.Exp( S[bar] ) - 1 ) / ( Math.Exp( S[bar] ) + 1 );
            }
        }
        public static PremierStochastic Series(Bars bars)
        {
            string description = string.Concat(new object[] { "PremierStochastic" });
            if (bars.Cache.ContainsKey(description))
            {
                return (PremierStochastic)bars.Cache[description];
            }
            PremierStochastic _PremierStochastic = new PremierStochastic(bars);
            bars.Cache[description] = _PremierStochastic;
            return _PremierStochastic;
        }
    }

    public class PremierStochasticStrategy : WealthScript
    {
        private StrategyParameter paramPTShort;
        private StrategyParameter paramPTLong;
        private StrategyParameter paramSLShort;
        private StrategyParameter paramSLLong;

        public PremierStochasticStrategy()
        {
            paramPTLong = CreateParameter("Profit Target (L)", 1.08, 1.01, 1.30, 0.01);
            paramSLLong = CreateParameter("Stop Loss (L)", 0.96, 0.85, 0.99, 0.01);
            paramPTShort = CreateParameter("Profit Target (S)", 0.92, 0.70, 0.99, 0.01);
            paramSLShort = CreateParameter("Stop Loss (S)", 1.04, 1.01, 1.15, 0.01);
        }

        protected override void Execute()
        {
            PremierStochastic PS = PremierStochastic.Series( Bars );
            bool xo1, xo2, xu1, xu2;
            double stop, profit;

            for(int bar = PS.FirstValidValue; bar < Bars.Count; bar++)
            {
                xo1 = CrossOver(bar, PS, -0.9);
                xo2 = CrossOver(bar, PS, -0.2);
                xu1 = CrossUnder(bar, PS, 0.9);
                xu2 = CrossUnder(bar, PS, 0.2);

                if (IsLastPositionActive)
                {
                    Position p = LastPosition;
                    if ( p.PositionType == PositionType.Long  )
                    {
                        stop = p.EntryPrice * paramSLLong.Value;
                        profit = p.EntryPrice * paramPTLong.Value;
                    } else
                    {
                        stop = p.EntryPrice * paramSLShort.Value;
                        profit = p.EntryPrice * paramSLShort.Value;
                    }
                    if( !ExitAtStop( bar+1, p, stop, "Stop Loss" ) )
                        ExitAtLimit( bar+1, p, profit, "Profit Target" );
                }
                else
                {
                    if( xo1 || xo2 )
                    {
                        if( ShortAtMarket( bar+1 ) != null )
                            LastPosition.Priority = -PS[bar];
                    } else
                        if( xu1 || xu2 )
                    {
                        if( BuyAtMarket( bar+1 ) != null )
                            LastPosition.Priority = PS[bar];
                    }
                }
            }

            HideVolume();
            ChartPane psPane = CreatePane( 40, false, true );
            DrawHorzLine( psPane, 0.90, Color.LightBlue, LineStyle.Solid, 2 );
            DrawHorzLine( psPane, 0.20, Color.LightBlue, LineStyle.Solid, 2 );
            DrawHorzLine( psPane, -0.20, Color.LightCoral, LineStyle.Solid, 2 );
            DrawHorzLine( psPane, -0.90, Color.LightCoral, LineStyle.Solid, 2 );
            PlotSeriesOscillator( psPane, PS, 0, 0, Color.FromArgb(60, Color.Blue),
                Color.FromArgb(60,Color.Red), Color.Transparent, LineStyle.Solid, 1 );
            PlotSeries( psPane, PS, Color.Black, LineStyle.Solid, 1 );
        }
    }
}
--Eugene
www.wealth-lab.com
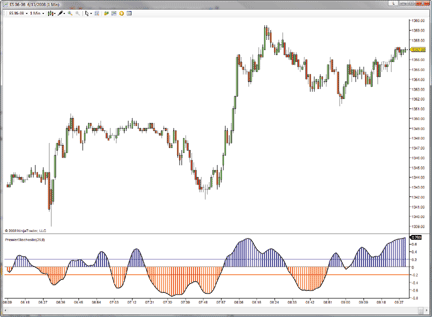
eSIGNAL: PREMIER STOCHASTIC OSCILLATOR
For this month's Traders' Tip, we've provided the formulas PremierStochastic.efs and Pso_Strategy.efs, based on the formula code from Lee Leibfarth's article in this issue, "Premier Stochastic Oscillator."
Both studies contain formula parameters that may be configured through the Edit Studies option to set the values for stochastic length, period, line 1, and line 2. The Pso_Strategy.efs study is also back-testing compatible and contains two additional formula parameters for the profit target and stop-loss percentages, which have been set at defaults of 3.0% and 1.5%, respectively.
The strategy formula draws labels on the indicator pane to highlight the entry and exit trades. The LE and SE labels represent long and short entry trades. LT, LS, ST, and SS represent the profit target and stop exit trades. See Figures 4 and 5.
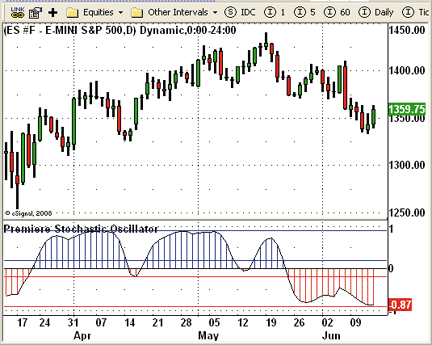
FIGURE 4: eSIGNAL, PREMIER STOCHASTIC OSCILLATOR. This eSignal chart shows the premier stochastic oscillator indicator, PremierStochastic.efs, on a daily chart of ES #F.To discuss this study or download a complete copy of the formula code, please visit the EFS Library Discussion Board forum under the Forums link at www.esignalcentral.com or visit our Efs KnowledgeBase at www.esignalcentral.com/support/kb/efs/. The eSignal formula scripts (EFS) are also available for copying and pasting from the STOCKS & COMMODITIES website at Traders.com.
FIGURE 5: eSIGNAL, PREMIER STOCHASTIC STRATEGY. This eSignal chart shows the premier stochastic strategy, PSO_Strategy.efs, on a daily chart of ES #F.
--Jason Keck
eSignal, a division of Interactive Data Corp.
800 815-8256, www.esignalcentral.com
AMIBROKER: PREMIER STOCHASTIC OSCILLATOR
In "Premier Stochastic Oscillator" in this issue, Lee Leibfarth presents a fast-reacting indicator derived from the classic stochastic indicator.
Implementing the premier stochastic indicator using the AmiBroker Formula Language is straightforward.
Listing 1 shows a ready-to-use formula consisting of both the indicator and trading system. To use it, simply enter the code into the Formula Editor, then choose the Tools->Apply Indicator menu from the editor. To backtest the trading system, use the Tools->Backtest menu from the editor.
Please be sure to enable long and short positions in the Automatic Analysis Settings screen. You may use the Parameters window (available from the right-click menu) to adjust the stochastic and smoothing periods.
To display entry and exit arrows, click with the right-mouse button over the backtest trade list and choose "Show arrows for actual trades." See Figure 6.
FIGURE 6: AMIBROKER, PREMIER STOCHASTIC INDICATOR. This AmiBroker chart shows a daily chart of ER2 (upper pane) with trade arrows, the premier stochastic indicator (middle pane), and system equity in the bottom pane, replicating the chart from Leibfarth's article.
LISTING 1
StochLen = Param("Stoch Len", 8, 3, 30 );
Period = Param("Smooth Period", 25, 5, 100 );
SK = StochK( StochLen, 1 );
Len = sqrt( Period );
NormStochK = 0.1 * ( SK - 50 );
SmoothStoch = EMA( EMA( NormStochK, Len ), Len );
expSS = exp( SmoothStoch );
Premier = ( expSS - 1 )/( expSS + 1 );
Plot( Premier, "Premier", colorBlack, styleThick );
Plot( Premier, "", IIf( Premier < 0, colorRed, colorBlue ), styleHistogram );
Plot( 0.2, "", colorBlue );
Plot( 0.9, "", colorBlue );
Plot( -0.2, "", colorRed );
Plot( -0.9, "", colorRed );
Short = Cross( Premier, -0.9 ) OR Cross( Premier, -0.2 );
Buy = Cross( 0.9, Premier ) OR Cross( 0.2, Premier );
Sell = Cover = 0;
ApplyStop( stopTypeLoss, stopModePoint, 8, True ); // 8 big point = $800 Loss
ApplyStop( stopTypeProfit, stopModePoint, 16, True );
PointValue = 100; // big point value
SetPositionSize( 1, spsShares ); // 1 contract per trade
SetBacktestMode( backtestRegularRawMulti  ); // allow multiple positions
SetTradeDelays( 1, 1, 1, 1 );
--Tomasz Janeczko
www.amibroker.com
METASTOCK: PREMIER STOCHASTIC OSCILLATOR
In "Premier Stochastic Oscillator" in this issue, Lee Leibfarth describes the calculation of his new indicator and a system using it. The MetaStock formulas and instructions for adding them to MetaStock follow.
To enter the indicators into MetaStock:
1. In the Tools menu, select Indicator Builder
2. Click New to open the Indicator Editor for a new indicator
3. Type the name of the formula: "Premier Stochastic"
4. Click in the larger window and type in the formula as follows:
x:=Input("stochastic length",2,25,8);
y:=Input("periods",1,100,25);
len:=LastValue(Sqrt(y));
nsto:= 0.1 * (Stoch(x,1)-50);
ssto:=Mov( Mov( nsto, len, E), len, E);
(Exp(ssto)-1)/(Exp(ssto)+1)
5. Click OK to close the Indicator Editor.
    To recreate the premier stochastic system:
1. Select Tools > the Enhanced System Tester
2. Click New
3. Enter the name, "Premier Stochastic Strategy"
4. Select the Buy Order tab and enter the following formula:
x:=8;
y:=25;
len:=LastValue(Sqrt(y));
nsto:= 0.1 * (Stoch(x,1)-50);
ssto:=Mov( Mov( nsto, len, E), len, E);
psto:=(Exp(ssto)-1)/(Exp(ssto)+1);
Cross(.9, psto) OR Cross(.2, psto)
5. Select the Sell Order tab and enter the following formula:
x:=8;
y:=25;
len:=LastValue(Sqrt(y));
nsto:= 0.1 * (Stoch(x,1)-50);
ssto:=Mov( Mov( nsto, len, E), len, E);
psto:=(Exp(ssto)-1)/(Exp(ssto)+1);
Cross(psto,-0.9) OR Cross(psto,-0.2)
6. Select the Sell Short Order tab and enter the following formula:
x:=8;
y:=25;
len:=LastValue(Sqrt(y));
nsto:= 0.1 * (Stoch(x,1)-50);
ssto:=Mov( Mov( nsto, len, E), len, E);
psto:=(Exp(ssto)-1)/(Exp(ssto)+1);
Cross(psto,-0.9) OR Cross(psto,-0.2)
7. Select the Buy To Cover Order tab and enter the following formula:
x:=8;
y:=25;
len:=LastValue(Sqrt(y));
nsto:= 0.1 * (Stoch(x,1)-50);
ssto:=Mov( Mov( nsto, len, E), len, E);
psto:=(Exp(ssto)-1)/(Exp(ssto)+1);
Cross(.9, psto) OR Cross(.2, psto)
8. Click OK to close the system editor.
--William Golson
Equis International
NEUROSHELL TRADER: PREMIER STOCHASTIC OSCILLATOR
The premier stochastic indicator and trading system described in Lee Leibfarth's article in this issue can be easily implemented in NeuroShell Trader by combining a few of NeuroShell Trader's 800+ indicators. See Figure 7.
FIGURE 7: NEUROSHELL TRADER, PREMIER STOCHASTIC INDICATOR. Here is a sample NeuroShell Trader chart showing the premier stochastic on the emini Russell 2000.To recreate the premier stochastic indicator, select "New Indicator ..." from the Insert menu and use the Indicator Wizard to set up the following indicators:
To recreate Leibfarth's trading system based on his premier stochastic indicator, select "New Trading Strategy ..." from the Insert menu and enter the following in the appropriate locations of the Trading Strategy Wizard:SmoothStoch: ExpAvg( ExpAvg (Multiply2( 0.1, Subtract( Stoch%K(High, Low, Close, 8), 50 ) ), 5 ), 5) Premier stochastic oscillator: Divide( Subtract( Exp( SmoothStoch ), 1 ), Add2( Exp( SmoothStoch ), 1 ) )
If you have NeuroShell Trader Professional, you can also choose whether the system parameters should be optimized. After backtesting the trading strategy, use the "Detailed Analysis ..." button to view the backtest and trade-by-trade statistics for the premier stochastic strategy.Long entry when one of the following is true: CrossBelow ( PremierStochastic, 0.9 ) CrossBelow ( PremierStochastic, 0.2 ) Long protective stop: PriceFloor% ( Trading Strategy, 1% ) Long exit: PriceTarget% ( Trading Strategy, 2% ) Short entry when one of the following is true: CrossAbove ( PremierStochastic, -0.9 ) CrossBelow ( PremierStochastic, -0.2 ) Short protective stop: PriceFloor% ( Trading Strategy, 1% ) Short exit: PriceTarget% ( Trading Strategy, 2% )
--Marge Sherald, Ward Systems Group, Inc.
301 662-7950, sales@wardsystems.com
www.neuroshell.com
WORDEN BROTHERS BLOCKS: PREMIER STOCHASTIC OSCILLATOR
Note: To use the indicators and charts in this Traders' Tip, you will need the free Blocks software. Go to www.Blocks.com to download the software and get detailed information on the available datapacks.
The indicator presented by Lee Leibfarth in his article in this issue, "Premier Stochastic Oscillator," is available in the Blocks Trader indicator library. To load the indicator, click the Indicators button, click on the SC Traders' Tips folder, then click on "premier stochastic oscillator" and drag it onto the chart (Figure 8).
FIGURE 8: BLOCKS, PREMIER STOCHASTIC OSCILLATOR. Here is a demonstration of the premier stochastic oscillator (white) with entry thresholds (blue and red).For more information and to view Blocks tutorial videos, go to www.Blocks.com.
-- Patrick Argo and Bruce Loebrich
Worden Brothers, Inc.
STRATASEARCH: PREMIER STOCHASTIC OSCILLATOR
The stochastic oscillator has been around for a long time and is used in many different forms. But this enhanced version, presented by Lee Leibfarth in his article in this issue, "Premier Stochastic Oscillator," with its unique implementation, appears to provide some equally unique benefits. See Figure 9 for an example of the indicator implemented in StrataSearch.
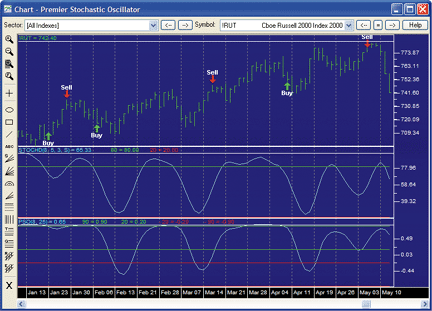
FIGURE 9: STRATASEARCH, PREMIER STOCHASTIC OSCILLATOR. Buy signals are triggered when the PSO drops below 0.90, and sell signals are triggered when the price target is reached, or upon hitting the stop.As a test, we set up the premier stochastic oscillator (PSO) with the same parameters used in the article, namely an eight-day stochastic length, with a 25-day period. We then created variables for the profit target and the stop-loss, with the stop- loss always being 50% of the profit target. Run against four years of the NASDAQ 100 component stocks, there were certainly some results that proved quite promising. However, we then ran the best performer of that group against 250 different sectors. Interestingly, 200 out of the 250 sectors were profitable using the PSO. Thus, the benefits of this indicator appear to carry over to multiple markets.
While the profit target and stop-loss method of exit often created profitable systems, this indicator may prove most helpful when used as a supporting indicator alongside other trading rules. This can be tested quite easily in StrataSearch by configuring the PSO as a supporting trading rule that is always in use, and then running an automated search to test a variety of trading rule combinations.
As with all other Traders' Tips, additional information -- including
plug-ins -- can be found in the Shared Area of the StrataSearch user forum.
This month's plug-in contains a number of prebuilt trading rules that will
allow you to include this indicator in your automated searches. Simply
install the plug-in and let StrataSearch identify the benefits of using
this indicator alongside other trading rules.
//***************************************
// Premier Stochastic Oscillator
//***************************************
StochLength = parameter("StochLength");
Period = parameter("Period");
oSlowK = stochk(StochLength, 3);
Length = if(Period<0, 1, sqrt(Period));
NormStoch = .1 * (oSlowK - 50);
SmoothStoch = mov(mov(NormStoch, Length, e), Length, e);
PSO = (ExpValue(1 * SmoothStoch) - 1) / (ExpValue(1 * SmoothStoch) + 1);
--Pete Rast
Avarin Systems Inc.
www.StrataSearch.com
AIQ: PREMIER STOCHASTIC OSCILLATOR
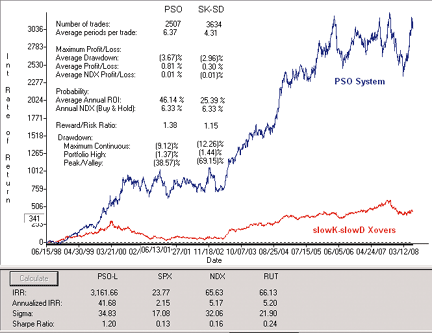
The AIQ code for Lee Leibfarth's article, "Premier Stochastic Oscillator," is shown here. I ran simulations using the Nasdaq 100 list of stocks. To run tests on a portfolio level, I had to add trade selection rules, capitalization rules, and I modified the exits to work with stocks. However, the entry signals are exactly as described by the author in the article. The trades were selected using 30-day AIQ relative strength, taking the top two strongest signals per day, 20% of capital per position, with a maximum of five open positions. Positions were exited on any one of the following conditions: 1) a profit protect exit of 100% protection on profits over 4%, 2) a five-day time exit, 3) a reversing signal, or 4) a 25% disaster stop-loss.
I was curious as to whether the new indicator would outperform a standard smoothed stochastic using the same parameters. I ran comparative tests over the last 10 years using the same list of stocks and the same exit conditions, with the difference being the indicator driving the entries. On the long-only test comparison, shown in Figure 10, the PSO system significantly outperformed the SK-SD system on all the various metrics. However, the short side?only test comparison (not shown) was worse using the PSO. For both systems, shorting the NASDAQ 100 stocks worked only during short bear periods, while both lost horribly during the rest of the 10-year period. Both of the systems need market timing and/or trend filters to make the short side work. A trend filter might reduce the drawdown from the long side as well.
The code can be downloaded from the AIQ website at www.aiqsystems.com and also from www.tradersedge systems.com/traderstips.htm.FIGURE 10: AIQ, PREMIER STOCHASTIC STRATEGY. Here is a comparison of the PSO and SK_SD systems (long only). The PSO significantly outperformed the SK_SD in a portfolio simulation trading the NASDAQ 100 stocks.
--Richard Denning, AIQ Systems
richard.denning@earthlink.net
! PREMIER STOCHASTIC OSCILLATOR (PSO)
! Author: Lee Leibfarth, TASC Aug. 2008
! Coded by: Richard Denning 6/11/08
! CODING ABBREVIATIONS:
H    is [high].
L    is [low].
C    is [close].
! STANDARD STOCHASTIC UNSMOOTHED OSCILLATOR:
lenK is 8.         ! lookback length for oscillator
pctK is 100*((C - lowresult(L,lenK)) / (highresult(H,lenK) - lowresult(L,lenK))).
! SMOOTHED STOCHASTICS:
smoLen is 5.
slowK is expavg(pctK,smoLen).
slowD is expavg(slowK,smoLen).
! PREMIER STOCHASTIC OSCILLATOR INDICATOR:
period is 25.    ! lookback length for double smoothing of pctK
lenS is iff(period < 0,1,sqrt(period)).
! double exponentially smoothed pct K:
normStoch is (pctK - 50) * 0.1.
dblSmoStoch is expavg(expavg(normStoch,lenS),lenS).
PSO is (exp(1 * dblSmoStoch) - 1) / (exp(1 * dblSmoStoch) +1).
PSOx100 is PSO * 100.
! TRADING STRATEGY WITH PSO & SK-SD:
LINE1 is 0.9.
LINE2 is 0.2.
! LONG TRADES:
! PSO SYSTEM:
LE_pso if PSO < LINE1 and valrule(PSO > LINE1,1)
         or PSO < LINE2 and valrule(PSO > LINE2,1).
! SK-SD SYSTEM (for comparison):
LE_sksd if slowK > slowD and valrule(slowK < slowD,1).
! SHORT TRADES:
! PSO SYSTEM:
SE_pso if PSO > -LINE1 and valrule(PSO <  -LINE1,1)
         or PSO >  -LINE2 and valrule(PSO < -LINE2,1).
! SK-SD SYSTEM (for comparison):
SE_sksd if slowK < slowD and valrule(slowK > slowD,1).
TD Ameritrade: PREMIER STOCHASTIC OSCILLATOR
In his article in this issue, Lee Leibfarth discusses a variation of the stochastic oscillator. Here is an interpretation of Leibfarth's premier stochastic oscillator (PSO) using TD Ameritrade's StrategyDesk.
In his article, Leibfarth applies smoothing techniques to a normal stochastic oscillator to reduce the volatility and provide a more even depiction of the changes in the market. To recreate this as a custom chart indicator in StrategyDesk (Figure 11), use the following formula:
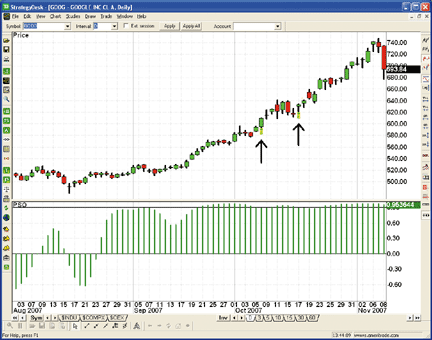
FIGURE 11: TD AMERITRADE, PREMIER STOCHASTIC STRATEGY. The price chart reflects two entry points based on the TD Ameritrade formula (annotated by the arrows). The PSO in the bottom pane falls below 0.90 (the upper black line), which is what triggers the entry signals in this example.
PSO:   (2.71828 ^ (.3333*(.1*Stochastic[StocK,8,3,5,D] - 5)
 + 0.2222*(.1*Stochastic[StocK,8,3,5,D,1] - 5)
 + .1481*(.1*Stochastic[StocK,8,3,5,D,2] - 5)
 + 0.0988*(.1*Stochastic[StocK,8,3,5,D,3] - 5)
 + .0659*(.1*Stochastic[StocK,8,3,5,D,4] - 5)
 + .0439*(.1*Stochastic[StocK,8,3,5,D,5] - 5)
 + .0293*(.1*Stochastic[StocK,8,3,5,D,6] - 5)
 + .0195*(.1*Stochastic[StocK,8,3,5,D,7] - 5)
 + .013*(.1*Stochastic[StocK,8,3,5,D,8] - 5)
 + .0087*(.1*Stochastic[StocK,8,3,5,D,9] - 5)
 + .0058*(.1*Stochastic[StocK,8,3,5,D,10] - 5)
 + .0039*(.1*Stochastic[StocK,8,3,5,D,11] - 5)
 + .0026*(.1*Stochastic[StocK,8,3,5,D,12] - 5)
 + .0017*(.1*Stochastic[StocK,8,3,5,D,13] - 5)
 + .0011*(.1*Stochastic[StocK,8,3,5,D,14] - 5)) - 1)
 / (2.71828 ^ (.3333*(.1*Stochastic[StocK,8,3,5,D] - 5)
 + 0.2222*(.1*Stochastic[StocK,8,3,5,D,1] - 5)
 + .1481*(.1*Stochastic[StocK,8,3,5,D,2] - 5)
 + 0.0988*(.1*Stochastic[StocK,8,3,5,D,3] - 5)
 + .0659*(.1*Stochastic[StocK,8,3,5,D,4] - 5)
 + .0439*(.1*Stochastic[StocK,8,3,5,D,5] - 5)
 + .0293*(.1*Stochastic[StocK,8,3,5,D,6] - 5)
 + .0195*(.1*Stochastic[StocK,8,3,5,D,7] - 5)
 + .013*(.1*Stochastic[StocK,8,3,5,D,8] - 5)
 + .0087*(.1*Stochastic[StocK,8,3,5,D,9] - 5)
 + .0058*(.1*Stochastic[StocK,8,3,5,D,10] - 5)
 + .0039*(.1*Stochastic[StocK,8,3,5,D,11] - 5)
 + .0026*(.1*Stochastic[StocK,8,3,5,D,12] - 5)
 + .0017*(.1*Stochastic[StocK,8,3,5,D,13] - 5)
 + .0011*(.1*Stochastic[StocK,8,3,5,D,14] - 5)) + 1)
The author suggests using downside crossovers of the 0.90 and 0.20
levels as entry points for long trades, and upside crossovers of the -0.90
and -0.20 levels as entry points for short trades. The following entry
formula is an example of the crossover from above 0.90 to below. The crossover
point can be modified simply by changing the values in the formula from
0.90 to 0.20, and so on.
Keep in mind that using this as an upside crossover will not only necessitate
changing the values from positive to negative values, but also changing
the signs in the formula from greater than to less than and from less than
to greater than. This formula can be used for either backtesting or program
trading.
Entry (Buy):  (2.71828 ^ (.3333*(.1*Stochastic[StocK,8,3,5,D] - 5)
               + .2222*(.1*Stochastic[StocK,8,3,5,D,1] - 5)
               + .1481*(.1*Stochastic[StocK,8,3,5,D,2] - 5)
               + .0988*(.1*Stochastic[StocK,8,3,5,D,3] - 5)
               + .0659*(.1*Stochastic[StocK,8,3,5,D,4] - 5)
               + .0439*(.1*Stochastic[StocK,8,3,5,D,5] - 5)
               + .0293*(.1*Stochastic[StocK,8,3,5,D,6] - 5)
               + .0195*(.1*Stochastic[StocK,8,3,5,D,7] - 5)
               + .013*(.1*Stochastic[StocK,8,3,5,D,8] - 5)
               + .0087*(.1*Stochastic[StocK,8,3,5,D,9] - 5)
               + .0058*(.1*Stochastic[StocK,8,3,5,D,10] - 5)
               + .0039*(.1*Stochastic[StocK,8,3,5,D,11] - 5)
               + .0026*(.1*Stochastic[StocK,8,3,5,D,12] - 5)
               + .0017*(.1*Stochastic[StocK,8,3,5,D,13] - 5)
               + .0011*(.1*Stochastic[StocK,8,3,5,D,14] - 5)) - 1)
               /  (2.71828 ^ (.3333*(.1*Stochastic[StocK,8,3,5,D] - 5)
               + .2222*(.1*Stochastic[StocK,8,3,5,D,1] - 5)
               + .1481*(.1*Stochastic[StocK,8,3,5,D,2] - 5)
               + .0988*(.1*Stochastic[StocK,8,3,5,D,3] - 5)
               + .0659*(.1*Stochastic[StocK,8,3,5,D,4] - 5)
               + .0439*(.1*Stochastic[StocK,8,3,5,D,5] - 5)
               + .0293*(.1*Stochastic[StocK,8,3,5,D,6] - 5)
               + .0195*(.1*Stochastic[StocK,8,3,5,D,7] - 5)
               + .013*(.1*Stochastic[StocK,8,3,5,D,8] - 5)
               + .0087*(.1*Stochastic[StocK,8,3,5,D,9] - 5)
               + .0058*(.1*Stochastic[StocK,8,3,5,D,10] - 5)
               + .0039*(.1*Stochastic[StocK,8,3,5,D,11] - 5)
               + .0026*(.1*Stochastic[StocK,8,3,5,D,12] - 5)
               + .0017*(.1*Stochastic[StocK,8,3,5,D,13] - 5)
               + .0011*(.1*Stochastic[StocK,8,3,5,D,14] - 5)) + 1) < .9
               AND
              (2.71828 ^ (.3333*(.1*Stochastic[StocK,8,3,5,D,1] - 5)
               + .2222*(.1*Stochastic[StocK,8,3,5,D,2] - 5)
               + .1481*(.1*Stochastic[StocK,8,3,5,D,3] - 5)
               + .0988*(.1*Stochastic[StocK,8,3,5,D,4] - 5)
               + .0659*(.1*Stochastic[StocK,8,3,5,D,5] - 5)
               + .0439*(.1*Stochastic[StocK,8,3,5,D,6] - 5)
               + .0293*(.1*Stochastic[StocK,8,3,5,D,7] - 5)
               + .0195*(.1*Stochastic[StocK,8,3,5,D,8] - 5)
               + .013*(.1*Stochastic[StocK,8,3,5,D,9] - 5)
               + .0087*(.1*Stochastic[StocK,8,3,5,D,10] - 5)
               + .0058*(.1*Stochastic[StocK,8,3,5,D,11] - 5)
               + .0039*(.1*Stochastic[StocK,8,3,5,D,12] - 5)
               + .0026*(.1*Stochastic[StocK,8,3,5,D,13] - 5)
               + .0017*(.1*Stochastic[StocK,8,3,5,D,14] - 5)
               + .0011*(.1*Stochastic[StocK,8,3,5,D,15] - 5)) - 1)
               /  (2.71828 ^ (.3333*(.1*Stochastic[StocK,8,3,5,D,1] - 5)
               + .2222*(.1*Stochastic[StocK,8,3,5,D,2] - 5)
               + .1481*(.1*Stochastic[StocK,8,3,5,D,3] - 5)
               + .0988*(.1*Stochastic[StocK,8,3,5,D,4] - 5)
               + .0659*(.1*Stochastic[StocK,8,3,5,D,5] - 5)
               + .0439*(.1*Stochastic[StocK,8,3,5,D,6] - 5)
               + .0293*(.1*Stochastic[StocK,8,3,5,D,7] - 5)
               + .0195*(.1*Stochastic[StocK,8,3,5,D,8] - 5)
               + .013*(.1*Stochastic[StocK,8,3,5,D,9] - 5)
               + .0087*(.1*Stochastic[StocK,8,3,5,D,10] - 5)
               + .0058*(.1*Stochastic[StocK,8,3,5,D,11] - 5)
               + .0039*(.1*Stochastic[StocK,8,3,5,D,12] - 5)
               + .0026*(.1*Stochastic[StocK,8,3,5,D,13] - 5)
               + .0017*(.1*Stochastic[StocK,8,3,5,D,14] - 5)
               + .0011*(.1*Stochastic[StocK,8,3,5,D,15] - 5)) + 1) > .9
If you have questions about this formula or functionality, please
call TD Ameritrade's StrategyDesk help line at 800 228-8056, free of charge,
or access the Help Center via the StrategyDesk application. StrategyDesk
is a downloadable application free for all TD Ameritrade clients. Regular
commission rates apply.
TD Ameritrade and StrategyDesk do not endorse or recommend any particular trading strategy.
--Jeff Anderson
TD Ameritrade Holding Corp.
www.tdameritrade.com
CQG: PREMIER STOCHASTIC OSCILLATOR
Here is a CQG custom study definition for Lee Leibfarth's article in this issue, "Premier Stochastic Oscillator."
A CQG component pac is available at the CQG website (https://www.cqg.com/Support/Downloads.aspx) to install this study in CQG. The code is also shown below. A sample chart is shown in Figure 12.
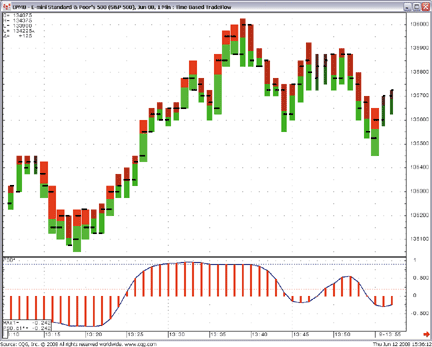
FIGURE 12: CQG, PREMIER STOCHASTIC STRATEGY
S:= (((100*
( Close(@) - MinPrd(@,8)))
/ (MaxPrd(@,8)- MinPrd(@,8)))-50)*.1;
EMAS :=  (MA( MA(S,Exp,5.000),Exp,5.000));
ExpEMAS := Exponential(EMAS );
(ExpEMAS - 1)/(ExpEMAS+1)
--Thom Hartle
www.CQG.com
ASPEN RESEARCH: PREMIER STOCHASTIC OSCILLATOR
Lee Leibfarth's premier stochastic oscillator (PSO) can be easily replicated in Aspen Graphics. We have created supporting formulas to provide a variety of visual alerts to favorable conditions indicated by the premier stochastic oscillator. Also included are formulas for calculating appropriate stop-loss and profit-taking targets.
A sample chart is shown in Figure 13.
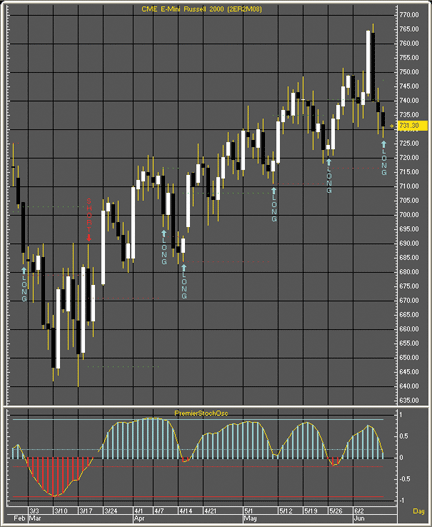
FIGURE 13: ASPEN GRAPHICS, PREMIER STOCHASTIC SYSTEMThe first step in Aspen is to create the root formulas. These formulas will be referenced by all the other formulas. This includes creating the premier stochastic oscillator's normalized fast K line. The formulas "NormStoch" and "PremierStochOsc" produce the oscillator displayed as a histogram.
NormStoch Formula
NormStoch(series, period = 8) = begin
    retval = 0
    kLine = fstoch($1, period)
    retval = 0.1 * (kLine - 50)
    retval
end
PremierStochOsc Formula
PremierStochOsc(series) = begin
    length = 0
    premier = 0
    smoothStoch = 0
    smoothStoch = eavg(eavg(NormStoch($1, 8), 5), 5)
    premier = (exp(1 * smoothStoch) - 1) / (exp(1 * smoothStoch) + 1)
    premier
end
A sample chart of the premier stochastic oscillator color rule is
shown in Figure 14.
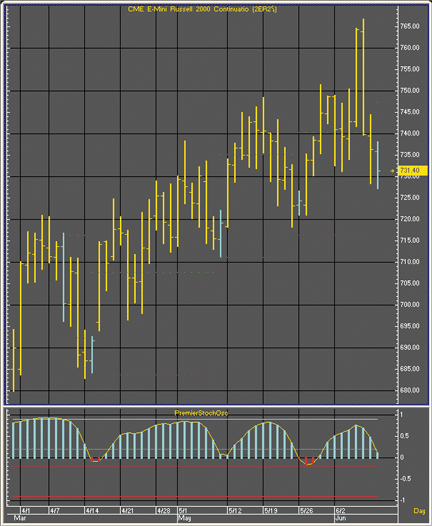
FIGURE 14: ASPEN GRAPHICS, PREMIER STOCHASTIC COLOR RULEThe formula PsoSystem is used to set up various methods for alerting users to favorable conditions. This includes the Aspen color rule and the text-on-chart alerts provided by the formula PsoOverlay. It is also used to calculate the stop-loss and profit target. The red dotted line represents the price at which a stop-loss should be executed. The green dotted line represents the price at which profits could be taken. The result is a complete trading system based on Lee Leibfarth's article.
Note that the current day for these charts indicate a favorable opening
for a long position, and appropriate stop-loss and profit-taking positions
are included in the system.
PsoSystem Formula
PsoSystem(series) = begin
    retval = 0
    premier2 = PremierStochOsc($1)
    premier1 = PremierStochOsc($1)[1]

    if premier2 < 0.90 and premier1 >= 0.90 then retval = 1
    if premier2 < 0.20 and premier1 >= 0.20 then retval = 2
    if premier2 > -0.90 and premier1 <= -0.90 then retval = -1
    if premier2 > -0.20 and premier1 <= -0.20 then retval = -2
    retval
end
PsoOverlay Formula
PsoOverlay(input) = begin
    retval = nonum
    psoVal = PsoSystem($1)

    if psoVal == 1 or psoVal == 2 then retval = 'Long'|clr_cyan|arrow|vertical|ftiny|below
    if psoVal == -1 or psoVal == -2 then retval = 'Short'|clr_red|arrow|vertical|ftiny|above
    retval
end
PsoColor Color Rule
if(PsoSystem($1) == 1, clr_cyan,
 if(PsoSystem($1) == 2, clr_cyan,
 if(PsoSystem($1) == -1, clr_red,
 if(PsoSystem($1) == -2, clr_red, clr_yellow))))
The final set of formulas calculates the stop-loss and profit-taking
points. After the formulas are added to a chart, be sure to modify the
shares, profit, and stop parameters to match your desired position.
SetProfitTarget Formula
SetProfitTarget(input, shares=100,  targetProfit = 1600, Short = 0) = begin
    retval = nonum
    if short == 0 then begin
        retval = ((shares * $1) + targetprofit) / shares
    end
    if(short ==1) then begin
        retval = ((shares * $1) - targetprofit) / shares
    end
    retval
end
SetStopTarget
SetStopTarget(input, shares = 100, stop = 800, short = 1) = begin
    retval = nonum
    if short == 0 then begin
        retval = ((shares * $1.close)- stop) / shares
    end
    if(short ==1) then begin
        retval = ((shares * $1) +stop) / shares
    end
    retval
end
These formulas and a complete page suite are freely available to
Aspen Graphics users at https://www.aspenres.com/forums/viewtopic.php?f=3&t=22.
For a free trial of Aspen Graphics, please contact our sales department
at sales@aspenres.com, 800 359-1121, or visit our website at https://aspenres.com.
--Jeremiah Adams
Aspen Research Group, Ltd.
800 359-1121, support@aspenres.com
https://aspenres.com
NEOTICKER: PREMIER STOCHASTIC OSCILLATOR
In the article "Premier Stochastic Oscillator" in this issue, author Lee Leibfarth presents a new indicator, the premier stochastic oscillator (PSO), and also shows long and short signals based on the Pso.
The premier stochastic oscillator (PSO) can be constructed using NeoTicker's formula language, and signals can be tested using NeoTicker's BacktestEZ indicator.
The PSO (Listing 1) has four parameters, according to the code in the article's sidebar. "Line 1" and "Line 2" are the signal lines' real values. "Stoch Length" is a slow K integer period number, and "Period" is an integer period number for the double-exponential moving average. The resulting indicator will plot Pso values in a new pane in a time chart (Figure 15).
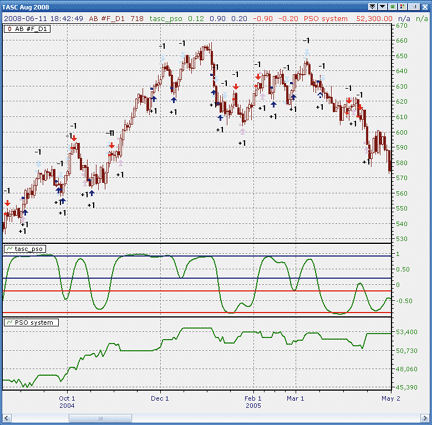
FIGURE 15: NEOTICKER, PREMIER STOCHASTIC OSCILLATORAfter getting the PSO formula indicator to work, use NeoTicker's BacktestEZ to test trading ideas presented in the article. First, add the BacktestEZ indicator to a daily ER2 data series, then, at the long entry and short entry fields, enter the signal formula (Listing 2). These formulas use the built-in indicators "crossaboveconst" and "crossbelowconst" to detect crosses between the PSO and signal values: 0.9, 0.2, -0.9, and -0.2. Next, set dollar amounts for the target and stops in the corresponding parameter fields. After completing the setup, hit "apply" to run this system against ER2 daily data. An equity curve will be plotted.
To see detailed system statistics, right-click on "system indicator" to open the performance viewer (Figure 16).
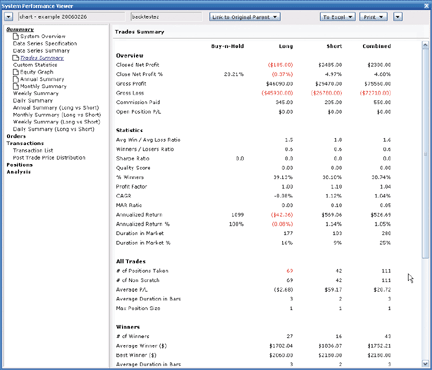
FIGURE 16: NEOTICKER, DETAILED SYSTEM PERFORMANCE STATISTICSA downloadable version of the PSO indicator along with chart groups will be available at the NeoTicker blog site (https://blog.neoticker.com).
LISTING 1
$Line1 := param1;
$Line2 := param2;
$StochLength := param3;
$Period := param4;
$Length := if(param1 < 0, 1, int(sqrt($Period)));
NormStoch := 0.1*(slowk(data1, $StochLength, 3)-50);
$SmoothStoch := qc_xaverage(qc_xaverage(NormStoch,$Length),$Length);
plot1 := (exp($SmoothStoch)-1)/(exp($SmoothStoch)+1);
plot2 := $Line1;
plot3 := $Line2;
plot4 := $Line1*-1;
plot5 := $Line2*-1;
LISTING 2
Long Entry: (xbelowconst(tasc_pso(data1,0.9,0.2,8,25), 0.9)>0) or
            (xbelowconst(tasc_pso(data1,0.9,0.2,8,25), 0.2)>0)
Short Entry: (xaboveconst(tasc_pso(0,data1,0.9,0.2,8,25), -0.9)>0) or
             (xaboveconst(tasc_pso(0,data1,0.9,0.2,8,25), -0.2)>0)
--Kenneth Yuen, TickQuest Inc.
www.tickquest.com
TRADINGSOLUTIONS: PREMIER STOCHASTIC OSCILLATOR
In his article "Premier Stochastic Oscillator" in this issue, Lee Leibfarth
presents a normalized and smoothed version of a short-period stochastic
oscillator. This function is described below and is also available as a
function file that can be downloaded from the TradingSolutions website
(www.tradingsolutions.com) in the Free Systems section. As with many indicators,
these functions could make good inputs to neural network predictions.
Function Name: Premier Stochastic Oscillator
Inputs: Close, High, Low, StochLength, Period
Div (Sub (Exp (EMA (EMA (Mult (0.1, Sub (Stoch (Close, High, Low, StochLength, 1), 50)),
    Sqrt (Period)), Sqrt (Period))), 1), Add (Exp (EMA (EMA (Mult (0.1, Sub (Stoch (Close,
    High, Low, StochLength, 1), 50)), Sqrt (Period)), Sqrt (Period))), 1))
--Gary Geniesse
NeuroDimension, Inc.
800 634-3327, 352 377-5144
www.tradingsolutions.com
INVESTOR/RT: PREMIER STOCHASTIC OSCILLATOR
The premier stochastic oscillator (PSO) presented by Lee Leibfarth in
this article in this issue can be implemented easily in Investor/RT using
a custom indicator with the following syntax:
(SlowD ? 50) / 50
where SlowD is the stochastics slow %D and is set up as seen in
Figure 17, using an eight-period raw %K along with five-period fast %D
and slow %D to apply the double-exponential smoothing effect.
The resulting PSO custom indicator is drawn as both a histogram and two-color line in the lower pane of the chart in Figure 18.FIGURE 17: SLOW D STOCHASTICS INDICATOR SETUP
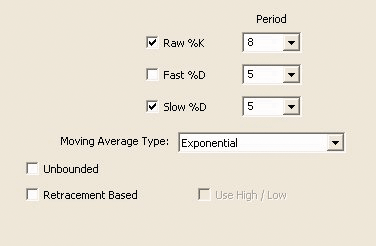
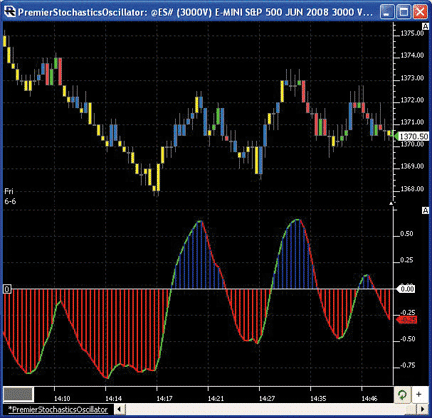
FIGURE 18: INVESTOR/RT, PREMIER STOCHASTIC OSCILLATOR. Here is a 3,000-volume bar chart of the S&P emini futures. The bottom pane displays the PSO indicator.The definition of the chart in Figure 18 may be found and imported from https://www.linnsoft.com/charts along with past Traders' Tip implementations.
A video on creating signal markers and custom indicators in Investor/RT can be found at www.linnsoft.com/videos/.
More information on Investor/RT's implementation of the stochastics indicator can be found at www.linnsoft.com/tour/techind/stoc.htm.
--Chad Payne, Linn Software
info@linnsoft.com, www.linnsoft.com
METATRADER 4: PREMIER STOCHASTIC OSCILLATOR
Here is code for use in MetaTrader 4 based on the article "Premier Stochastic Oscillator" by Lee Leibfarth in this issue.
Readers can visit the MistigriFX.com website user forum at www.mistigri.net/Forum/viewforum.php?f=7
with any questions.
//+--------
+
//|                           TASC082008 - Premier Stochastic EA.mq4 |
//|                                Copyright © 2008, Patrick Nouvion |
//|                                        https://www.mistigrifx.com |
//+--------
+
#property copyright "Copyright © 2008, Patrick Nouvion"
#property link      "https://www.mistigrifx.com"
extern double         Lots = 0.10;
extern    int ProfitTarget = 160;
extern    int     StopLoss =  80;
extern    int  MagicNumber = 6646;
extern    int  StochPeriod = 8;
extern double       Level1 = 0.20;
extern double       Level2 = 0.90;
//+--------
+
//| expert initialization function                                   |
//+--------
+
int init()   { return(0); }
int deinit() { return(0); }
//+--------
+
//| expert start function                                            |
//+--------
+
int start()
{
   string Symbole = Symbol();
   double CurrValue = iCustom( Symbol(), 0, "TASC082008 - Premier Stochastic", StochPeriod, 0, 1 );
   double PrevValue = iCustom( Symbol(), 0, "TASC082008 - Premier Stochastic", StochPeriod, 0, 2 );
   int CountShrtOrders = CountOrders( Symbole, MagicNumber, OP_SELL );
   int CountLongOrders = CountOrders( Symbole, MagicNumber, OP_BUY  );

   //Alert( DoubleToStr( CurrValue, 4 ) + " - " +  DoubleToStr( PrevValue, 4 ) );
   if(
         (( CurrValue >= Level1 && PrevValue < Level1 ) ||
         ( CurrValue >= Level2 && PrevValue < Level2 )) &&  CountShrtOrders == 0
      )
      {
         if( CountLongOrders > 0 ) { CloseOrders( Symbole, MagicNumber, OP_BUY ); }
         EnterShort( Lots, ProfitTarget, StopLoss, MagicNumber );
      }

   if(
         (( CurrValue <= 0-Level1 && PrevValue > 0-Level1 ) ||
         ( CurrValue <= 0-Level2 && PrevValue > 0-Level2 )) && CountLongOrders == 0
      )
      {
         if( CountShrtOrders > 0 ) { CloseOrders( Symbole, MagicNumber, OP_SELL ); }
         EnterLong( Lots, ProfitTarget, StopLoss, MagicNumber );
      }

   return(0);
}
//+--------
+
//+--------
+
//+                               Wait                               +
//+--------
+
void Wait() { while( !IsTradeAllowed() )
{ Sleep(100); } }
//+--------
+
//+--------
+
//| Calculate Profit Target Long                                     |
//+--------
+
double TakeLong(double price,int take)
{
 if(take==0) {  return(0);}
 else        {  return(price+(take*Point));}
}
//+--------
+
//+--------
+
//| Calculate Profit Target Short                                    |
//+--------
+
double TakeShort(double price,int take)
{
 if(take==0) {  return(0);}
 else        {  return(price-(take*Point));}
}
//+--------
+
//+--------
+
//| Calculate Stop Long                                              |
//+--------
+
double StopLong(double price,int stop)
{
 if(stop==0) { return(0); }
 else        { return(price-(stop*Point)); }
}
//+--------
+
//+--------
+
//| Calculate Stop Short                                             |
//+--------
+
double StopShort(double price,int stop)
{
 if(stop==0)   { return(0); }
 else          { return(price+(stop*Point)); }
}
//+--------
+
//+--------
+
//| EnterLong                                                        |
//+--------
+
void EnterLong( double Lots, int ProfitTarget, int StopLoss, int MagicNumber )
{
   int Ticket = 0; bool Done = False;

   while( !Done )
   {
         Wait();
         RefreshRates();
         Ticket = OrderSend( Symbol(), OP_BUY, Lots, Ask, 10.0, StopLong(Bid,StopLoss),
                  TakeLong(Ask, ProfitTarget),0, MagicNumber, 0, CLR_NONE );
         if( Ticket >= 0 ) { Done = true; }
   }
}
//+--------
+
//+--------
+
//| EnterShort                                                        |
//+--------
+
void EnterShort( double Lots, int ProfitTarget, int StopLoss, int MagicNumber )
{
   int Ticket = 0; bool Done = False;
   while( !Done )
   {
         Wait();
         RefreshRates();
         Ticket = OrderSend( Symbol(), OP_SELL, Lots, Bid, 10.0, StopShort(Ask,StopLoss),
                  TakeShort(Bid, ProfitTarget),0, MagicNumber, 0, CLR_NONE );
         if( Ticket >= 0 ) { Done = true; }
   }
}
//+--------
+
//+--------
+
//                             CloseOrders                           |
//+--------
+
void CloseOrders( string Symbole, int MagicNumber, int Type )
{
    for(int i = OrdersTotal()-1; i>=0; i--)
    {
      OrderSelect(i,SELECT_BY_POS,MODE_TRADES);
      if( OrderSymbol() == Symbole )
      {
         if( OrderMagicNumber() == MagicNumber )
         {
            if( OrderType() == Type )
            {
              int result = OrderClose( OrderTicket(), OrderLots(), MarketInfo(OrderSymbol(), MODE_ASK), 10, CLR_NONE );
            }
          }
      }
    }// For
}
//+--------
+
//+--------
+
//                             CountOrders                           |
//+--------
+
int CountOrders(string Symbole, int MagicNumber, int Type )
{
 int count=0;
 for(int i = OrdersTotal()-1; i >=0; i--)
 {
   OrderSelect(i,SELECT_BY_POS,MODE_TRADES);
   if( OrderSymbol() == Symbole )
   {
      if( OrderMagicNumber() == MagicNumber)
      {
         if( OrderType() == Type ) { count++; }
      }
   }
 }
 //----
 return(count);
}
//+--------
+
//+--------
+
//|                              TASC082008 - Premier Stochastic.mq4 |
//|                                Copyright © 2008, Patrick Nouvion |
//|                                        https://www.mistigrifx.com |
//+--------
+
#property copyright "Copyright © 2008, Patrick Nouvion"
#property link      "https://www.mistigrifx.com"
#property indicator_separate_window
#property indicator_buffers 3
#property indicator_color1 Purple
#property indicator_color2 Red
#property indicator_color3 Blue
#property indicator_level1 0.90
#property indicator_level2 0.20
#property indicator_level3 -0.20
#property indicator_level4 -0.90
extern int StochPeriod = 8;
//---- indicator buffers
double     BLUE[];
double      RED[];
double     LINE[];
//+--------
+
//| Custom indicator initialization function                         |
//+--------
+
int init()
{
   //---- drawing settings
   SetIndexStyle(0,DRAW_LINE);
   SetIndexStyle(1,DRAW_HISTOGRAM);
   SetIndexStyle(2,DRAW_HISTOGRAM);

   IndicatorDigits(Digits);
   //---- indicator buffers mapping
   SetIndexBuffer(0,LINE);
   SetIndexBuffer(1,RED);
   SetIndexBuffer(2,BLUE);
   //---- name for DataWindow and indicator subwindow label
   IndicatorShortName("Premier Stochastic");
   SetIndexLabel(0,"Premier Stochastic");
   //---- indicator levels
   SetLevelStyle( DRAW_SECTION, 1, DarkSlateGray );
   //---- initialization done
   return(0);
}
//+--------
+
//| Custom indicator deinitialization function                       |
//+--------
+
int deinit() { return(0); }
//+--------
+
//| Custom indicator iteration function                              |
//+--------
+
int start()
{
   //---- last counted bar will be recounted
   int limit=Bars-6;
   double     Temp[];
   ArrayResize( Temp, limit );
   //----
   for(int i=0; i<limit; i++)
   { Temp[i] = ( iStochastic( Symbol(), 0, StochPeriod, 1, 1, MODE_SMA, PRICE_CLOSE, MODE_MAIN, i ) - 50.0 ) * 0.1; }
   ArraySetAsSeries( Temp, true );
   //--

   for(i=0; i<limit; i++)
   {
      double SMA = iMAOnArray( Temp, 0, 5, 0, MODE_SMA, i);
      LINE[i] =  ( MathExp( SMA ) - 1 ) / ( MathExp( SMA ) + 1 );
      if( LINE[i] >= 0 ) { BLUE[i] = LINE[i]; RED[i] = 0.0;     }
      else               { BLUE[i] = 0.0;     RED[i] = LINE[i]; }
   }
   //----
   return(0);
}
//+--------
+
--Patrick Nouvion
MistigriFX.com, a div. of Mistigri.net
admin@mistigri.net
NINJATRADER: PREMIER STOCHASTIC OSCILLATOR
The premier stochastic oscillator as discussed in "Premier Stochastic Oscillator" by Lee Leibfarth in this issue is available for download at www.ninjatrader.com/SC/August08SC.zip.
Once downloaded, from within the NinjaTrader Control Center window, select the menu File > Utilities > Import NinjaScript and select the downloaded file. This indicator is for NinjaTrader version 6.5 or greater.
You can review the indicator's source code by selecting the menu Tools > Edit NinjaScript > Indicator from within the NinjaTrader Control Center window and selecting PremierStochastic. See Figure 19.
NinjaScript indicators are compiled DLLs that run native, not interpreted, which provides you with the highest performance possible.FIGURE 19: NINJATRADER, PREMIER STOCHASTIC OSCILLATOR. Here is the PSO indicator on a one-minute chart of the S&P emini June contract.
--Raymond Deux, NinjaTrader, LLC
www.ninjatrader.com
MULTICHARTS: PREMIER STOCHASTIC OSCILLATOR
In this month's Traders' Tips, we'll present code to delineate Lee Leibfarth's premier stochastic oscillator (PSO) as well as a strategy based on this code using the strategy rules as defined by Leibfarth in the article.
The indicator code follows:
//Indicator Code
inputs:
    line_first(-.9),
    line_second(-.2),
    stochLen(8),
    Period(25);
variables:
    FastK_(0),
    FastD_(0),
    SlowK_(0),
    SlowD_(0),
    Len(1),
    Norm(0),
    Smooth(0),
    PremierStoch(0);
if Period >= 0 then Len = SquareRoot(Period);
Stochastic(high, low, close, stochLen, 1, 3, 1,fastK_, fastD_, slowK_, slowD_);
Norm = .1*(slowK_-50);
value1 = 2 / ( Len + 1 );
if currentbar = 1 then
    value2 = Norm
else
    value2 = Value2[1] + value1*(Norm - value2[1]);
Smooth = XAverage(value2, Len);
PremierStoch = (expvalue(Smooth) - 1) / (expvalue(Smooth) + 1);
plot1(PremierStoch, "Premier");
plot2(line_first, "First");
plot3(line_second, "Second");
plot4(-line_first, "Third");
plot5(-line_second, "Fourth");
If PremierStoch >= 0 then SetPlotColor(1,Blue)Else SetPlotColor(1,Red);
    The strategy code:
// Premier Stochastic Oscillator Strategy
inputs:
StopLoss(800),
ProfitTarget(1600),
Line1(-.9),
Line2(-.2),
StochLength(8),
Period(25);
variables:
oFastK(0),
oFastD(0),
oSlowK(0),
oSlowD(0),
Length(0),
NormStoch(0),
SmoothStoch(0),
Premier(0);
value1 = Stochastic( h, l, c, StochLength, 1, 3, 1,
oFastK, oFastD, oSlowK, oSlowD);
Length = iff(Period < 0, 1, squareroot(Period));
NormStoch = .1 * (oslowK - 50);
SmoothStoch = xaverage(xaverage(NormStoch,
Length), Length);
Premier = (expValue(1 * SmoothStoch) - 1) /(expValue(1 * SmoothStoch) + 1);
if Premier crosses over Line1 or Premier crosses
over Line2 then sellshort ("S1 Sell") next bar at
market ;
if Premier crosses under Line1 * -1 or Premier
crosses under Line2 * -1 then buy ("L1 Buy") next
bar at market ;
setstopcontract;
setstoploss(StopLoss);
setprofittarget(ProfitTarget);
The resulting oscillator and strategy in MultiCharts is demonstrated
in Figure 20.
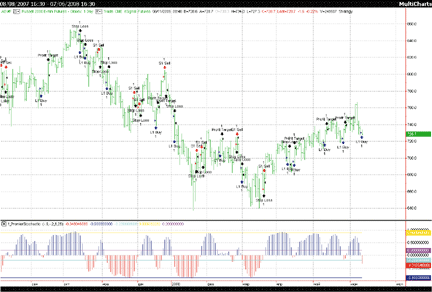
FIGURE 20: MULTICHARTS, PREMIER STOCHASTIC OSCILLATOR AND STRATEGYTo discuss this article and download a complete copy of the formulas, please visit our discussion forum at forum.tssupport.com.
--Stanley Miller
TS SUPPORT, LLC
www.tssupport.com
VT TRADER: PREMIER STOCHASTIC OSCILLATOR
Lee Leibfarth's article in this issue, "Premier Stochastic Oscillator," introduces a new indicator, the premier stochastic oscillator (PSO). The PSO is a modified short-term stochastic oscillator that has been normalized around a centralized zero level.
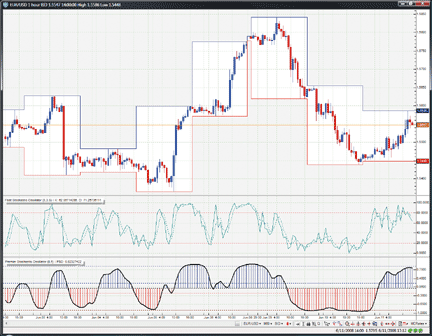
FIGURE 21: VT TRADER, PSO INDICATOR. Here is the PSO indicator attached to EUR/USD 60-minute candle chart.Leibfarth mentions in the article that the PSO's main strength is in identifying countertrend trading setups. Leibfarth also provided some basic entry rules for use with the PSO. Long entries can be taken when the PSO crosses below the 0.90 level or when the PSO crosses below the 0.20 level; short entries can be taken when the PSO crosses above the -0.90 level or when the PSO crosses above the -0.20 level.
We'll be offering the premier stochastic oscillator indicator for download
in our user forums. The VT Trader code and instructions for creating it
are as follows:
1. Navigator Window>Tools>Indicator Builder>[New] button
2. In the Indicator Bookmark, type the following text for each field:
Name: TASC - 08/2008 - Premier Stochastic Oscillator
Short Name: vt_PremierStochOsc
Label Mask: Premier Stochastic Oscillator (%K%,%DSP%) | PSO: %PSO%
Placement: New Frame
Inspect Alias: Premier Stochastic Oscillator
3. In the Input Bookmark, create the following variables:
[New] button... Name: K , Display Name: %K Periods , Type: integer , Default: 8
[New] button... Name: DSP , Display Name: Double Smoothed StK Periods , Type: integer , Default: 5
4. In the Output Bookmark, create the following variables:
[Not shown here]
6. In the Formula Bookmark, copy and paste the following formula:
{Provided By: Visual Trading Systems, LLC & Capital Market Services, LLC (c) Copyright 2008}
{Description: Premier Stochastic Oscillator}
{Notes: T.A.S.C., August 2008 - "Premier Stochastic Oscillator" by Lee Leibfarth}
{vt_PremierStochOsc Version 1.0}
StK:= ((C-LLV(L,K))/(HHV(H,K)-LLV(L,K)))*100;
NormalizedStk:= (StK-50)*0.1;
SmoothedNormalizedStK:= mov(mov(NormalizedStk,DSP,E),DSP,E);
PSO:= (exp(SmoothedNormalizedStK)-1)/(exp(SmoothedNormalizedStK)+1);
PsoUpHistogram:= if(PSO>=0,PSO,null);
PsoDownHistogram:= if(PSO<0,PSO,null);
7. Click the "Save" icon to finish building the premier stochastic oscillator indicator.
To attach the indicator to a chart (Figure 21), click the right mouse button
within the chart window and then select "Add Indicator" -> "TASC - 08/2008
- Premier Stochastic Oscillator" from the indicator list.
To learn more about VT Trader, please visit www.cmsfx.com.
--Chris Skidmore, CMS Forex
(866) 51-CMSFX, trading@cmsfx.com
www.cmsfx.com