Forex Focus
The RSI Miracle
If we had to choose just one indicator to trade the financial markets, it would be J. Welles Wilder’s Rsi. It does everything you expect from an indicator. It’s an overbought/oversold alert system, a convergence/divergence detector, and a momentum indicator, but it can do even more.
The old saying amid radical technicians, that “the price chart has everything you need,” is not just a slogan. The information that we can extract from price vs. time data is amazing and I am not sure what this reflects, human intelligence or the harmony existing in the universe. By reading a price chart we must develop mathematical functions of price. These are tools to help us interpret the raw price data or extract hidden information such as momentum or market pace.
There are different ways to measure momentum, each differing in their definition and calculation. The one that you have learned to interpret and that fills a gap in your market analysis would be the one you pick for your analysis. I have selected the relative strength index (Rsi), which, in addition to identifying overbought/oversold areas, detecting divergences, and identifying momentum, also linearizes a trend.
Price tops or bottoms are not always in a relatively straight trendline. By looking at the Rsi, you’ll see that a perfect trendline often manifests itself. In this article I will present examples using the currency markets.
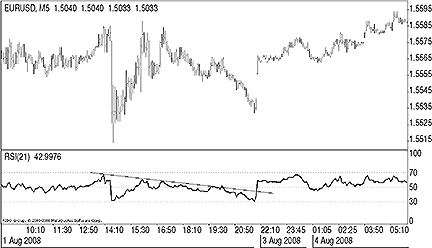
FIGURE 1: THE RSI MIRACLE. Here you see a choppy market in EUR/USD, while in RSI you see a clear behavior.
On the five-minute chart of the Eur/Usd in Figure 1, you can see that although it is a choppy market, the Rsi is not so. It has moved along its clear trendline. Seeing these lines looks like a discovery. This market behavior manifests itself well in Rsi movements.
My next step was to apply this behavior to my trading. So I combined my knowledge of the market using techniques such as Dow theory and Elliott wave counts together with reading market momentum through the Rsi.