TRADERS’ TIPS
April 2009
Here is this month’s selection of Traders’ Tips, contributed by various developers of technical analysis software to help readers more easily implement some of the strategies presented in this and other issues.
Other code appearing in articles in this issue is posted in the Subscriber Area of our website at https://technical.traders.com/sub/sublogin.asp. Login requires your last name and subscription number (from mailing label). Once logged in, scroll down to beneath the “Optimized trading systems” area until you see “Code from articles.” From there, code can be copied and pasted into the appropriate technical analysis program so that no retyping of code is required for subscribers.
You can copy these formulas and programs for easy use in your spreadsheet or analysis software. Simply “select” the desired text by highlighting as you would in any word processing program, then use your standard key command for copy or choose “copy” from the browser menu. The copied text can then be “pasted” into any open spreadsheet or other software by selecting an insertion point and executing a paste command. By toggling back and forth between an application window and the open web page, data can be transferred with ease.
This month’s tips include formulas and programs for:
- TRADESTATION: HIGH RELATIVE STRENGTH MUTUAL FUNDS
- ESIGNAL: HIGH RELATIVE STRENGTH MUTUAL FUNDS
- AMIBROKER: HIGH RELATIVE STRENGTH MUTUAL FUNDS
- AIQ: HIGH RELATIVE STRENGTH MUTUAL FUNDS
- TRADERSSTUDIO: HIGH RELATIVE STRENGTH MUTUAL FUNDS
- TRADE NAVIGATOR: HIGH RELATIVE STRENGTH MUTUAL FUNDS
- STRATASEARCH: HIGH RELATIVE STRENGTH MUTUAL FUNDS
- TRADECISION: HIGH RELATIVE STRENGTH MUTUAL FUNDS
- NEUROSHELL TRADER: HIGH RELATIVE STRENGTH MUTUAL FUNDS
- NINJATRADER: HIGH RELATIVE STRENGTH MUTUAL FUNDS
- TRADING SOLUTIONS: HIGH RELATIVE STRENGTH MUTUAL FUNDS
- VT TRADER: HIGH RELATIVE STRENGTH MUTUAL FUNDS
- TRADE-IDEAS: HIGH RELATIVE STRENGTH MUTUAL FUNDS
- WEALTH-LAB: HIGH RELATIVE STRENGTH MUTUAL FUNDS (Gardner Article Code)
![]() TRADESTATION: HIGH RELATIVE STRENGTH MUTUAL FUNDS
TRADESTATION: HIGH RELATIVE STRENGTH MUTUAL FUNDS
Gerald Gardner’s article in this issue, “Profit With High Relative Strength Mutual Funds,” describes a method for generating entry and exit signals from a second symbol. Each entry signal is based on a combination of the referenced and traded symbol’s volatility and trend.
To download the EasyLanguage code for this study, go to the TradeStation and EasyLanguage Support Forum (https://www.tradestation.com/Discussions/forum.aspx?Forum_ID=213). Search for the file “Gardner RelStr.eld.”
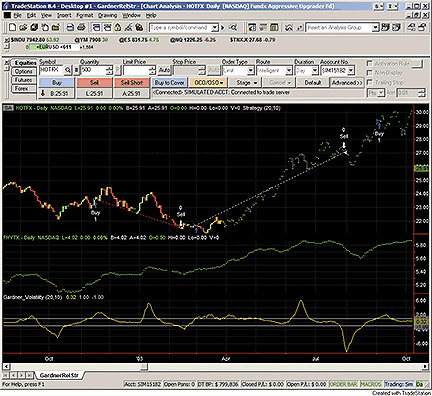
Figure 1: TRADESTATION, ENTRY/EXIT SIGNALS AND GARDNER VOLATILITY CALCULATION. Shown is an example of the “Gardner_RelStr” strategy and “Gardner_Vol” indicator displayed on a dual data chart. Data1 is HOTFX. Data2 is FHYTX. Strategy trades are shown on the HOTFX price series. The Gardner calculation of volatility is shown in the bottom pane.
Strategy:  Gardner_RelStr

Inputs:
	ReferenceAvgLen( 20 ),
	TargetAvgLen( 10 ) ;
variables:
	Reference_SMA( 0, data2 ),
	Reference_Diff( 0, data2 ),
	Reference_Vol( 0, data2 ),
	Target_SMA( 0 ),
	Target_Diff( 0 ),
	Target_Vol( 0 ) ;

Reference_SMA= Average(Close data2, ReferenceAvgLen) data2 ;
Reference_Diff =  close data2 - Reference_SMA ;
Reference_Vol = Reference_Diff/(2 * StandardDev( Reference
_SMA,ReferenceAvgLen,2));

if Reference_Vol > 1 and close > Average( close, TargetAvgLen) then
	buy next bar at market ;

if Reference_Vol < -1 and (close - Average(Close,TargetAvgLen))
	/(2*StdDev( Average(Close, TargetAvgLen),TargetAvgLen)) < 1
then
	sell next bar at market ;

Indicator:  Gardner_Vol

Inputs:
	ReferenceAvgLen( 20 ),
	TargetAvgLen( 10 ) ;
variables:
	Reference_SMA( 0, data2 ),
	Reference_Diff( 0, data2 ),
	Reference_Vol( 0, data2 ) ;

Reference_SMA= Average(Close data2, ReferenceAvgLen) data2 ;
Reference_Diff =  close data2 - Reference_SMA ;
Reference_Vol = Reference_Diff/(2 * StandardDev( Reference
_SMA,ReferenceAvgLen,2));

PLOT1(Reference_Vol,”RefVol”);
Plot2(1);
Plot3(-1);
This article is for informational purposes. No type of trading or investment recommendation, advice, or strategy is being made, given or in any manner provided by TradeStation Securities or its affiliates.
![]() ESIGNAL: HIGH RELATIVE STRENGTH MUTUAL FUNDS
ESIGNAL: HIGH RELATIVE STRENGTH MUTUAL FUNDS
For this month’s Traders’ Tip, we’ve provided the formula, GardnerVolatility.efs, based on the formula code from Gerald Gardner’s article in this issue, “Profit With High Relative Strength Mutual Funds.”
The formula plots the indicators as histograms along with labels to signal the entry and exit of a long position. The formula contains parameters that may be configured through the Edit Studies option to change the colors of the indicators, the thickness, as well as the period lengths. The study is a long-only system that colors the background of the study to indicate a long position is in force. The formula is also compatible for backtesting in the Strategy Analyzer.
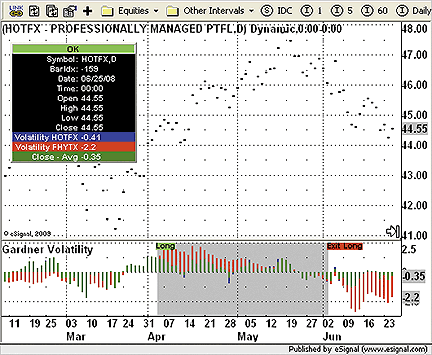
Figure 2: eSIGNAL, GARDNER VOLATILITY INDICATOR. The eSignal formula plots the indicators as histograms and print labels to enter and exit.
To discuss this study or download a complete copy of the formula code, please visit the Efs Library Discussion Board forum under the Forums link at www.esignalcentral.com or visit our Efs KnowledgeBase at www.esignalcentral.com/support/kb/efs/. The eSignal formula scripts (Efs) are also available for copying and pasting from the Stocks & Commodities website at Traders.com.
/*********************************
Provided By:
    eSignal (Copyright c eSignal), a division of Interactive Data Corporation.
    2009. All rights reserved. This sample eSignal Formula Script (EFS) is for
    educational purposes only and may be modified and saved under a new file
    name. eSignal is not responsible for the functionality once modified.
    eSignal reserves the right to modify and overwrite this EFS file with each
    new release.

Description:
    Profit With High Relative Strength Mutual Funds, by Gerald Gardner

Version:            1.0  02/06/2008

Formula Parameters:                Default:
    Volatility HOTFX Color         Blue
    Volatility FHYTX Color         Red
    Volatility HOTFX Color         Green
    Display Cursor Labels          True
    SMA Length For HOTFX           10
    SMA Length For FHYTX           20
    Line Thickness                 2

Notes:
    The related article is copyrighted material. If you are not a subscriber of
    Stocks & Commodities, please visit www.traders.com.

**********************************/

var fpArray = new Array();
var bInit = false;
var bVersion = null;

function preMain() {
    setPriceStudy(false);
    setShowCursorLabel(false);
    setShowTitleParameters( false );
    setStudyTitle(“Gardner Volatility”);
    setCursorLabelName(“Volatility HOTFX”, 0);
    setCursorLabelName(“Volatility FHYTX”, 1);
    setCursorLabelName(“Close - Avg”, 2);
    setCursorLabelName(“Sell”, 3);
    setDefaultBarFgColor(Color.blue, 0);
    setPlotType(PLOTTYPE_HISTOGRAM, 0);
    setDefaultBarThickness(2, 0);
    setDefaultBarFgColor(Color.red, 1);
    setPlotType(PLOTTYPE_HISTOGRAM, 1);
    setDefaultBarThickness(2, 1);
    setDefaultBarFgColor(Color.green, 2);
    setPlotType(PLOTTYPE_HISTOGRAM, 2);
    setDefaultBarThickness(2, 2);
    askForInput();
    var x=0;
    fpArray[x] = new FunctionParameter(“LineColor1”,
    FunctionParameter.COLOR);
    with(fpArray[x++]){
        setName(“Volatility HOTFX Color”);
        setDefault(Color.blue);
    }
    fpArray[x] = new FunctionParameter(“LineColor2”,
    FunctionParameter.COLOR);
    with(fpArray[x++]){
        setName(“Volatility FHYTX Color”);
        setDefault(Color.red);
    }
    fpArray[x] = new FunctionParameter(“LineColor3”,
    FunctionParameter.COLOR);
    with(fpArray[x++]){
        setName(“Volatility HOTFX Color”);
        setDefault(Color.green);
    }
    fpArray[x] = new FunctionParameter(“ViewValue”,
    FunctionParameter.BOOLEAN);
    with(fpArray[x++]){
        setName(“Display Cursor Labels”);
        setDefault(true);
    }
    fpArray[x] = new FunctionParameter(“LengthHOTFX”,
    FunctionParameter.NUMBER);
	with(fpArray[x++]){
        setName(“SMA Length For HOTFX”);
        setLowerLimit(1);
        setDefault(10);
    }
    fpArray[x] = new FunctionParameter(“LengthFHYTX”,
    FunctionParameter.NUMBER);
	with(fpArray[x++]){
        setName(“SMA Length For FHYTX”);
        setLowerLimit(1);
        setDefault(20);
    }
    fpArray[x] = new FunctionParameter(“Thickness”,
    FunctionParameter.NUMBER);
	with(fpArray[x++]){
        setName(“Line Thickness”);
        setLowerLimit(1);
        setDefault(2);
    }
}

var xPrice_FHYTX = null;
var xSMA20_FHYTX = null;
var xStdDev20_FHYTX = null;
var xSMA10_HOTFX = null;
var xStdDev10_HOTFX = null;

function main(LengthHOTFX, LengthFHYTX, LineColor1,
			  LineColor2, LineColor3, Thickness,
              ViewValue) {
var nbdiffbuy = 0;
var ndiffsell = 0;
var nCloseGreaterSMA10 = 0;

    if (bVersion == null) bVersion = verify();
    if (bVersion == false) return;

    if ( bInit == false ) {
        setDefaultBarFgColor(LineColor1, 0);
        setDefaultBarThickness(Thickness, 0);
        setDefaultBarFgColor(LineColor2, 1);
        setDefaultBarThickness(Thickness, 1);
        setDefaultBarFgColor(LineColor3, 2);
        setDefaultBarThickness(Thickness, 2);
        setShowCursorLabel(ViewValue);
        xPrice_FHYTX = close(“FHYTX, D”);
        xSMA20_FHYTX = sma(20, xPrice_FHYTX);
        xStdDev20_FHYTX = efsInternal(“StdDev”, 20,
        xSMA20_FHYTX);
        xSMA10_HOTFX = sma(10);
        xStdDev10_HOTFX = efsInternal(“StdDev”, 10,
        close());
        bInit = true;
    }

    if (xStdDev20_FHYTX.getValue(0) == null || xStdDev10_HOTFX
       .getValue(0) == null) return;

	ndiffbuy = (xPrice_FHYTX.getValue(0) - xSMA20_FHYTX
       .getValue(0)) / (2 * xStdDev20_FHYTX.getValue(0));
    ndiffsell = (close(0) - xSMA10_HOTFX.getValue(0)) /
    (2 * xStdDev10_HOTFX.getValue(0));
    nCloseGreaterSMA10 = close(0) - xSMA10_HOTFX
    .getValue(0);

    if (Strategy.isLong()) {
		if (ndiffbuy < -1 && ndiffsell < -1) {
            Strategy.doSell(“Exit Long”, Strategy.CLOSE,
            Strategy.THISBAR);
            drawTextRelative(-1, 0, “Exit Long”, Color.black,
            Color.red, Text.VCENTER | Text.BOLD |  Text.PRESET,
            null, null, “Txt” + getValue
            (“time”));
		}
    } else {
		if (ndiffbuy > 1) {
			if (nCloseGreaterSMA10 > 0) {
                Strategy.doLong(“Enter Long”, Strategy.MARKET,
                Strategy.NEXTBAR);
                drawTextRelative(-1, 0, “Long”, Color.black, Color.lime,
                Text.VCENTER  | Text.BOLD |  Text.PRESET, null, null, “Txt”
                 + getValue
                (“time”));
            }
        }
    }

    if (Strategy.isLong()) setBarBgColor(Color.lightgrey);

    return new Array(ndiffsell, ndiffbuy, nCloseGreaterSMA10);
}

function StdDev(nLength, xSeries) {
var sum = 0;
var avg = 0;
var res = 0;
    if (xSeries.getValue(0) == null) return;
    for (var barsBack = nLength-1; barsBack >= 0; barsBack--) {
        sum += xSeries.getValue(barsBack*(-1));
    }
    avg = sum / nLength;
    sum = 0;
    for (var barsBack = nLength - 1; barsBack >= 0; barsBack--) {
        sum += (xSeries.getValue(barsBack*(-1))-avg)*(xSeries.getValue(barsBack*
        (-1))-avg);
    }
    res = Math.sqrt(sum / nLength);
    return res;
}

function verify() {
    var b = false;
    if (getBuildNumber() < 779) {
        drawTextAbsolute(5, 35, “This study requires version 8.0 or later.”,
            Color.white, Color.blue, Text.RELATIVETOBOTTOM|Text.RELATIVETOLEFT|
            Text.BOLD|Text.LEFT,
            null, 13, “error”);
        drawTextAbsolute(5, 20, “Click HERE to upgrade.@URL=https://www.esignal.
        com/download/default.asp”,
            Color.white, Color.blue, Text.RELATIVETOBOTTOM|Text.RELATIVETOLEFT|
            Text.BOLD|Text.LEFT,
            null, 13, “upgrade”);
        return b;
    } else {
        b = true;
    }
    return b;
}
![]() AMIBROKER: HIGH RELATIVE STRENGTH MUTUAL FUNDS
AMIBROKER: HIGH RELATIVE STRENGTH MUTUAL FUNDS
In “Profit With High Relative Strength Mutual Funds” in this issue, author Gerald Gardner presents a simple system that uses signals generated from highly correlated funds (Fhytx and Hotfx) to trade Hotfx. Implementing such a system is very easy in AmiBroker. A ready-to-use formula for the article is presented in Listing 1.
To perform a backtest, use the Tools->Backtest menu from the Formula Editor menu. Before testing, you need to switch the current symbol to “Hotfx” and make sure that the “Apply to” setting in the Automatic Analysis window is switched to “Current symbol.”
LISTING 1

sma10_hotfx = MA( Close, 10 );
Vol_hotfx = StDev( sma10_hotfx, 10 );

SetForeign(„FHYTX” );
// at this point Close represents FHYTX close price

sma20_fhytx = MA( Close, 20 );
Vol_fhytx = StDev( sma20_fhytx, 20 );

diffbuy = (Close - sma20_fhytx)/( 2 * Vol_fhytx );
diffsell = (Close - sma20_fhytx)/( 2 * Vol_fhytx );

RestorePriceArrays();
// now we are back to HOTFX

Sell = ( diffsell < -1 ) AND
       ((Close - sma10_hotfx)/( 2 * Vol_hotfx )) < -1;

Buy = ( diffbuy > 1 ) AND ( Close > sma10_hotfx );
![]() AIQ: HIGH RELATIVE STRENGTH MUTUAL FUNDS
AIQ: HIGH RELATIVE STRENGTH MUTUAL FUNDS
The Aiq code is shown here for the unilateral pairs-trading system described in “Profit With High Relative Strength Mutual Funds” by Gerald Gardner in this issue.
In the article, the author uses a pair of mutual funds that are highly correlated and uses the less volatile one (Fhtyx) for the purpose of generating trading signals for the more volatile one (Hotfx). However, I was not convinced by the backtest using this pair, since there are very few trades with long holding periods. To test the idea on stocks, I used the Russell 1000 list of stocks and Aiq’s MatchMaker module, which uses the Spearman statistical technique to correlate stocks on a daily or weekly price-change basis. I ran the entire list of Russell 1000 stocks against itself to find the highly correlated stock pairs. Two that were highly correlated are Chevron (Cvx) and Exxon-Mobile (Xom). A second pair was also tested, Lennar (Len) and Toll Brothers (Tol).
I created symmetrical rules to go short (since this was not provided by the author) and tested these two pairs both long and short on a unilateral basis. I used the pyramiding feature of the Portfolio Manager and entered positions in 25% sized positions, one position per day, four maximum positions for each stock. The pyramiding will enter up to 100% of capital if four signals occur in the same direction before an exit signal is generated. However, if only one entry signal is generated before an exit signal, then only 25% of capital will be traded. This approach helped to reduce the drawdowns somewhat.
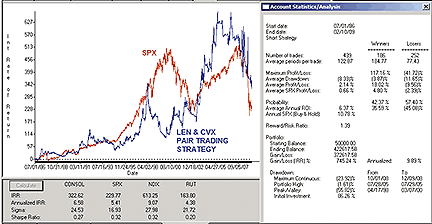
FIGURE 3: AIQ, PAIR TRADING STRATEGY. Shown here is a consolidated equity curve for unilateral pair trading of CVX (against XOM) and LEN (against TOL) as compared to the buy and hold equity curve for the SPX.
The long side of the two pairs made a small return but had rather large drawdowns relative to the return generated. Neither was able to beat the Spx buy-and-hold over the time period tested (7/1/1986 to 2/10/2009). The short side on both pairs lost money over the test period and also had large drawdowns.
I then consolidated all the tests into a single equity curve. The results are displayed in Figure 3. By consolidating, the final result did barely beat the Spx buy-and-hold, but the drawdowns are still rather large relative to the return. I think using a larger number of pairs and changing the exit so that trades are held for a shorter period of time might improve the system and smooth out the equity curve.
The code can be downloaded from the Aiq website at www.aiqsystems.com and also from www.TradersEdgeSystems.com/traderstips.htm.
!! PROFIT WITH HIGH RELATIVE STRENGTH MUTUAL FUNDS
! Author: Gerald Gardner, TASC, April 2009
! Coded by: Richard Denning 2/09/09
! www.TradersEdgeSystems.com

! PARAMETERS:
   smaLen1 is 	10.
   smaLen2 is 	10.

! ABBREVIATIONS:
   C 		is [close].

! VARIABLES FOR MUTUAL FUND TRADING:
   MF1		is TickerUDF(“HOTFX”,C).
   MF2 		is TickerUDF(“FHYTX”,C).
   sma2 	is simpleAvg(MF2,smaLen2).
   sma1 	is  simpleAvg(C,smaLen1).
   closeSMAdiff1 is MF1 - sma1.
   closeSMAdiff2 is MF2 - sma2.
   stdDev1 	is sqrt(variance(closeSMAdiff1,smaLen1)).
   stdDev2 	is sqrt(variance(closeSMAdiff2,smaLen2)).
   vtyMF1 	is closeSMAdiff1 / (2 * StdDev1).
   vtyMF2 	is closeSMAdiff2 / (2 * StdDev2).

! INSURE INDICATORS HAVE ENOUGH DATA:
   HD 		if hasdatafor(max(smaLen1, smaLen2)+5)
		>= max(smaLen1, smaLen2).
! BUY RULE (for HOTFX):
   LE_hotfx	if vtyMF2 > 1 and C > sma1
		and symbol() = “HOTFX”
		and TickerRule(“HOTFX”,HD)
		and TickerRule(“FHYTX”,HD).

! EXIT RULE (for HOTFX):
   LX_hotfx	if vtyMF2 < -1 and vtyMF1 < -1.

! ALTERNATE TEST USING STOCKS:
  ! PAIR1: CVX & XOM, trade CVX as more volatile of pair
  ! PAIR2: LEN & TOL, trade LEN as more volatile of pair
   STK3		is TickerUDF(“CVX”,C).
   STK4		is TickerUDF(“XOM”,C).
   STK5		is TickerUDF(“LEN”,C).
   STK6		is TickerUDF(“TOL”,C).
   sma3 	is simpleAvg(STK3,smaLen1).
   sma4		is simpleAvg(STK4,smaLen2).
   sma5 	is simpleAvg(STK5,smaLen1).
   sma6		is simpleAvg(STK6,smaLen2).
   closeSMAdiff3 is STK3 - sma3.
   closeSMAdiff4 is STK4 - sma4.
   closeSMAdiff5 is STK5 - sma5.
   closeSMAdiff6 is STK6 - sma6.
   stdDev3 	is sqrt(variance(closeSMAdiff3,smaLen1)).
   stdDev4 	is sqrt(variance(closeSMAdiff4,smaLen2)).
   stdDev5 	is sqrt(variance(closeSMAdiff5,smaLen1)).
   stdDev6 	is sqrt(variance(closeSMAdiff6,smaLen2)).
   vtySTK3	is closeSMAdiff3 / (2 * StdDev3).
   vtySTK4	is closeSMAdiff4 / (2 * StdDev4).
   vtySTK5	is closeSMAdiff5 / (2 * StdDev5).
   vtySTK6	is closeSMAdiff6 / (2 * StdDev6).

! BUY RULE (for CVX):
   LE_cvx 		if vtySTK4 > 1 and STK3 > sma3
		and symbol() = “CVX”
		and TickerRule(“CVX”,HD)
		and TickerRule(“XOM”,HD).

! BUY RULE (for LEN):
  LE_len 		if vtySTK6 > 1 and STK5 > sma5
		and symbol() = “LEN”
		and TickerRule(“LEN”,HD)
  		and TickerRule(“TOL”,HD).

! EXIT LONG RULE (for CVX):
   LX_cvx 	if vtySTK4 < -1 and vtySTK3 < -1.

! EXIT LONG RULE (for LEN):
   LX_len 	if vtySTK6 < -1 and vtySTK5 < -1.

! SELL SHORT RULE (for CVX):
  SE_cvx		if vtySTK4 < -1 and STK3 < sma3
		and symbol() = “CVX”
		and TickerRule(“CVX”,HD)
		and TickerRule(“XOM”,HD).

! SELL SHORT RULE (for LEN):
   SE_len	if vtySTK6 < -1 and STK5 < sma5
		and symbol() = “LEN”
		and TickerRule(“LEN”,HD)
		and TickerRule(“TOL”,HD).

! EXIT SHORT RULE (for CVX):
   SX_cvx 	if vtySTK4 > 1 and vtySTK3 > 1.

! EXIT SHORT RULE (for LEN):
   SX_len 	if vtySTK6 > 1 and vtySTK5 > 1.
![]() TRADERSSTUDIO: HIGH RELATIVE STRENGTH MUTUAL FUNDS
TRADERSSTUDIO: HIGH RELATIVE STRENGTH MUTUAL FUNDS
The TradersStudio code for the unilateral pairs-trading system described in the article, “Profit With High Relative Strength Mutual Funds,” by Gerald Gardner in this issue is shown here.
In the article, the author uses a pair of mutual funds that are highly correlated and uses the less volatile one (Fhtyx) for the purpose of generating trading signals for the more volatile one (Hotfx).
I wanted to test the concept of unilateral pairs trading, where a volatile futures contract is paired with an index of its related sector. I also wanted to have a trading system that would trade both long and short. I added the reverse logic to create the short sale entry rule and the related short exit rule.
Pinnacle Data provides cash indexes for some of the futures sectors. The Euro (FN) contract is one of the more volatile of the currency sector futures contracts, which I paired with the Crb currency index. In addition, I paired heating oil (HO) with the Crb energy index; the US Treasury bond with the S&P 500; pork bellies (PB) with the Crb meats index; soybeans (S) with the Crb grains index; the emini Russell 2000 (ER) with the S&P 500; and gold (ZG) with the Crb metals index. The two moving average lengths were quickly optimized to see what parameter sets might work. I did not optimize the number of standard deviations that are used to determine entries and exits but stayed with the author’s value of 2.
Only the pair composed of gold with the Crb metals index showed almost all parameter sets to be losers. After eliminating gold from the portfolio of pairs, I ran a percent margin trade plan on the rest. (The code for the percent margin trade plan is included with the TradersStudio program and is not shown here.) The results of the test using 25% of available margin on each trade gave the results shown in Figure 4.
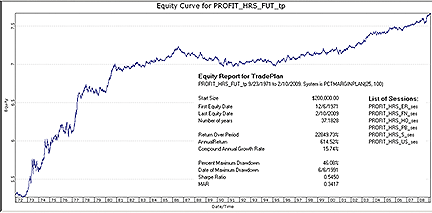
FIGURE 4: TRADERSSTUDIO, unilateral pairs-trading system. Shown here are the log equity curve and related key metrics for the paired portfolio of six futures using Pinnacle Data for the futures (FN, HO, US, PB, S, ER) and the paired cash indexes for the period 9/23/1971 to 2/10/2009.
The test was run from 9/23/1971 to 2/10/2009 on the six market pairs resulting in 1,121 trades, a compounded annual return of 15.74% with a maximum drawdown of 46.08%.
Although the tests show that the idea behind the system has merit as applied to futures, I would not trade this system without making more adjustments to try to reduce the drawdowns.
The code can be downloaded from the TradersStudio website at www.TradersStudio.com ->Traders Resources->FreeCode and also from www.TradersEdgeSystems.com/traderstips.htm.
‘PROFIT WITH HIGH RELATIVE STRENGTH MUTUAL FUNDS
‘Author: Gerald Gardner, TASC, April 2009
‘Coded by: Richard Denning 2/04/09
‘www.TradersEdgeSystems.com

Sub Profit_HRS_MF(smaLen1, smaLen2, LongShort)
Dim sma1 As BarArray
Dim sma2 As BarArray
Dim closeSMAdiff1 As BarArray
Dim closeSMAdiff2 As BarArray
Dim Data2 As BarArray
Dim vtyData1 As BarArray
Dim vtyData2 As BarArray
sma1 = Average(C,smaLen1)
Data2 = C Of independent1
sma2 = Average(Data2,smaLen2)
closeSMAdiff1 = C - sma1
closeSMAdiff2 = Data2 - sma2
If StdDev(sma1,smaLen1) > 0 Then vtyData1 = closeSMAdiff1 /
(2 * StdDev(sma1,smaLen1))
If StdDev(sma2,smaLen2) > 0 Then vtyData2 = closeSMAdiff2 /
(2 * StdDev(sma2,smaLen2))

If LongShort = 1 Or LongShort = 3 Then
    If vtyData2 > 1 And C > sma1 Then Buy(“LE”,1,0,Market,Day)
    If vtyData2 < -1 And vtyData1 < -1 Then ExitLong(“LX”,””,1,
    0,Market,Day)
End If
If LongShort = 2 Or LongShort = 3 Then
    If vtyData2 < -1 And C < sma1 Then Sell(“SE”,1,0,Market,Day)
    If vtyData2 > 1 And vtyData1 > 1 Then ExitShort(“SX”,””,1,0,
    Market,Day)
End If
End Sub
![]() TRADE NAVIGATOR: HIGH RELATIVE STRENGTH MUTUAL FUNDS
TRADE NAVIGATOR: HIGH RELATIVE STRENGTH MUTUAL FUNDS
While mutual funds are not currently available through Trade Navigator, Genesis Financial Technologies will be offering mutual fund data for Trade Navigator starting in the second quarter of 2009.
Here, we will show you how to recreate the strategy described in the article “Profit With High Relative Strength Mutual Funds” by Gerald Gardner using Nyfe Crb index and the Dow Jones Industrial Average. The strategy for this article is easy to set up and test in Trade Navigator:
- Go to the Strategies tab in the Trader’s Toolbox.
- Click on the New button. Click the New Rule button.
- To create the long entry rule, type the following code:
IF (MovingAvg (Close Of “$djia” , 20) - Close Of “$djia”) / (MovingStdDev
(Close Of “$djia” , 20) * 2) > 1 And Close > MovingAvg (Close , 10)
- Set the Action to “Long entry (buy)” and the Order Type to “market.”
- Click on the Save button. Type a name for the rule and then click the OK button. Repeat these steps for the long exit rule using the following code:
IF (MovingAvg (Close Of “$djia” , 20) - Close Of “$djia”) / (MovingStdDev
(Close Of “$djia” , 20) * 2) < -1 And (MovingAvg (Close , 20) - Close) /
(MovingStdDev (Close , 10) * 2) < -1
- Set the Action to “Long exit (sell)” and the Order Type to “market.”
- Be sure to set the commission/slippage fees options on the Settings tab on the Strategy screen.
- Save the strategy by clicking the Save button, typing a name for the strategy and then clicking the OK button.
You can test your new strategy by clicking the Run button to see a report or you can apply the strategy to a chart for a visual representation of where the strategy would place trades over the history of the chart.
We are providing the strategy discussed here as a special downloadable file for Trade Navigator. Simply click on the blue phone icon in Trade Navigator, select Download Special File, type “SC0409,” and click on the Start button.
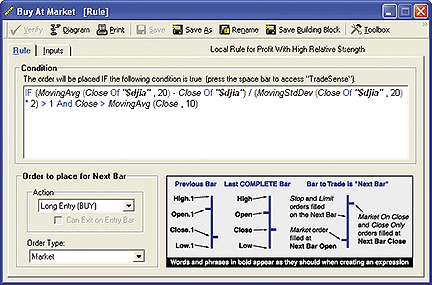
FIGURE 5: Trade Navigator, CONDITION SETUP. Here is how to set up the entry rule in Trade Navigator.
![]() STRATASEARCH: HIGH RELATIVE STRENGTH MUTUAL FUNDS
STRATASEARCH: HIGH RELATIVE STRENGTH MUTUAL FUNDS
The idea of using correlated symbols as leading indicators, as presented by Gerald Gardner in “Profit With High Relative Strength Mutual Funds,” is a good one. It isn’t uncommon for relationships to exist where one symbol consistently precedes the movement of another symbol by several days, and taking advantage of such scenarios can definitely increase a trader’s profits.
Using the author’s description and sample code, we weren’t able to precisely duplicate his trades. Nevertheless, the trades generated by the system were indeed promising and clearly benefited from the alternate symbol evaluation. Mutual funds often charge penalties for active trading, and this system had more than one short-term trade that could have incurred a penalty, so traders should be aware of such limitations before trading such a system.
Taking the author’s theory one step further, we created a trading rule where a correlation is tested against a user-defined index. If there is a high correlation, the symbol is available for trading. StrataSearch users can then include this trading rule in an automated search for trading systems, using the trading rule alongside a large number of additional indicators, and trading against a large pool of stocks and mutual funds at one time.
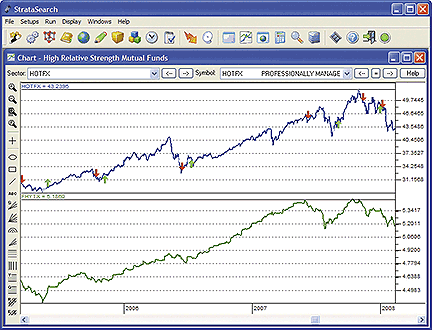
FIGURE 6: STRATASEARCH, High Relative Strength Mutual Funds. The two mutual funds are highly correlated, but FHYTX (bottom panel) often creates a helpful leading indicator when buying HOTFX (top panel).
As with all other Traders’ Tips, additional information, including plug-ins, can be found in the Shared Area of the StrataSearch user forum.
//***************************************************************************
// High Relative Strength Mutual Funds
//***************************************************************************
Entry String:
(symbol(FHYTX, close) - symbol(FHYTX, mov(close, 20, S))) /
(2 * sdev(symbol(FHYTX, mov(close, 20, S)), 20)) > 1 and
close > mov(close, 10, s)

Exit String:
(symbol(FHYTX, close) - symbol(FHYTX, mov(close, 20, S))) /
(2 * sdev(symbol(FHYTX, mov(close, 20, S)), 20)) < -1 and
(close - mov(close, 10, S)) /
(2 * sdev(mov(close, 10, S), 10)) < -1
![]() TRADECISION: HIGH RELATIVE STRENGTH MUTUAL FUNDS
TRADECISION: HIGH RELATIVE STRENGTH MUTUAL FUNDS
The article by Gerald Gardner in this issue, “Profit With High Relative Strength Mutual Funds,” demonstrates how a timing method applied to correlated mutual funds can maximize profit and reduce drawdown.
Using the Strategy Builder in Tradecision, you can set up a strategy for Gardner’s method. Here is the Tradecision code for the strategy:
Entry Long:
var
  sma_hotfx:=0;
  sma_fhytx:=0;
  vol_fhytx:=0;
  diffbuy:=0;
  ext_fhytx:=0;
end_var

if HISTORYSIZE > 30 then begin
sma_hotfx := SMA(C,10);
sma_fhytx := SMA(External(“close”,”FHYTX”),20);
vol_fhytx:= StdDev(sma_fhytx,20);

if (not IsInPosition()) then begin
ext_fhytx := External(“close”,”FHYTX”);
diffbuy:=(ext_fhytx - sma_fhytx)/(2*vol_fhytx);

if (diffbuy > 1) then begin
if (C > sma_hotfx) then return true;
end;
end;
end;
return false;

Exit Long:

var
  sma_hotfx:=0;
  sma_fhytx:=0;
  vol_hotfx:=0;
  vol_fhytx:=0;
  diffsell:=0;
  c_fhytx:=0;
end_var

if HISTORYSIZE > 30 then begin
sma_hotfx := SMA(C,10 );
sma_fhytx := SMA(External(“close”,”FHYTX”),20 );
vol_hotfx:= StdDev(sma_hotfx,10);
vol_fhytx:= StdDev(sma_fhytx,20);

if (IsInPosition) then begin
c_fhytx := External(“close”,”FHYTX”);
diffsell:=(c_fhytx - sma_fhytx)/(2*vol_fhytx);
if (diffsell < -1) then begin
if (vol_hotfx = 0) then diffsell := C - sma_hotfx;

else diffsell := C - sma_hotfx/(2*vol_hotfx);
if (diffsell < -1) then return true;
end;
end;
end;
return false;
Once the strategy has been applied to the chart (Figure 7), you can view and analyze the Strategy Performance Report (Figure 8) and the Trade Reports.
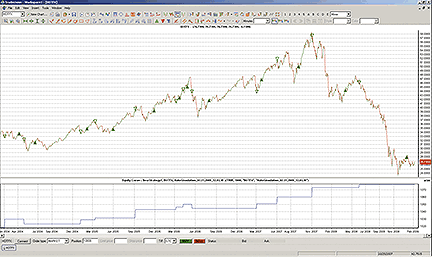
FIGURE 7: TRADECISION, APPLYING A STRATEGY. Here is a HOTFX chart with an equity curve and strategy applied.
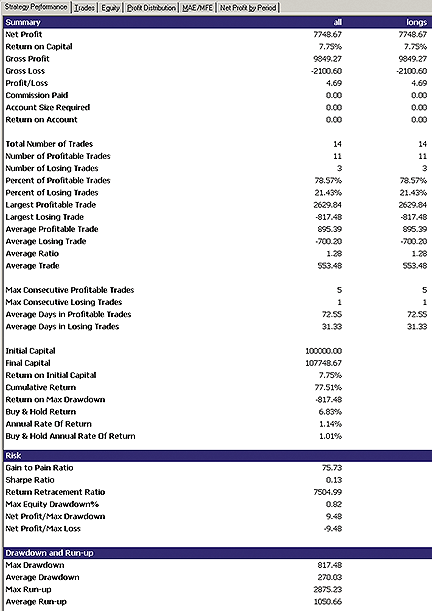
FIGURE 8: TRADECISION, PERFORMANCE REPORT. The return on capital is 7.75%, the percent of profitable trades is 78.57%, and the percent of losing trades is 21.43%.
To import the strategy into Tradecision, visit the area “Traders’ Tips from Tasc Magazine“ at www.tradecision.com/support/tasc_tips/tasc_traders_tips.htm or copy the code from above.
![]() NEUROSHELL TRADER: HIGH RELATIVE STRENGTH MUTUAL FUNDS
NEUROSHELL TRADER: HIGH RELATIVE STRENGTH MUTUAL FUNDS
The system presented in this issue by Gerald Gardner in his article “Profit With High Relative Strength Mutual Funds” can be implemented in NeuroShell Trader by combining a few of NeuroShell Trader’s 800+ indicators and NeuroShell Trader’s trading strategy wizard.
To allow analysis with two different datastreams, simply create a Hotfx chart and then add the Fhytx data to the chart by selecting “Other Instrument Data…” from the Insert menu. To recreate the system, select “New Trading Strategy…” from the Insert menu and enter the following code in the appropriate locations of the Trading Strategy Wizard:
Buy long when all of the following conditions are true:

  A>B(StndNormZScore(FHYTX Close,20),1)
  A>B(Close,Avg(Close,10))

Sell long when all of the following conditions are true:

  A<B(StndNormZScore(FHYTX Close,20),-1)
  A<B(StndNormZScore(Close,10),-1)
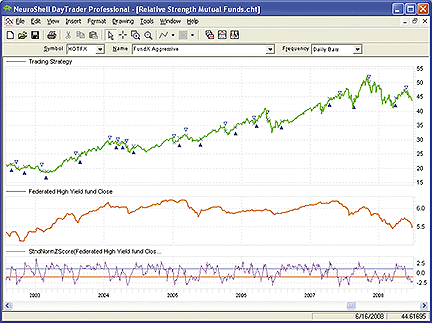
FIGURE 9: NEUROSHELL TRADER, HIGH RELATIVE STRENGTH TRADING SYSTEM. Here is Gerald Gardner’s high relative strength trading system demonstrated in NeuroShell Trader.
If you have NeuroShell Trader Professional, you can also choose whether the system parameters should be optimized. After backtesting the trading strategy, use the “Detailed Analysis…” button to view the backtest and trade-by-trade statistics for the strategy.
![]() NINJATRADER: HIGH RELATIVE STRENGTH MUTUAL FUNDS
NINJATRADER: HIGH RELATIVE STRENGTH MUTUAL FUNDS
We have implemented the system discussed by Gerald Gardner in his article “Profit With High Relative Strength Mutual Funds” as a sample strategy available for download at www.ninjatrader.com/SC/April2009SC.zip.
Once it has been downloaded, from within the NinjaTrader Control Center window, select the menu File > Utilities > Import NinjaScript and select the file. This strategy is for NinjaTrader version 6.5 or greater.
You can review the strategy’s source code by selecting the menu Tools > Edit NinjaScript > Strategy from within the NinjaTrader Control Center window and selecting “April2009SC.”
NinjaScript strategies are compiled Dlls that run native, not interpreted, which provides you with the highest performance possible.
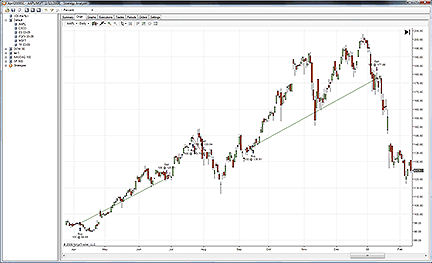
FIGURE 10: NINJATRADER, STRATEGY ANALYZER. This screenshot shows the high relative strength strategy backtested in the NinjaTrader Strategy Analyzer.
![]() TRADINGSOLUTIONS: HIGH RELATIVE STRENGTH MUTUAL FUNDS
TRADINGSOLUTIONS: HIGH RELATIVE STRENGTH MUTUAL FUNDS
In the article “Profit With High Relative Strength Mutual Funds” in this issue, author Gerald Gardner presents a trading system based on the crossing points of two data series. This entry/exit system as implemented in TradingSolutions is described here and is also available as a function file that can be downloaded from the TradingSolutions website (www.tradingsolutions.com) in the “Free Systems” section.
When applying this system, simply specify the value of the BondClose input as being the close of the Fhytx data.
System Name: Relative Strength Fund System
Inputs: Close, BondClose
Enter Long (when all true):
1. GT ( Div ( Sub ( BondClose, MA ( BondClose , 20 )) , Mult ( 2 , StDev ( MA
   ( BondClose , 20 ) , 20 ))), 1 )
2. GT ( Close, MA ( Close, 10 ))

Exit Long (when all true):
1. LT ( Div ( Sub ( BondClose, MA ( BondClose , 20 )) , Mult ( 2 , StDev ( MA
   ( BondClose , 20 ) , 20 ))), -1 )
2. LT ( Div ( Sub ( Close, MA ( Close, 10 )) , Mult (2 , StDev ( MA ( Close,
   10 ), 10))), -1)
![]() VT TRADER: HIGH RELATIVE STRENGTH MUTUAL FUNDS
VT TRADER: HIGH RELATIVE STRENGTH MUTUAL FUNDS
Our Traders’ Tip submission is inspired by Gerald Gardner’s article in this issue, “Profit With High Relative Strength Mutual Funds.“ We’ll be offering Gardner’s method of calculating volatility as an indicator for download in our online forums. The VT Trader code and instructions for recreating the indicator are as follows:
Gardner’s volatility
- Navigator Window>Tools>Indicator Builder>[New] button
- In the Indicator Bookmark, type the following text for each field:
Name: TASC TASC - 04/2009 - Gardner’s Volatility
Short Name: vt_tascGardnerVol
Label Mask: TASC - 04/2009 - Gardner’s Volatility
(%price% | %maprice%,%maperiods%,%matype% | %stdevperiods%,%d%)
Placement: New Frame
Inspect Alias: Gardner’s Volatility
- In the Input Bookmark, create the following variables:
[New] button... Name: price , Display Name: Price , Type: price ,
Default: close
[New] button... Name: maprice , Display Name: MA Price , Type: price ,
Default: close
[New] button... Name: maperiods , Display Name: MA Periods ,
Type: integer , Default: 20
[New] button... Name: matype , Display Name: MA Type , Type: MA Type ,
Default: simple
[New] button... Name: stdevperiods , Display Name: Standard Deviations
Periods , Type: integer , Default: 20
[New] button... Name: d , Display Name: Standard Deviations ,
Type: float , Default: 2.0
- In the Output Bookmark, create the following variables:
[New] button...
Var Name: Gardners_Volatility
Name: (Volatility)
Line Color: blue
Line Width: slightly thicker
Line Type: solid
- In the Horizontal Line Bookmark, create the following variables:
[New] button...
Value: +0.0000
Color: black
Width: thin
Type: dashed

[New] button...
Value: +1.0000
Color: red
Width: thin
Type: dashed

[New] button...
Value: -1.0000
Color: red
Width: thin
Type: dashed
- In the Formula Bookmark, copy and paste the following formula:
{Provided By: Capital Market Services, LLC & Visual Trading Systems, LLC} {Copyright: 2009} {Description: TASC, April 2009 - “Profit With High Relative Strength Mutual Funds” by Gerald Gardner} {File: vt_tascGardnerVol.vtsrc - Version 1.0} Data_MA:= mov(maprice,maperiods,matype); Data_StDev:= stdev(Data_MA,stdevperiods); Gardners_Volatility:= (price-Data_MA)/(d*Data_StDev); - Click the “Save” icon to finish building Gardner’s volatility indicator.
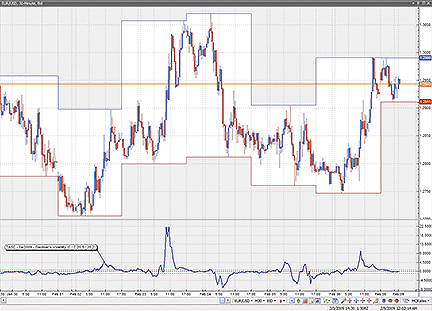
FIGURE 11: VT TRADER, GARDNER’S VOLATILITY. Here is an example of Gardner’s volatility indicator attached to a EUR/USD 30-minute candle chart.
To attach the indicator to a chart (Figure 11), click the right mouse button within the chart window and then select “Add Indicator” -> “TASC - 04/2009 - Gardner’s Volatility” from the indicator list.
To learn more about VT Trader, visit www.cmsfx.com.
![]() TRADE-IDEAS: HIGH RELATIVE STRENGTH MUTUAL FUNDS
TRADE-IDEAS: HIGH RELATIVE STRENGTH MUTUAL FUNDS
“Your emotions are often a reverse indicator of what you ought to be doing.” —John F. Hindelong
For this month’s Traders’ Tip, we offer a stock trading strategy based, in part, on the ideas proffered by Gerald Gardner in his article in this issue, “Profit With High Relative Strength Mutual Funds.” Specifically, we suggest two strategies based on the tendencies of the current market:
- Look just beyond the short term when using relative strength (that is, holding opportunities for at least a day)
- Fade those stocks that display strong relative strength (and in the current market, the odds tell us it may pay to do so).
The first 15 minutes of trading can tell you a lot about the rest of the day. When finding stocks with a very high 15-minute relative strength index reading of 80 or higher, one would assume that strength suggests the uptrend will continue. Not so, says the OddsMaker, which is Trade-Ideas’s “event-based” backtesting system. You can use relative strength in stocks to profit; just fade the trade. Hold the short position for one day. (You can see the results we generated in Figure 13.)
This strategy is based on the Trade-Ideas inventory of alerts and filters found in our flagship product, Trade-Ideas Pro. The trading rules are modeled and backtested in its add-on tool, The OddsMaker.
Here is the strategy to profit from high relative strength in stocks. First, let’s define terms. Following is the Trade-Ideas online help explanation of the relative strength filter: “This filter refers to Wilder’s relative strength index (Rsi), using the standard value of 14 periods.” The server recomputes this value every 15 minutes, at the same time as new bars or candlesticks would appear on a 15-minute stock chart.
This filter does not use pre- or post-market data. This filter is only available for stocks with sufficient history; if a stock did not trade at least once every 15 minutes for the last 14 periods, the server will not report an Rsi for that stock.
We look at all the US exchanges for stocks with a price range from $35–65 exhibiting a minimum 15-minute Rsi value of 80. The “heartbeat” alert in Trade-Ideas simply lists all the stocks that pass this short list of filters. That’s it.
How do we trade this pattern? A successful trade in this strategy means we sell short all the opportunities that appear. We also do not use a stop-loss for this system. (If that means is a higher risk tolerance setting than you desire, try experimenting with the backtesting results by placing various stop-loss values and see why we chose not to use one.) We enter anytime during the market session at the time of the signal and hold the trade until the open the next day. The results speak for themselves for the three weeks ended 2/9/2009: a 68% success rate, where average winners are almost 50% larger than average losers.
Provided by:
Trade Ideas (copyright © Trade Ideas LLC 2009). All rights reserved. For
educational purposes only. Remember these are sketches meant to give an
idea how to model a trading plan. Trade-Ideas.com and all individuals
affiliated with this site assume no responsibilities for trading and
investment results.

Description: “Profit From High Relative Strength Stocks”

Input this string directly into Trade-Ideas Pro using the
“Collaborate” feature (right-click in any strategy window):

https://www.trade-ideas.com/View.php?O=8000000000000
000000000000_19_0&amMaxPrice=65&MinPrice=35
&MinRSI15=80&WN=Profit+From+High+Relative+
Strength+Stocks
This strategy also appears on the Trade-Ideas blog at https://marketmovers.blogspot.com/. One alert and three filters are used with the following specific settings:
• Heartbeat Alert; no additional setting
• Min Price Filter = 35 ($)
• Max Price Filter = 65 ($)
• Min 15-Minute Relative Strength Indicator Filter = 80
The definitions of these indicators appear here: https://www.trade-ideas.com/Help.html.
That’s the strategy, but what about the trading rules? How should the opportunities the strategy finds be traded? Here is what The OddsMaker tested for the three weeks ended 2/9/2009 given the following trade rules:
- On each alert, sell short the symbol (price moves down to be a successful trade)
- Schedule an exit for the stocks at the open after one day
- Start trading from the open and stop at market close.
The OddsMaker summary provides the evidence for how well this strategy and our trading rules did. The settings are shown in Figure 12.
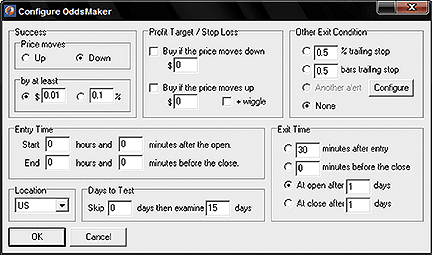
FIGURE 12: TRADE-IDEAS, SETTINGS. Shown here are the settings used for the high relative strength strategy.
Sample results (last backtested for the three-week period ended 2/9/2009) are shown in Figure 13.
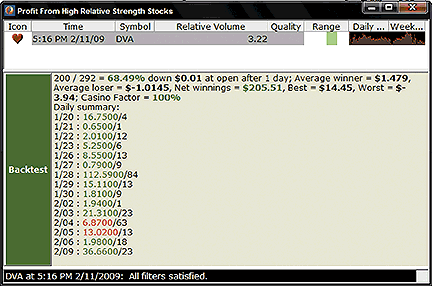
FIGURE 13: TRADE-IDEAS, SYSTEM RESULTS. Sample results are shown for the high relative strength strategy.
You can better understand these backtest results from The OddsMaker by consulting the user manual at https://www.trade-ideas.com/OddsMaker/Help.html.
![]() WEALTH-LAB: HIGH RELATIVE STRENGTH MUTUAL FUNDS
WEALTH-LAB: HIGH RELATIVE STRENGTH MUTUAL FUNDS
The Wealth-Lab code to implement the high relative strength mutual fund timing model from “Profit With High Relative Strength Mutual Funds” by Gerald Gardner in this issue is below.
using System;
using System.Collections.Generic;
using System.Text;
using System.Drawing;
using WealthLab;
using WealthLab.Indicators;

namespace WealthLab.Strategies
{
	public class MyStrategy : WealthScript
     {
	     protected override void Execute()
          {
	            Bars series_bond= GetExternalSymbol(“fhytx”, true);
	            double  diffbuy, diffsell;


SMA sma10_hotfx = SMA.Series(Close,10 );
SMAsma20_fhytx = SMA.Series(series_bond.Close,20 );


DataSeries Volatil_hotfx = StdDev.Series( sma10_hotfx,
10,StdDevCalculation.Sample  );
DataSeries Volatil_fhytx = StdDev.Series( sma20_fhytx,
20,StdDevCalculation.Sample  );

HideVolume();

for(int bar = Bars.FirstActualBar+90; bar < Bars.Count; bar++)
{

diffbuy = (series_bond.Close[bar] - sma20_fhytx[bar])/(2.0 *
Volatil_fhytx[bar]);
diffsell = (series_bond.Close[bar] - sma20_fhytx[bar])/(2.0 *
Volatil_fhytx[bar]);

	if (IsLastPositionActive)
	{
		//code your exit rules here
		if (diffsell < -1.0)
		{
		// Check if hotfx is heading down.  If not hold
        on for more

		diffsell = (Close[bar] - sma10_hotfx[bar])/(2.0
        * Volatil_hotfx[bar]);
		}


		if (diffsell < -1.0)
		{
		 SellAtMarket(bar + 1, LastPosition, “Sell at Market”);
		}

		// end code your exit rules here
		}
			else
		{
		//code your entry rules here
		if (diffbuy > 1.0)
		{
			if (Close[bar]  > sma10_hotfx[bar])
		{
			 BuyAtLimit(bar + 1, Close[bar]);

			}
		}
		// End code your entry rules here


	               }  // End BUY ELSE
	           }
	       }
      }
}