TRADERS’ TIPS
December 2009
Here is this month’s selection of Traders’ Tips, contributed by various developers of technical analysis software to help readers more easily implement some of the strategies presented in this and other issues.
Other code appearing in articles in this issue is posted in the Subscriber Area of our website at https://technical.traders.com/sub/sublogin.asp. Login requires your last name and subscription number (from mailing label). Once logged in, scroll down to beneath the “Optimized trading systems” area until you see “Code from articles.” From there, code can be copied and pasted into the appropriate technical analysis program so that no retyping of code is required for subscribers.
You can copy these formulas and programs for easy use in your spreadsheet or analysis software. Simply “select” the desired text by highlighting as you would in any word processing program, then use your standard key command for copy or choose “copy” from the browser menu. The copied text can then be “pasted” into any open spreadsheet or other software by selecting an insertion point and executing a paste command. By toggling back and forth between an application window and the open web page, data can be transferred with ease.
This month’s tips include formulas and programs for:
- TRADESTATION: THE DISPARITY INDEX (DIX)
- eSIGNAL: THE DISPARITY INDEX (DIX)
- METASTOCK: THE DISPARITY INDEX (DIX)
- WEALTH-LAB: THE DISPARITY INDEX (DIX)
- NEUROSHELL TRADER: THE DISPARITY INDEX (DIX)
- AIQ: THE DISPARITY INDEX (DIX)
- STRATASEARCH: THE DISPARITY INDEX (DIX)
- TRADERSSTUDIO: THE DISPARITY INDEX (DIX)
- STOCKFINDER: DISPARITY INDEX
- TRADINGSOLUTIONS: THE DISPARITY INDEX (DIX)
- TRADECISION: THE DISPARITY INDEX (DIX)
- NINJATRADER: THE DISPARITY INDEX (DIX)
- WAVE59: THE DISPARITY INDEX (DIX)
- TRADE NAVIGATOR/TRADESENSE: THE DISPARITY INDEX (DIX)
- NEOTICKER: THE DISPARITY INDEX (DIX)
- UPDATA: THE DISPARITY INDEX (DIX)
- VT TRADER: THE DISPARITY INDEX (DIX)
- TRADE IDEAS: THE DISPARITY INDEX (DIX)
- AMIBROKER: THE DISPARITY INDEX (DIX) — VALCU ARTICLE CODE
![]() TRADESTATION: THE DISPARITY INDEX (DIX)
TRADESTATION: THE DISPARITY INDEX (DIX)
Dan Valcu’s article in this issue, “Making The Most Of A Trend With The Disparity Index,” provides an indicator for expressing as a percentage of its current price the difference between the current price of a security and a moving average of its price. Code for the disparity index (Dix) indicator is provided here. The indicator can be applied to either a chart or to a RadarScreen window (Figure 1).
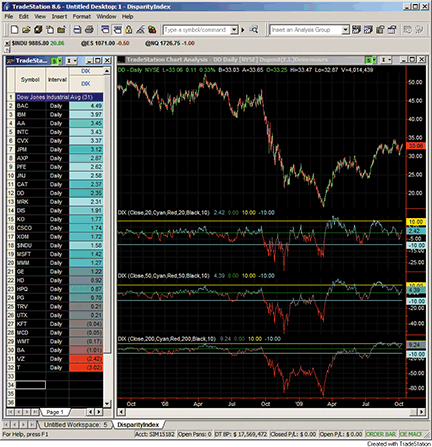
FIGURE 1: TRADESTATION, DISPARITY INDEX (DIX). In the left window, RadarScreen displays several of the Dow Jones Industrial Average component stocks. In the right window is shown a daily chart of Caterpillar, Inc. (CAT). The three lower subgraphs of the chart display the 20-, 50-, and 200-day DIX values.
The indicator includes inputs that allow for the color of the indicator in a chart (or the color of the cell background in RadarScreen) to vary according to the relative level of the indicator compared to previous values of itself. The color of the indicator in a chart and the color of the cell background in RadarScreen are varied between the user-specified UpColor and DnColor depending upon the current value of the indicator as compared to its range over a user-specified number of bars (ColorNormLength). When the indicator’s value is between its high and low values over ColorNormLength bars, a mixture of UpColor and DnColor is used, depending on whether the current value is closer to its high value or closer to its low value over the range. In TradeStation, this sort of coloring is referred to as “gradient coloring.”
To download the adapted EasyLanguage code, go to the TradeStation and EasyLanguage Support Forum (https://www.tradestation.com/Discussions/forum.aspx?Forum_ID=213). Search for the file “DIX.eld.”
This article is for informational purposes. No type of trading or investment recommendation, advice, or strategy is being made, given, or in any manner provided by TradeStation Securities or its affiliates.
Indicator:  DIX
inputs:
	Price( Close ),
	DIXLength( 20 ),
	UpColor( Cyan ), { Color to use for indicator values
	 that are relatively high, over ColorNormLength
	 bars. }
	DnColor( Red ), { Color to use for indicator
	 values that are relatively low over ColorNormLength
	 bars. }
    ColorNormLength( 20 ), { Number of bars over which
	 to normalize the indicator for gradient coloring.
	 See also:  comments in function NormGradientColor. }
	GridForegroundColor( Black ), { Color to use for
	 numbers in RadarScreen cells when gradient coloring
	 is enabled, that is, when both UpColor and DnColor
	 are set to non-negative values. }
	GridLevel( 10 ) ; { Level at which to plot a
	 horizontal line in chart.  Horizontal lines will be
	 plotted at both positive and negative values of
	 this number. }

	{ Set either UpColor and/or DnColor to -1 to disable
	gradient plot coloring.  When disabled, Plot1 color
	is determined by settings in indicator properties
	dialog box.  Colors of plots 2, 3, and 4 always come
	from indicator properties dialog box. }

variables:
	ApplicationType( 0 ),
	DIX( 0 ),
	ColorLevel( 0 ) ;

if CurrentBar = 1 then
	ApplicationType = GetAppInfo( aiApplicationType ) ;

if Price <> 0 then
	DIX = 100 * ( Price - XAverage( Price, DIXLength ) )
	 / Price ;

Plot1( DIX, "DIX" ) ;
Plot2( 0, "ZeroLine" ) ;
Plot3( GridLevel, "GridLevel" ) ;
Plot4( -1 * GridLevel, "-GridLevel" ) ;

{ Gradient coloring }
if UpColor >= 0 and DnColor >= 0 then
	begin
	ColorLevel = NormGradientColor( DIX, true,
	 ColorNormLength, UpColor, DnColor ) ;
	if ApplicationType = 1 then { study is applied to a
	 chart }
		SetPlotColor( 1, ColorLevel )
	else if ApplicationType > 1 then { study is applied
	 to grid app, like RadarScreen }
		begin
		SetPlotColor( 1, GridForegroundColor ) ;
		SetPlotBGColor( 1, ColorLevel ) ;
		end ;
	end ;

{ Alert criteria - alert if DIX is at its highest or
 lowest value over DIXLength bars }
if HighestBar( DIX, DIXLength ) = 0 then
	Alert( "DIX is high" )
else if LowestBar( DIX, DIXLength ) = 0 then
Alert( "DIX is low" ) ;![]() eSIGNAL: THE DISPARITY INDEX (DIX)
eSIGNAL: THE DISPARITY INDEX (DIX)
For this month’s Traders’ Tip, we’ve provided the formula “DisparityIndex.efs,” based on the formula code from Dan Valcu’s article in this issue, “Making The Most Of A Trend With The Disparity Index.”
The study is configured to display three separate disparity index indicators. Each individual indicator’s display on the chart can be hidden by setting the “Show line” parameter in the Edit Studies window (go to the Advanced Chart menu → Edit Studies). The period lengths, color, and line thickness may also be customized via Edit Studies.
A sample chart is shown in Figure 2.
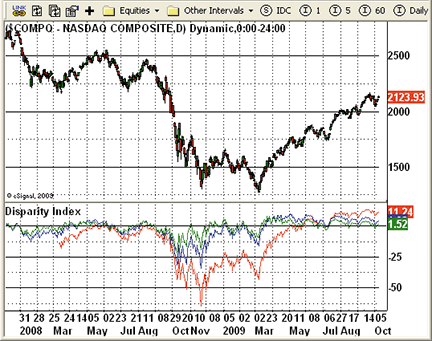
Figure 2: eSIGNAL, THE DISPARITY INDEX. Here is the NASDAQ Composite Index with three disparity index indicators set to 20, 50, and 200 periods, respectively.
To discuss this study or download complete copies of the formula code, please visit the Efs Library Discussion Board forum under the Forums link at www.esignalcentral.com or visit our Efs KnowledgeBase at www.esignalcentral.com/support/kb/efs/. The eSignal formula scripts (Efs) are also available for copying and pasting from the Stocks & Commodities website at Traders.com.
/*********************************
Provided By:
    eSignal (Copyright c eSignal), a division of Interactive Data
    Corporation. 2009. All rights reserved. This sample eSignal
    Formula Script (EFS) is for educational purposes only and may be
    modified and saved under a new file name.  eSignal is not responsible
    for the functionality once modified.  eSignal reserves the right
    to modify and overwrite this EFS file with each new release.

Description:
    Disparity Index

Version:            1.0  10/07/2009

Formula Parameters:                     Default:
    Length First                        200
    Length Secind                       50
    Length Third                        20
    First Line Color                    Red
    Second Line Color                   Blue
    Third Line Color                    Green
    Show First Line                     True
    Show Second Line                    True
    Show Third Line                     True
    FirstLineThickness                  1
    SecondLineThickness                 1
    ThirdLineThickness                  1

Notes:
    The related article is copyrighted material. If you are not a subscriber
    of Stocks & Commodities, please visit www.traders.com.

**********************************/

var fpArray = new Array();
var bInit = false;

function preMain() {
    setPriceStudy(false);
    setShowCursorLabel(true);
    setShowTitleParameters(false);
    setCursorLabelName("DIX", 0);
    setShowCursorLabel(true, 0);
    setPlotType(PLOTTYPE_LINE, 0);
    setDefaultBarThickness(1, 0);
    setDefaultBarFgColor(Color.red, 0);
    setCursorLabelName("DIX", 1);
    setShowCursorLabel(true, 1);
    setPlotType(PLOTTYPE_LINE, 1);
    setDefaultBarThickness(1, 1);
    setDefaultBarFgColor(Color.blue, 1);
    setCursorLabelName("DIX", 2);
    setShowCursorLabel(true, 2);
    setPlotType(PLOTTYPE_LINE, 2);
    setDefaultBarThickness(1, 2);
    setDefaultBarFgColor(Color.green, 2);
    setStudyTitle("Disparity Index");
    askForInput();
    var x=0;
    fpArray[x] = new FunctionParameter("LengthFirst", FunctionParameter.NUMBER);
	with(fpArray[x++]){
        setName("Length First");
        setLowerLimit(1);
        setDefault(200);
    }
    fpArray[x] = new FunctionParameter("LengthSecond", FunctionParameter.NUMBER);
	with(fpArray[x++]){
	    setName("Length Second");
        setLowerLimit(1);
        setDefault(50);
    }
    fpArray[x] = new FunctionParameter("LengthThird", FunctionParameter.NUMBER);
	with(fpArray[x++]){
	    setName("Length Third");
        setLowerLimit(1);
        setDefault(20);
    }
    fpArray[x] = new FunctionParameter("FirstLineColor", FunctionParameter.COLOR);
    with(fpArray[x++]){
        setName("First Line Color");
        setDefault(Color.red);
    }
    fpArray[x] = new FunctionParameter("SecondLineColor", FunctionParameter.COLOR);
    with(fpArray[x++]){
        setName("Second Line Color");
        setDefault(Color.blue);
    }
    fpArray[x] = new FunctionParameter("ThirdLineColor", FunctionParameter.COLOR);
    with(fpArray[x++]){
        setName("Third Line Color");
        setDefault(Color.green);
    }
    fpArray[x] = new FunctionParameter("ShowFirst", FunctionParameter.BOOLEAN);
    with(fpArray[x++]){
        setName("Show First Line");
        setDefault(true);
    }
    fpArray[x] = new FunctionParameter("ShowSecond", FunctionParameter.BOOLEAN);
    with(fpArray[x++]){
        setName("Show Second Line");
        setDefault(true);
    }
    fpArray[x] = new FunctionParameter("ShowThird", FunctionParameter.BOOLEAN);
    with(fpArray[x++]){
        setName("Show Third Line");
        setDefault(true);
    }
    fpArray[x] = new FunctionParameter("FirstLineThickness", FunctionParameter.NUMBER);
    with(fpArray[x++]){
        setName("First Line Thickness");
        setLowerLimit(1);
        setDefault(1);
    }
    fpArray[x] = new FunctionParameter("SecondtLineThickness", FunctionParameter.NUMBER);
    with(fpArray[x++]){
        setName("First Line Thickness");
        setLowerLimit(1);
        setDefault(1);
    }
    fpArray[x] = new FunctionParameter("ThirdLineThickness", FunctionParameter.NUMBER);
    with(fpArray[x++]){
        setName("First Line Thickness");
        setLowerLimit(1);
        setDefault(1);
    }
}

var xDIX200 = null;
var xDIX50 = null;
var xDIX20 = null;

function main(LengthFirst, LengthSecond, LengthThird, FirstLineColor, SecondLineColor, ThirdLineColor,
             ShowFirst, ShowSecond, ShowThird, FirstLineThickness, SecondtLineThickness, ThirdLineThickness) {
var nBarState = getBarState();
var nDIX200 = 0;
var nDIX50 = 0;
var nDIX20 = 0;
var aReturn = new Array();
var nCount = 0;
    if (nBarState == BARSTATE_ALLBARS) {
        if (LengthFirst == null) LengthFirst = 200;
        if (LengthSecond == null) LengthSecond = 50;
        if (LengthThird == null) LengthThird = 20;
        if (FirstLineColor == null) FirstLineColor = Color.red;
        if (SecondLineColor == null) SecondLineColor = Color.blue;
        if (ThirdLineColor == null) ThirdLineColor = Color.green;
        if (ShowFirst == null) ShowFirst = true;
        if (ShowSecond == null) ShowSecond = true;
        if (ShowThird == null) ShowThird = true;
        if (FirstLineThickness == null) FirstLineThickness = 1;
        if (SecondtLineThickness == null) SecondtLineThickness = 1;
        if (ThirdLineThickness == null) ThirdLineThickness = 1;
    }
    if ( bInit == false ) {
        setDefaultBarFgColor(FirstLineColor, 0);
        setDefaultBarFgColor(SecondLineColor, 1);
        setDefaultBarFgColor(ThirdLineColor, 2);
        setDefaultBarThickness(FirstLineThickness, 0);
        setDefaultBarThickness(SecondtLineThickness, 1);
        setDefaultBarThickness(ThirdLineThickness, 2);
        xDIX200 = efsInternal("Calc_DIX", LengthFirst);
        xDIX50 = efsInternal("Calc_DIX", LengthSecond);
        xDIX20 = efsInternal("Calc_DIX", LengthThird);
        bInit = true;
    }
    nDIX200 = xDIX200.getValue(0);
    nDIX50 = xDIX50.getValue(0);
    nDIX20 = xDIX20.getValue(0);
    if (nDIX200 == null && nDIX50 == null && nDIX20 == null) return;
    if (ShowFirst) aReturn[nCount++] = nDIX200; else {
        setShowCursorLabel(false, 0);
        aReturn[nCount++] = null;
    }
    if (ShowSecond) aReturn[nCount++] = nDIX50; else {
        setShowCursorLabel(false, 1);
        aReturn[nCount++] = null;
    }
    if (ShowThird) aReturn[nCount++] = nDIX20; else {
        setShowCursorLabel(false, 2);
        aReturn[nCount++] = null;
    }
    return aReturn;
}

var bSecondInit = false;
var xEMA = null;

function Calc_DIX(Length) {
var nRes = 0;
var nEMA = 0;
var nClose = 0;
    if (bSecondInit == false) {
        addBand(0,PS_SOLID,1,Color.black,"Zero");
        xEMA = ema(Length);
        bSecondInit = true;
    }
    nEMA = xEMA.getValue(0);
    if (nEMA == null) return;
    nClose = close(0);
    nRes = 100 * (nClose - nEMA) / nClose;
    return nRes;
}
![]() METASTOCK: THE DISPARITY INDEX (DIX)
METASTOCK: THE DISPARITY INDEX (DIX)
Dan Valcu’s article in this issue, “Making The Most Of A Trend With The Disparity Index,” introduces a new indicator and a screening method. Both can be added to MetaStock with the formulas given here.
To enter this indicator into MetaStock:
- In the Tools menu, select Indicator Builder.
- Click “New” to open the Indicator Editor for a new indicator.
- Type the name of the indicator.
- Click in the larger window and paste or type in the following formula:
x:=Input(“Time Periods”,1,500,20);
100*(C-Mov(C, x, E)) / C
- Click OK to close the Indicator Editor.
The exploration and instructions for creating it in MetaStock are:
- Select Tools > the Explorer.
- Click New.
- Enter a name, “Disparity Index Scan”
- Select the Column A tab and enter the following formula:
Close
- Click in the “Col Name” box and enter the text “Close”
- Select the Column B tab and enter the following formula:
x:= 200;
100*(C-Mov(C, x, E)) / C
- Click in the “Col Name” box and enter the text “DIX 200”
- Select the Column C tab and enter the following formula:
x:= 50;
100*(C-Mov(C, x, E)) / C
- Click in the “Col Name” box and enter the text “DIX 50”
- Select the Column D tab and enter the following formula:
x:= 20;
100*(C-Mov(C, x, E)) / C
- Click in the “Col Name” box and enter the text “DIX 20”
- Click OK to close the exploration editor.
![]() WEALTH-LAB: THE DISPARITY INDEX (DIX)
WEALTH-LAB: THE DISPARITY INDEX (DIX)
In Dan Valcu’s article in this issue, “Making The Most Of A Trend With The Disparity Index,” the disparity index (Dix) seems to correlate nearly perfectly with other oscillators like Rsi and StochD at their extremes, largely providing the same overbought/oversold information. In addition, since Dix doesn’t oscillate within a defined range, we found it difficult to use in backtesting without dynamically analyzing the indicator.
Not to give up on putting Dix to use, after adjusting the formula slightly to measure the percentage distance of price with respect to the moving average (the article’s formula is the reverse of this), we created a normalized indicator by dividing the modified Dix with Atrp. The normalization helps confine Dix to a range of values even during extreme movements. Finally, by tallying the number of stocks in a DataSet whose normalized Dix is above a given value, we can create a market breadth indicator that gives us the percentage of “bullish” issues. For the sake of a name we’ll call it the bullish disparity percent. The formulation is inspired by the bullish percent index, which is based on point & figure signals (Figure 3).
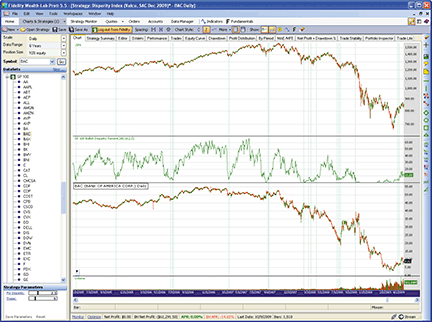
Figure 3: WEALTH-LAB, BULLISH DISPARITY PERCENT. As evidenced by the vertical lines, when the bullish disparity percent rises from under 5, it’s been a good time to be long the S&P 100.
WealthScript Code (C#):

using System;
using System.Collections.Generic;
using System.Text;
using System.Drawing;
using WealthLab;
using WealthLab.Indicators;

namespace WealthLab.Strategies
{
   public class BullishDisparityPercent : WealthScript
   {
      StrategyParameter _pctDix;
      StrategyParameter _trigger;

      public BullishDisparityPercent()
      {
         _pctDix = CreateParameter("Pct Disparity", 2.5, 0, 8, 0.5);
         _trigger = CreateParameter("Trigger", 5, 1, 20, 1);
      }

      public DataSeries DIXN(Bars bars, int dixPeriod, int atrPeriod)
      {
         DataSeries ema = EMA.Series(bars.Close, dixPeriod, EMACalculation.Modern);
         DataSeries atr = ATRP.Series(bars, atrPeriod);
         DataSeries dixN = 100 * (bars.Close/ema - 1) / atr;
         dixN.Description = "DIXN(" + dixPeriod + "," + atrPeriod + ")";
         return dixN;
      }

      public DataSeries BullishDIX (int dixPeriod, int atrPeriod, double disparity)
      {
         DataSeries dixMO = new DataSeries(Bars, "dixMO");
         DataSeries contribs = new DataSeries(Bars, "Contributing Symbol Count");

         foreach(string symbol in DataSetSymbols)
         {
            SetContext(symbol, true);
            PrintStatusBar("Processing: " + symbol);
            DataSeries dixN = DIXN(Bars, dixPeriod, atrPeriod);
            for (int bar = Bars.FirstActualBar; bar < Bars.Count; bar ++)
            {
               contribs[bar]++;
               if( dixN[bar] > disparity )
                  dixMO[bar]++;
            }
            RestoreContext();
         }
         Community.Components.Utility u = new Community.Components.Utility(this);
         dixMO = 100 * dixMO / contribs;
         dixMO.Description = u.GetDataSetName() + " Bullish Disparity Percent(" + dixPeriod + "," + atrPeriod + "," + disparity + ")";
         return dixMO;
      }

      protected override void Execute()
      {
         ChartPane dixPane = CreatePane(50, true, true);
         DataSeries dixBull = BullishDIX(100, 10, _pctDix.Value);
         PlotSeries(dixPane, dixBull, Color.Green, LineStyle.Solid, 1);

         // Find an associated index
         ChartPane idxPane = CreatePane( 100, true, true );
         idxPane.LogScale = true;
         Bars idxBars = null;
         if (DataSetSymbols[0] == "AAPL")
            idxBars = GetExternalSymbol(".NDX", true);
         else if (DataSetSymbols[2] == "ABT")
            idxBars = GetExternalSymbol(".SPX", true);
         else
            idxBars = GetExternalSymbol(".DJI", true);
         PlotSymbol(idxPane, idxBars, Color.Green, Color.Red);

         // Highlight buy zones
         for (int bar = 100; bar < Bars.Count; bar++)
         {
            if( dixBull[bar - 1] < _trigger.Value && CrossOver(bar, dixBull, _trigger.Value) )
               SetBackgroundColor(bar, Color.Aquamarine);
         }
      }
   }
}
![]() NEUROSHELL TRADER: THE DISPARITY INDEX (DIX)
NEUROSHELL TRADER: THE DISPARITY INDEX (DIX)
The disparity index described in Dan Valcu’s article in this issue (“Making The Most Of A Trend With The Disparity Index”) can be easily implemented in NeuroShell Trader by combining a few of NeuroShell Trader’s 800+ indicators. First, select “New Indicator …” from the Insert menu and use the Indicator Wizard to set up the following indicator:
Multiply2( 100, Divide( Subtract( Close, ExpAvg( Close, 50 ) ), Close ) )
Figure 4 displays the 50-period indicator on a four-hour bar chart for Gpb, along with the corresponding support and resistance lines of +3% and -2%, respectively. Traders can tighten up trailing stops when prices approach these lines in an effort to preserve gains. The indicator may also be used to scan for “black swan”– type events. Traders may also take advantage of NeuroShell Trader Professional’s ability to optimize parameters such as the number of periods in the moving average for more profitable signals.
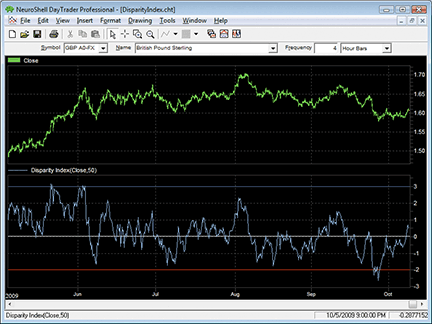
Figure 4: NEUROSHELL TRADER, DISPARITY INDEX. Here is an example implementation of the disparity index on a four-hour bar chart of GBP.
Scanning for reversal candidates, as described in the article, is easily done using NeuroShell Trader’s built-in ticker-scanning capability. First, select “Scan ticker symbols” from the File menu to display the Scanning Wizard. In the Scanning Wizard, select the data frequency to be scanned (such as daily, hourly, 10-minute, and so on); select the ticker symbols you wish to scan; and then add the indicators you wish to scan, which in this case are the 200-, 50-, and 20-bar disparity index. Once the scan is completed (Figure 5), you can sort the results based on any of the disparity index values and then check off which stocks you want to chart for further analysis and creation of trading systems.
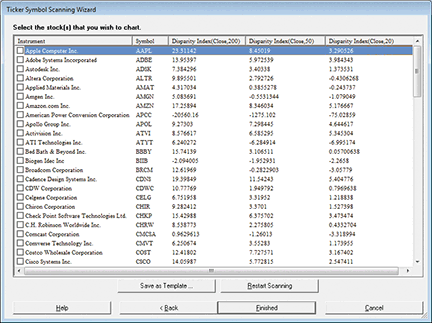
Figure 5: NEUROSHELL TRADER, STOCK SCANNING. Here is a disparity index scan of NASDAQ 100 stocks.
![]() AIQ: THE DISPARITY INDEX (DIX)
AIQ: THE DISPARITY INDEX (DIX)
The Aiq code for the disparity index (Dix) described in the article, “Making The Most Of A Trend With The Disparity Index” by Dan Valcu, is shown here.
The coded version that I have supplied also includes a system that can be used to test the indicator. The system only uses the three Dix indicators. The rules for the system are to go long when the Dix200 is greater than 5 and the Dix50 is greater than 3 and the Dix10 is less than -5 (long only). Positions are exited when either the Dix10 is greater than 5 (the profit target), or a loss of 15% is incurred at the close of a bar, or a profit-protect exit with settings of 80% protection after a 5% profit is reached.
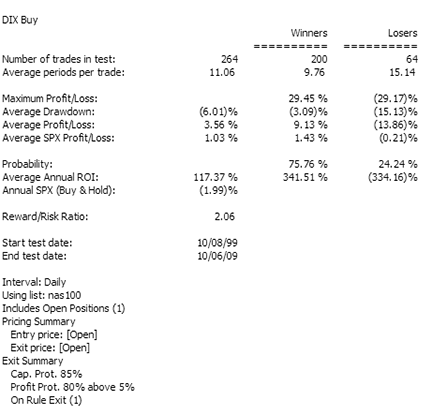
Figure 6: AIQ SYSTEMS, DIX BACKTEST. Here are the summary results from a 10-year backtest of a system using just the DIX indicators on the NASDAQ 100 list of stocks.
The idea is to buy stocks that are in intermediate- and long-term uptrends but are pulling back on a short-term basis. I did not attempt to optimize these parameters but rather just observed a chart of Emc for what appeared to be good levels and then tested the entire list of Nasdaq 100 stocks over the last 10 years. The results of testing all signals using the Eds module are shown in Figure 6 and a sample trade on Yhoo from the backtest is shown in Figure 7. Although many of the metrics are excellent, the one problem is that there are too few trades and probably some trade bunching. These problems would be more obvious if we ran a trading simulation using the Aiq Portfolio Manager module, which emulates real trading. The quick test shows these indicators can be used to build an effective trading system.
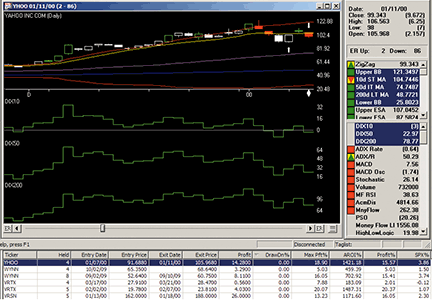
Figure 7: AIQ SYSTEMS, DIX SYSTEM. This chart of YHOO shows one of the trades from the sample system with the three DIX indicators and several other trades in table format only.
The code can be downloaded from the Aiq website at www.aiqsystems.com and also from www.TradersEdgeSystems.com/traderstips.htm.
! DISPARITY INDEX (DIX)
! Author: Dan Valcu, TASC December 2009
! Coded by: Richard Denning 10/06/09
! www.TradersEdgeSystems.com

C is [close].
EMA10 is expavg(C,10).
EMA50 is expavg(C,50).
EMA200 is expavg(C,200).

DIX10 is (C / EMA10 - 1) * 100.   !PLOT
DIX50 is (C / EMA50 - 1) * 100.   !PLOT
DIX200 is (C / EMA200 - 1) * 100. !PLOT

Buy if DIX10 < -5 and DIX50 > 3 and DIX200 > 5.
Exit if DIX10 > 5.
![]() STRATASEARCH: THE DISPARITY INDEX (DIX)
STRATASEARCH: THE DISPARITY INDEX (DIX)
While this month’s formula might not be particularly complex, the concept described in Dan Valcu’s article in this issue, “Making The Most Of A Trend With The Disparity Index,” is still a good one. Stocks can move at extraordinary rates for only a short time before they tend to bounce back to a historical norm. The disparity index provides a helpful method for monitoring this. See Figure 8.
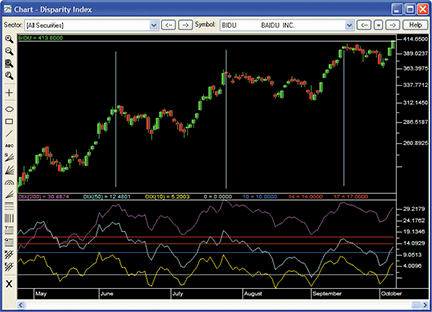
Figure 8: STRATASEARCH, DISPARITY INDEX. As shown in the chart, each peak in the 200-day disparity index is followed by a down or neutral period. The three blue lines identify the three peaks in the 200-day disparity index.
In our first test, the 10-, 50-, and 200-day Dix values were placed in the StrataSearch Screener. Alongside these, additional columns were created to display the stock’s gain/loss over the next five, 10, and 20 days. What we discovered was that high Dix values don’t necessarily lead to reversals, but high Dix values relative to the stock’s historical highs provide the greatest indicator of reversals.
In our second test, a number of entry and exit trading rules were created based on the Dix performance, and these trading rules were then placed in an automated search to test the Dix alongside a wide variety of alternate indicators. The author suggests stochastics, relative strength index, or Bollinger bands, but we found the Dix to be effective when used with many other indicators as well.
As with all other Traders’ Tips, additional information, including plug-ins, can be found in the Shared Area of the StrataSearch user forum. This month’s plug-in allows StrataSearch users to use the Dix in both the StrataSearch Screener and in a variety of automated searches for profitable trading systems.
//*********************************************************
// Disparity Index
//*********************************************************
Days = parameter("Days");
DIX = 100 * (C-mov(C, Days, e))/C;
![]() TRADERSSTUDIO: THE DISPARITY INDEX (DIX)
TRADERSSTUDIO: THE DISPARITY INDEX (DIX)
The TradersStudio code for the disparity index (Dix) indicator, function, and system from the article, “Making The Most Of A Trend With The Disparity Index” by Dan Valcu, is shown here.
The coded version that I have supplied also includes a system that can be used to test the indicator. The system only uses the three Dix indicators. The idea behind the system is to buy short-term pullbacks against the intermediate- and long-term trend of the futures contract. The Dix10 is used to find the short-term pullbacks and the Dix50 and Dix200 indicators are used to find the intermediate- and long-term trend. I use three parameters that represent the level of the Dix. The rules for the system are:
- Go long when the Dix200 is greater than “ltLvl” and the Dix50 is greater than “itLvl” and the Dix10 is less than “stLvl.”
- Long positions are exited when either the Dix10 is greater than “stLvl” (the profit target) or a loss of 15% is incurred at the close of a bar. Positions are also exited on a reversing signal.
- Reverse rules 1 and 2 for the short side.
I used three of the grain futures contracts — corn, soybeans, and wheat — day session only, to test the indicators. I experimented with parameters “stLvl,” “itLvl,” and “ltLvl” and found that the “stLvl” was the most sensitive. I also found that small values between zero and 1.0 represent the most relevant range. I did not change the three indicator lengths of 10, 50, and 200.
To measure the robustness of the parameter sets from the Dix system optimization, I show in Figure 9 two three-dimensional models. The left model shows the “stLvl” and the “itLvl” parameters compared to the net profit, and the right model shows the same two parameters compared to the average profit per trade. I used the TradersStudio add-in to produce the three-dimensional models.
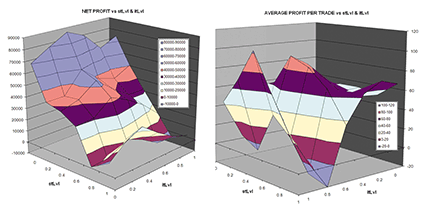
Figure 9: TRADERSSTUDIO, DISPARITY INDEX. Two three-dimensional graphs show parameter optimizations compared to net profit and average profit per trade for a grain futures portfolio of corn, soybeans, and wheat.
The code can be downloaded from the TradersStudio website at www.TradersStudio.com →Traders Resources→FreeCode and also from www.TradersEdgeSystems.com/traderstips.htm.
![]() STOCKFINDER: DISPARITY INDEX
STOCKFINDER: DISPARITY INDEX
Note: To use the indicators, rules, and charts in this article, you will need the StockFinder software. Go to www.StockFinder.com to download the software and get a free trial.
The disparity index discussed in Dan Valcu’s article in this issue, “Making The Most Of A Trend With The Disparity Index,” is now available in the StockFinder indicator library. You can add the indicator to your chart in StockFinder by clicking the “Add Indicator” button or by simply typing “/Disparity Index” and choosing it from the filtered list of available indicators.
Sorting and scanning for Dix values is simple in StockFinder. There’s a prebuilt chart you can use as a reference for the article and to develop your own analysis using the disparity index. Just click “Share,” then “Browse shared items” and search for “disparity index” on the Charts tab (Figure 10).
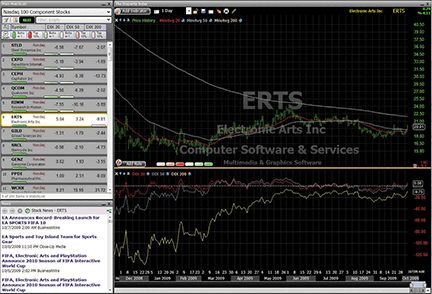
Figure 10: STOCKFINDER, DISPARITY INDEX. The disparity index is plotted for the 20-, 50-, and 200-day moving averages. In the watchlist on the left, you can sort by DIX values and also scan for the top and bottom 10% of the active list, as Dan Valcu demonstrates in his article.
For more information or to start a free trial, please visit www.StockFinder.com.
![]() TRADINGSOLUTIONS: THE DISPARITY INDEX (DIX)
TRADINGSOLUTIONS: THE DISPARITY INDEX (DIX)
In “Making The Most Of A Trend With The Disparity Index,” Dan Valcu determines the difference of a price value from its exponential moving average (Ema) and converts it to a relative indicator by dividing by the current value and multiplying by 100.
Note: This function is similar to the TradingSolutions function percent difference from moving average (exponential) (%Diff_Ema). However, it differs in that it divides the difference by the volatile current value rather than by the more stabile moving average. In evaluating this indicator, you may want to try both the Dix and %Diff_Ema for the purposes that Valcu outlines in his article.
The Dix function is given here and is also available as a function file that can be downloaded from the TradingSolutions website (www.tradingsolutions.com) in the Free Systems section.
Function Name: Disparity Index
Short Name: DIX
Inputs: Data,  Period
Mult (100, Div (Sub (Data, EMA (Data, Period)), Data))
![]() TRADECISION: THE DISPARITY INDEX (DIX)
TRADECISION: THE DISPARITY INDEX (DIX)
In his article in this issue, “Making The Most Of A Trend With The Disparity Index,” Dan Valcu analyzes volatile markets, where the formation of peaks and troughs is difficult to forecast. The disparity index is an indicator that should help to squeeze the best out of a trend whether you are trading equities, futures, or forex.
Using the Function Builder in Tradecision, first create the disparity function: Disparity function:
Disparity function:
function (Price:Numeric=Close, N:Numeric=10, Method:Numeric = E):Numeric;
Var
 Disparity:=0;
End_var

Disparity:= 100*(Price -  MOV(Price,N,Method))/Price;

return Disparity;
Then create the disparity indicator using Tradecision’s Indicator Builder:
Disparity indicator:
input
 Price:"Enter the price:", Close;
 Length:"Enter the Length:", 20;
 Method:"Enter the Moving Average Method:", E;
end_input

return Disparity(Price,Length,Method);
In the NeatScan market scanner, create the Dix scan using the following code:
return true;
Then add three custom columns to the scan to display the indicator reading for three different average smoothing lengths:
Column DIX(20):
var
 nper1 := 20;
 dix20:= 0;
End_var

dix20:=100*(C-EMA(C,nper1))/C;

return dix20;

Column DIX(50):
var
 nper1 := 50;
 dix50:= 0;
End_var

dix50:=100*(C-EMA(C,nper1))/C;

return dix50;

Column DIX(200):
var
 nper1 := 200;
 dix200:= 0;
End_var

dix200:=100*(C-EMA(C,nper1))/C;

return dix200;
The scan results (Figure 11) display the top stocks based on the Dix(200), Dix(50), and Dix(20), sorted by Dix(20).
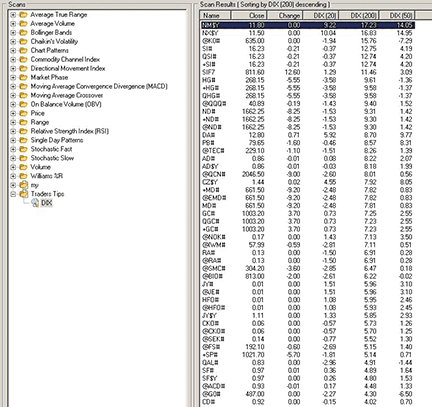
FIGURE 11: TRADECISION, SCANNING FOR PRICE REVERSAL CANDIDATES
A sample chart is shown in Figure 12.
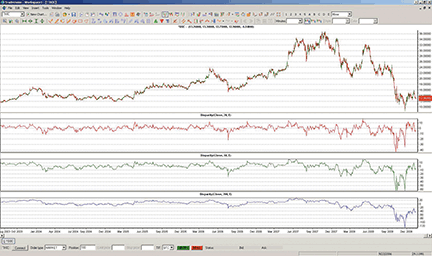
FIGURE 12: TRADECISION, NASDAQ COMPOSITE INDEX and DIX. Three disparity indicators with different lengths (for 20, 50, and 200 days) are plotted on a NASDAQ composite index chart.
To import the strategy into Tradecision, visit the area “Traders’ Tips from Tasc Magazine” at www.tradecision.com/support/tasc_tips/tasc_traders_tips.htm or copy the code from the Stocks & Commodities website at www.traders.com.
![]() NINJATRADER: THE DISPARITY INDEX (DIX)
NINJATRADER: THE DISPARITY INDEX (DIX)
The disparity index as discussed by Dan Valcu in his article “Making The Most Of A Trend With The Disparity Index” has been implemented as an indicator available for download at www.ninjatrader.com/SC/Dec2009SC.zip.
Once it has been downloaded, from within the NinjaTrader Control Center window, select the menu File→Utilities→Import NinjaScript and select the downloaded file. This indicator is for NinjaTrader version 6.5 or greater.
You can review the indicator’s source code by selecting the menu Tools→Edit NinjaScript→Indicator from within the NinjaTrader Control Center window and selecting “DisparityIndex.”
NinjaScript indicators are compiled Dlls that run native, not interpreted, which provides you with the highest performance possible. A sample chart implementing the indicator is shown in Figure 13.
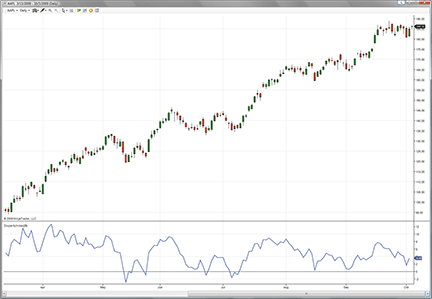
Figure 13: NINJATRADER, DISPARITY INDEX. This screenshot shows the disparity index applied to a daily chart of AAPL.
![]() WAVE59: THE DISPARITY INDEX (DIX)
WAVE59: THE DISPARITY INDEX (DIX)
In his article in this issue, “Making The Most Of A Trend With The Disparity Index,” Dan Valcu describes his disparity index (Dix), which indicates how excessively a stock has moved from its mean.
Figure 14 is a daily chart of Ibm with a 50-period Dix applied. Note the clear bullish indication in the Dix in late 2008 at a time when Ibm had lost 50% of its value in only a few short months.
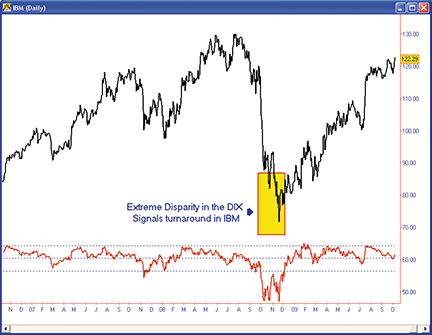
FIGURE 14: WAVE59, DISPARITY INDEX. Here is a daily chart of IBM with a 50-period DIX applied.
The following script implements this indicator in Wave59. As always, users of Wave59 can download these scripts directly using the QScript Library found at https://www.wave59.com/library.
Indicator: SC_Valcu_DIX
# set up user inputs
input:price(close),length(20),thresholds(10),dix_width(1),dix_color(red),thresh_color(blue);

# calculate the dix
dix = 100*(price-average(price, length)) / price;

# plot the dix
plot1 = dix;
color1 = dix_color;
thickness1 = dix_width;

# plot the zero line and threshold levels
plot2 = 0;
plot3 = thresholds;
plot4 = -thresholds;
color2, color3, color4 = thresh_color;
style2, style3, style4 = ps_dot;
![]() TRADE NAVIGATOR/TRADESENSE: THE DISPARITY INDEX (DIX)
TRADE NAVIGATOR/TRADESENSE: THE DISPARITY INDEX (DIX)
Trade Navigator offers everything needed for recreating the charts discussed in “Making The Most Of A Trend With The Disparity Index” by Dan Valcu in this issue.
Here is how to recreate the custom indicators using TradeSense code. A template lets you easily add the custom indicators to any chart in Trade Navigator.
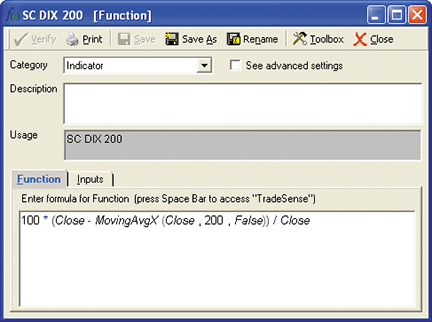
Figure 15: TRADE NAVIGATOR, THE DISPARITY INDEX. Here is how to set up a function.
First, open the Trader’s Toolbox, click on the Functions tab, and click the New button. For the SC Dix 200 indicator, type in the following code (Figure 15):
SC DIX 200
100 * (Close - MovingAvgX (Close , 200 , False)) / Close
Click the Verify button. When you are finished, click the Save button, type a name for your new function, and click OK. Repeat these steps for the SC Dix 50 and SC Dix 20 using the following formulas for each:
SC DIX 50
100 * (Close - MovingAvgX (Close , 50 , False)) / Close

SC DIX 20
100 * (Close - MovingAvgX (Close , 20 , False)) / Close.
To create a chart, go to the “Add to chart” window by clicking on the chart and typing “A” on the keyboard. Click on the Indicators tab, find the SC Dix 200 indicator in the list, and either double-click on it or highlight the name and click the Add button.
Repeat these steps to add SC Dix 50 and SC Dix 20. Once you have the three indicators added to the chart, click on the label for each indicator and drag it into the pane with the SC Dix 200.
To add a horizontal line, hold the control key down while clicking on the left-mouse button. Type E to bring up the Chart Settings window (Figure 16). Highlight the horizontal line in the Chart Settings window and change the Value to zero.
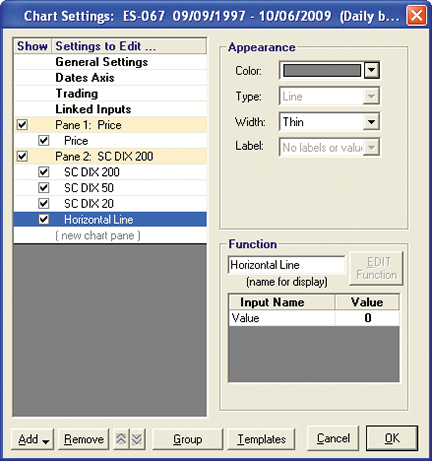
Figure 16: TRADE NAVIGATOR, Chart Settings.
Highlight each indicator and change it to the desired color. When you have them the way you want to see them, click OK. Use + and - keys to get the desired bar spacing.
You can save your new chart as a template to use for other charts. Once you have the chart set up, go to the Charts dropdown menu, select Templates and then Manage chart templates. Click on the New button, type in a name for your new template and click OK.
Genesis Financial Technologies has provided a library called the disparity index that includes a template with the custom indicators and studies discussed in this article all in a special file named “SC0912,” downloadable through Trade Navigator.
![]() NEOTICKER: THE DISPARITY INDEX (DIX)
NEOTICKER: THE DISPARITY INDEX (DIX)
The disparity index presented in Dan Valcu’s article in this issue, “Making The Most Of A Trend With The Disparity Index,” is the difference between the exponential moving average and closing price of an underlying data series. In NeoTicker, this calculation can be done with one line of formula and the result can be plotted on a chart using the formula indicator.
To do this, add the indicator formula in a time chart. After adding the formula indicator, at the Edit Indicator window, plot1 parameter, enter the disparity index formula:
c-xaverage(data1, 50)
This will plot the calculation’s result in a different pane (Figure 17).
This formula code returns a 50-period disparity index. To get a calculation of a different period, simply replace the number within the average call to get a disparity index with a different period.
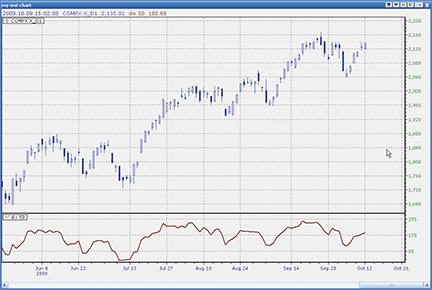
FIGURE 17: NEOTICKER, DISPARITY INDEX. Enter the formula.
![]() UPDATA: THE DISPARITY INDEX (DIX)
UPDATA: THE DISPARITY INDEX (DIX)
This Traders’ Tip is based on Dan Valcu’s article in this issue, “Making The Most Of A Trend With The Disparity Index.” Valcu proposes a simple tool to estimate when a market is likely to mean-revert using three standardized exponential moving averages of distinct length. (See Figure 18.)
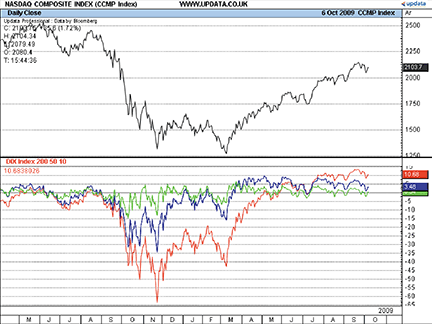
Figure 18: UPDATA, DISPARITY INDEX. This chart shows the NASDAQ Composite Index with 200-, 50-, and 10-period DIX indicators.
The Updata code here is also in the Updata Indicator Library and may be downloaded by clicking the “custom” menu and then “Indicator Library.” Those who cannot access the library due to firewall issues may paste the code into the Updata custom editor and save it.
In addition, Updata’s highlighter/scan function allows a scan of multiple index components to identify such mean-reverting periods. All parameters are fully customizable with the Updata code.
' Disparity Index by Dan Vaclu
' December 2009 issue of Stocks and Commodities Magazine
NAME DIX Index
PARAMETER "Long Term" #long=200
PARAMETER "Medium Term" #med=50
PARAMETER "Short Term" #short=10
DISPLAYSTYLE 3LINES
PLOTSTYLE LINE RGB(255,0,0)
PLOTSTYLE2 LINE RGB(0,0,255)
PLOTSTYLE3 LINE RGB(0,255,0)
@longDIX=0
@medDIX=0
@shortDIX=0

For #CURDATE=#long To #LASTDATE

   @longDIX=100*(Close-Eave(#long))/Close
   @medDIX=100*(Close-Eave(#med))/Close
   @shortDIX=100*(Close-Eave(#short))/Close

   @PLOT=@longDIX
   @PLOT2=@medDIX
   @PLOT3=@shortDIX

Next
![]() VT TRADER: THE DISPARITY INDEX (DIX)
VT TRADER: THE DISPARITY INDEX (DIX)
Our Traders’ Tip this month is inspired by the article “Making The Most Of A Trend With The Disparity Index” by Dan Valcu in this issue.
We’ll be offering the disparity index (Dix) indicator for download in our online forums. The VT Trader code and instructions for recreating the indicator are as follows:
- VT Trader’s Ribbon→Technical Analysis menu→Indicators group→Indicators Builder→[New] button
- In the Indicator Bookmark, type the following text for each field:
Name: TASC - 12/2009 - Disparity Index (DIX)
Short Name: tasc_DIX
Label Mask: TASC - 12/2009 - Disparity Index (DIX) (%Prc%,%Pds%,%maT%) = %DIX%
Placement: New Frame
Inspect Alias: DIX
- In the Input Variable(s) tab, create the following variables:
[New] button...
Name: Prc
Display Name: Price
Type: Price
Default: Close

[New] button...
Name: Pds
Display Name: Periods
Type: integer
Default: 20

[New] button...
Name: maT
Display Name: MA Type
Type: MA Type
Default: Exponential
- In the Output Variable(s) tab, create the following variables:
[New] button...
Var Name: DIX
Name: (DIX)
Line Color: blue
Line Width: thin
Line Type: solid
- In the Horizontal Line tab, create the following variables:
[New] button...
Value: +0.0000
Color: black
Width: thin
Type: dashed
- In the Formula tab, copy and paste the following formula:
{Provided By: Capital Market Services, LLC & Visual Trading Systems, LLC}
{Copyright: 2009}
{Description: TASC, December 2009 - “Making the Most of a Trend with the Disparity Index” by Dan Valcu}
{File: tasc_DIX.vtsrc - Version 1.0}

DIX:= 100 * (Prc-mov(Prc,Pds,maT))/Prc;
- Click the “Save” icon to finish building the Dix indicator.
To attach the indicator to a chart (Figure 19), click the right-mouse button within the chart window and then select Add Indicator &rar' “Tasc - 12/2009 - Disparity Index (Dix)” from the indicator list.
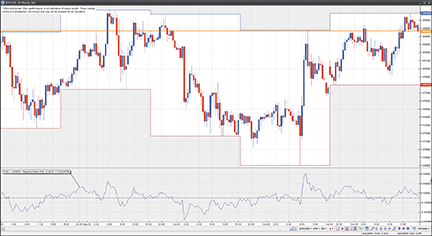
Figure 19: VT TRADER, DISPARITY INDEX. The DIX is shown on a EUR/USD 30-minute candle chart.
To learn more about VT Trader, visit www.cmsfx.com.
Risk disclaimer: Past performance is not indicative of future results. Forex trading involves a substantial risk of loss and may not be suitable for all investors.
![]() TRADE IDEAS: THE DISPARITY INDEX (DIX)
TRADE IDEAS: THE DISPARITY INDEX (DIX)
“The correction will begin five minutes after you can’t stand it any more and buy at market.”—Steve Ellison
How far is too far?
Stocks from time to time tend to go up too much or down too much in a very short amount of time. When this happens, astute traders who have the tools to know what is or is not unusual are able to take the other side of the extended move and profit when the stock returns to a normal range.
Our model this month identifies when stocks break those unusual thresholds using Trade Ideas’ analysis of standard deviations. Here is a strategy that uses the standard deviation alerts and then buys the stocks that are down three standard deviations or more. Then the strategy sells the stocks two days later.
Description: “Down 3 Standard Deviations”
Provided by:
Trade Ideas (copyright © Trade Ideas LLC 2009). All rights reserved. For educational purposes only.
Remember these are sketches meant to give an idea how to model a trading plan. Trade-Ideas.com and
all individuals affiliated with this site assume no responsibilities for trading and investment results.
Type or copy/paste the following shortened string directly into a browser: https://bit.ly/aNoex (case-sensitive), then copy/paste the full-length link into Trade Ideas Pro using the “Collaborate” feature (right-click in any strategy window).
This strategy also appears on the Trade Ideas blog at https://marketmovers.blogspot.com/ or you can build the strategy from Figure 20, which shows the configuration of this strategy, where one alert and four filters are used with the following settings:
- Standard deviation breakdown alert (filter = 3)
- Min price = 10 ($)
- Max price = 100 ($)
- Max distance from inside market = 0.01 (%)
- Min daily volume = 50,000 (shares/day)
The definitions of these indicators appear here: https://www.trade-ideas.com/Help.html.
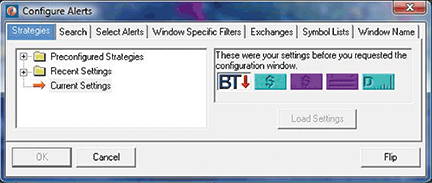
FIGURE 20: TRADE IDEAS, ALERTS CONFIGURATION
That’s the strategy, but what about the trading rules? How should the opportunities that the strategy finds be traded?
To recap briefly, The OddsMaker doesn’t just look at a basket of stocks a priori to generate backtest results. Rather, it considers any stock that matched a desired pattern in the market, finds that stock, and applies the backtest’s rule set before summing up the results into a detailed set of totals: win rate, average winner, average loser, net winnings, confidence factor.
In summary, this strategy trades the entire market session from open to close going long when triggered by the standard deviation alert. We evaluated several time frames, but were ultimately led to a hold time until the open two days after entering the trade with no specified stop-loss value. The average losing trade for this strategy was $0.72.
Here is what The OddsMaker tested for the past 15 days ended 10/06/2009 given the following trade rules:
- On each alert, buy the symbol (price moves up to be a successful trade)
- Schedule an exit for the stocks at the open two days after entry
- Trade the entire market session
- Consider exiting the trade (sell) if the price moves down $0.72.
The OddsMaker summary provides the evidence of how well this strategy and our trading rules did. The settings are shown in Figure 21.
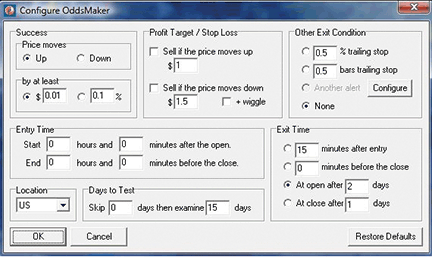
FIGURE 21: TRADE IDEAS, ODDSMAKER BACKTESTING CONFIGURATION
The results (last backtested for the 15-day period ended 10/6/2009) are shown in Figure 22. The summary reads as follows: This strategy generated 179 trades of which 123 were profitable for a win rate of 69%. The average winning trade generated $0.98 in profit and the average loser lost $0.72. The net winnings of using this strategy for 15 trading days generated $81.32 points. If you normally trade in 100-share lots, this strategy would have generated $8,132. The z-score or confidence factor that the next set of results will fall within this strategy’s average winner and loser is 100%.
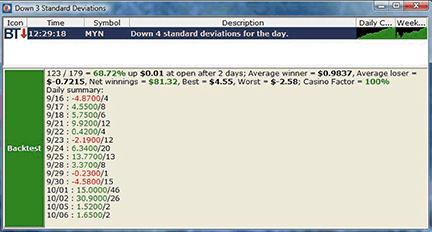
FIGURE 22: TRADE IDEAS, BACKTEST RESULTS
Learn about these backtest results from The OddsMaker in more detail by going to the online user’s manual at https://www.trade-ideas.com/OddsMaker/Help.html.
![]() AMIBROKER: THE DISPARITY INDEX (DIX) — VALCU ARTICLE CODE
AMIBROKER: THE DISPARITY INDEX (DIX) — VALCU ARTICLE CODE
Code from Dan Valcu’s article in this issue, “Making The Most Of A Trend With The Disparity Index.”
Dix scan applied to all Nasdaq 100 stocks on July 16, 2009. List is sorted on descending values of Dix(200), then Dix(50), and finally Dix(20).
// DIX-scan.afl - Disparity Index Scan in Amibroker 4.9
// Scan to list DIX(200), DIX(50) and DIX(20)
// ‘use filter’ = Nasdaq 100 stock universe
// ‘range’ = n last days with n=1
// Copyright 2009 Dan Valcu
Buy=1;
Filter = 1; /* all symbols and quotes accepted */
// Compute DIX(200)
nper1 = 200;
dix200=100*(C-EMA(C,nper1))/C;

// Compute DIX(50)
nper2 = 50;
dix50=100*(C-EMA(C,nper2))/C;

// Compute DIX(20)
nper3 = 20;
dix20=100*(C-EMA(C,nper3))/C;

Col2 = dix200;
Col3 = dix50;
Col4 = dix20;

SetOption(“NoDefaultColumns”, True );
AddTextColumn(Name(), “Ticker”, 5 , colorDefault, colorDefault);
AddColumn(Close,”Close”,1.2);
AddColumn(Col2,”DIX(200)”,1.2);
AddColumn(Col3,”DIX(50)”,1.2);
AddColumn(Col4,”DIX(20)”,1.2);
AddTextColumn(Name(), “Ticker”, 5 , colorDefault, colorDefault);
The disparity index is a simple and efficient oscillator indicator. It represents the percentage that the closing price deviates above or below from a chosen average. Its main purpose is capital preservation (reduced and controlled risk plus profits locked in).