TRADING TECHNIQUES
About Parameter-Sensitive Indicators
Signal Processing Basics
This is the first of a series of articles that examine stock price analysis using the mathematical methods of signal processing. These concepts will enable you to better understand popular indicators and incorporate them into your trading strategy.
The mathematical methods of communication and control theory are the basis for many common technical trading methods and indicators. This series of articles will focus on the mathematical basics needed to understand indicators and will not discuss trading strategies except to illustrate the use or misuse of indicators. Throughout this series, I will refer to stocks as the trading vehicle with the understanding that the mathematical principles explained here apply to any market.
This, the first article, presents a simple model to describe price action and one of its elements — cycles. Part 2 will discuss trends and smoothing methods. Part 3 will conclude the series with momentum, oscillators, and a brief discussion of the implications of the model. The math presented will be just detailed enough to give you an understanding of the concepts that can be further explored in the references provided.
Many trading strategies are based on the action and interaction of technical indicators. In evaluating these strategies, it is important to know whether the indicators are mathematically sound. The articles will provide the basis for that understanding and point out the limitations of this approach. The reader can then critically evaluate the theoretical basis of technical indicators for their own trading strategies.

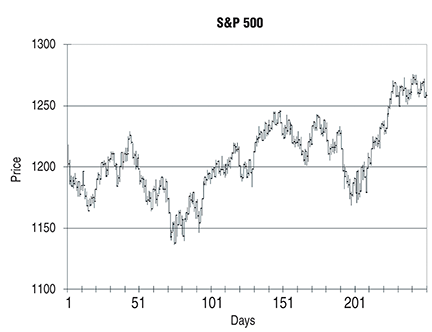
Figure 1: typical bar chart of stock prices. Using this price series, a mathematical model was built using the techniques of signal processing.
A stock pricing model
Figure 1 shows a typical bar chart of price versus time for a stock. I would like to build a mathematical model of this price series that lets me use the techniques of signal processing to understand the historical action shown in the chart and identify trading opportunities. The approach used in this article presents technical indicators as derived from a process as a deterministic signal. This is not the only approach that can be used — statistical time series analysis forecasting, pattern (feature) analysis, and artificial intelligence based methods are also used — but signal processing techniques are intuitive and have been used to develop many technical indicators and methods.
Use of a deterministic model is a simplification since statistical analysis of markets tells us that markets are stochastic (random) processes that must be dealt with probabilistically. I do not claim that the following model is an accurate description of the stock market. It is presented for exposition in describing the development of technical indicators through the use of traditional signal processing techniques.