INDICATORS
Explaining Trending Markets
Rsi Trends
What does the behavior of the relative strength index within a trend tell you about the strength of the trend?
While one common method uses divergence between the relative strength index (Rsi) and price, we can go beyond that and find out if a trend is likely to continue. We can do so by looking at certain Rsi levels contained in a trend; this provides us with valuable information for making trades within the current trend. Watching for breakouts of these Rsi levels can also provide us with confirmation for what is happening with price.
Support and resistance levels
Just as price will show respect for support and resistance levels, Rsi levels do as well. This can be an extremely valuable tool for confirming trends and possible reversals. In a bull market, the Rsi (in this case, I will use the 14-day) will often be seen moving between 30–40 lows and 80–90 highs. In a bear market, it will move between 20–30 and 60–70. These key levels seem to hold in all markets regardless of the time frame. Each market seems to find its own support or resistance within the levels outlined.
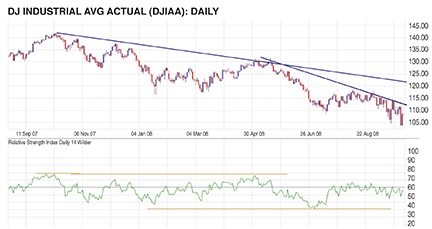
In Figure 1 we see the Dow Jones Industrial Average (Djia) in a downtrend. The Rsi at the bottom of the chart shows that the indicator only gets as high as 67 during the entire downtrend (the middle line marks the 50 level). The Rsi has respected that resistance level throughout its downtrend. Near the bottom of the Rsi, we see that the Rsi has bottomed around the 30 level with extreme lows at 22. This is valuable information, as these levels can provide us with confirmation that this trend will continue, or the level on the Rsi where it is likely to reverse.

Figure 1: will the trend continue? Here you see the DJIA in a downtrend. The RSI only gets as high as 67 during the entire downtrend. Near the bottom of the RSI, you can see that the RSI has bottomed around the 30 level with extreme lows at 22. These levels can indicate if the current trend will continue or the level on the RSI where it is likely to reverse.