TRADERS’ TIPS
April 2010
Here is this month’s selection of Traders’ Tips, contributed by various developers of technical analysis software to help readers more easily implement some of the strategies presented in this and other issues.
Other code appearing in articles in this issue is posted in the Subscriber Area of our website at https://technical.traders.com/sub/sublogin.asp. Login requires your last name and subscription number (from mailing label). Once logged in, scroll down to beneath the “Optimized trading systems” area until you see “Code from articles.” From there, code can be copied and pasted into the appropriate technical analysis program so that no retyping of code is required for subscribers.
You can copy these formulas and programs for easy use in your spreadsheet or analysis software. Simply “select” the desired text by highlighting as you would in any word processing program, then use your standard key command for copy or choose “copy” from the browser menu. The copied text can then be “pasted” into any open spreadsheet or other software by selecting an insertion point and executing a paste command. By toggling back and forth between an application window and the open web page, data can be transferred with ease.
This month’s tips include formulas and programs for:
- TRADESTATION: MODIFIED VOLUME-PRICE TREND INDICATOR
- eSIGNAL: MODIFIED VOLUME-PRICE TREND INDICATOR
- WEALTH-LAB: MODIFIED VOLUME-PRICE TREND INDICATOR
- AMIBROKER: MODIFIED VOLUME-PRICE TREND INDICATOR
- WORDEN BROTHERS STOCKFINDER: MODIFIED VOLUME-PRICE TREND INDICATOR
- TRADINGSOLUTIONS: MODIFIED VOLUME-PRICE TREND INDICATOR
- AIQ: MODIFIED VOLUME-PRICE TREND INDICATOR
- NEUROSHELL TRADER: MODIFIED VOLUME-PRICE TREND INDICATOR
- TRADERSSTUDIO: MODIFIED VOLUME-PRICE TREND INDICATOR
- TRADECISION: MODIFIED VOLUME-PRICE TREND INDICATOR
- NINJATRADER: MODIFIED VOLUME-PRICE TREND INDICATOR
- WAVE59: MODIFIED VOLUME-PRICE TREND INDICATOR
- UPDATA: MODIFIED VOLUME-PRICE TREND INDICATOR
- VT TRADER: VOLUME-PRICE TREND INDICATOR
- MICROSOFT EXCEL: MODIFIED VOLUME-PRICE TREND INDICATOR
- METASTOCK: MODIFIED VOLUME-PRICE TREND INDICATOR — HAWKINS ARTICLE CODE
![]() TRADESTATION: MODIFIED VOLUME-PRICE TREND INDICATOR
TRADESTATION: MODIFIED VOLUME-PRICE TREND INDICATOR
David Hawkins’ article in this issue, “Modified Volume-Price Trend Indicator,” suggests a modification to the on-balance volume indicator originally developed by Joseph Granville.
On-balance volume adds or subtracts each bar’s volume from a cumulative total based on the change in closing price from the preceding bar. Hawkins’ modified volume-price trend indicator uses a reduced volume term (rV) rather than volume. The rV value is equal to volume times the percentage change in the value ((Open + High + Low + Close) / 4). (Granville used bar closing prices.) Hawkins also suggests plotting prices on a logarithmic scale while plotting the indicator on a linear scale. If necessary, the alignment of chart and indicator can be adjusted using the inputs level and scale. The input level is added to a value that is equal to the input scale multiplied by the calculated Vpt value.
To download the adapted EasyLanguage code, go to the TradeStation and EasyLanguage Support Forum (https://www.tradestation.com/Discussions/forum.aspx?Forum_ID=213). Search for the file “Mvpt.eld.”
Indicator:  MVPT
inputs:
	Level( 0 ),
	Scale( 1 ) ,
	Price( AvgPrice ) ;

variables:
	rV( 0 ),
	MVPT( 0 ),
	AdjMVPT( 0 ) ;

if BarType >= 2 and BarType < 5 then
	rV = 0.00002 * Volume { Volume / 50000 }
else
	rV = 0.00002 * Ticks ; { Ticks / 50000 }

if Price[1] <> 0 then
	MVPT = MVPT + rV *( Price - Price[1] ) / Price[1] ;

AdjMVPT = Level + Scale * MVPT ;

Plot1( AdjMVPT, "AdjMVPT" ) ;
A sample chart is shown in Figure 1.
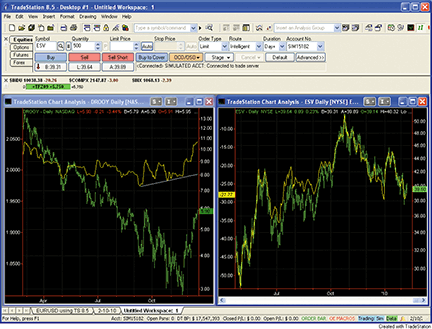
Figure 1: TRADESTATION, Modified Volume-Price Trend Indicator. Here are two charts with the MVPT indicator applied (yellow lines). The chart on the left shows the indicator applied to the South African gold-mining company DRD Gold Ltd. (DROOY). The chart on the right shows convergence between price and MVPT when price is plotted against a logarithmic scale (right scale) and the MVPT is plotted against a linear scale (left scale).
This article is for informational purposes. No type of trading or investment recommendation, advice, or strategy is being made, given, or in any manner provided by TradeStation Securities or its affiliates.
![]() eSIGNAL: MODIFIED VOLUME-PRICE TREND INDICATOR
eSIGNAL: MODIFIED VOLUME-PRICE TREND INDICATOR
For this month’s Traders’ Tip, we’ve provided the formula “Modified_VPT.efs” based on the formula code from David Hawkins’ article in this issue, “Modified Volume-Price Trend Indicator.”
The study contains the formula parameters level and scale to make minor adjustments for the indicator display, which may be configured through the Edit Studies window (Advanced Chart menu→Edit Studies). The study is a nonprice study by default so that it can be overlaid on the price chart to achieve the scaling effects described in the article. First, set the chart-scaling option (Advanced chart→Scaling menu) to log scale. Then hold down the shift key and click and drag the Vpt study over the price window and release. Next, go into Edit Studies, select the Vpt study from the study list on the left side of the dialog, and select the options for Display Left and Scale Left.
To discuss this study or download complete copies of the formula code, please visit the Efs Library Discussion Board forum under the Forums link from the Support menu at www.esignal.com, or visit our Efs KnowledgeBase at https://www.esignal.com/support/kb/efs/. The eSignal formula scripts (Efs) are also available for copying and pasting from the Stocks & Commodities website at Traders.com.
A sample chart is shown in Figure 2.
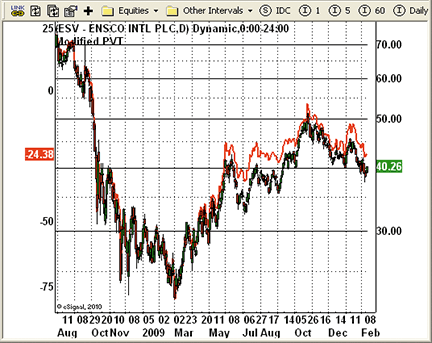
Figure 2: eSIGNAL, Modified Volume-Price Trend Indicator. Here is the VPT overlaid on a price chart.
/*********************************
Provided By:
eSignal (Copyright © eSignal), a division of Interactive Data Corporation.
2010. All rights reserved. This sample eSignal Formula Script (EFS) is for
educational purposes only and may be modified and saved under a new file name.
eSignal is not responsible for the functionality once modified. eSignal
reserves the right to modify and overwrite this EFS file with each new release.

Description:
    Modified Volume-Price Trend Indicator

Version:         1.00  02/09/2010

Formula Parameters:       Default:
    Level                               0
    Scale                               1

Notes:
The related article is copyrighted material. If you are not a subscriber
of Technical Analysis of Stocks & Commodities magazine, please visit www.traders.com.

**********************************/
var fpArray = new Array();
var bInit = false;
var bVersion = null;

function preMain() {
    setPriceStudy(false);
    setShowCursorLabel(true);
    setShowTitleParameters(false);
    setStudyTitle("Modified VPT");
    setCursorLabelName("MVPT", 0);
    setDefaultBarFgColor(Color.red, 0);
    setPlotType(PLOTTYPE_LINE, 0);
    setDefaultBarThickness(2, 0);
    var x=0;
    fpArray[x] = new FunctionParameter("Level", FunctionParameter.NUMBER);
	with(fpArray[x++]){
        setName("Level");
        setLowerLimit(-1000);
        setUpperLimit(10000);
        setDefault(0);
    }
    fpArray[x] = new FunctionParameter("Scale", FunctionParameter.NUMBER);
	with(fpArray[x++]){
        setName("Scale");
        setLowerLimit(0.0001);
        setUpperLimit(100000);
        setDefault(1);
    }
}

var xMVPT = null;

function main(Level, Scale) {
var nBarState = getBarState();
var nMVPT = 0;
    if (bVersion == null) bVersion = verify();
    if (bVersion == false) return;
    if (nBarState == BARSTATE_ALLBARS) {
        if (Level == null) Level = 0;
        if (Scale == null) Scale = 1;
    }
    if (!bInit) {
        xMVPT = efsInternal("Calc_MVPT", Level, Scale);
        bInit = true;
    }
    nMVPT = xMVPT.getValue(0);
    if (nMVPT == null) return;
    return nMVPT;
}

var bSecondInit = false;
var xCumVPT = 0;

function Calc_MVPT(Level, Scale) {
var nRes = 0;
var nCumVPT = 0;
    if (!bSecondInit) {
        xCumVPT = efsInternal("Calc_CumVPT");
        bSecondInit = true;
    }
    nCumVPT = xCumVPT.getValue(0);
    if (nCumVPT == null) return;
    nRes = Level + Scale * nCumVPT;
    return nRes;
}

var bThirdInit = false;
var xOHLC4 = null;
var xV = null;

function Calc_CumVPT() {
var nRes = 0;
var nRef = 0;
var nOHLC4 = 0;
var nOHLC4_1 = 0;
var rV = 0;
    if (!bThirdInit) {
        xOHLC4 = ohlc4();
        xV = volume();
        X = obv();
        bThirdInit = true;
    }
    nOHLC4 = xOHLC4.getValue(0);
    nOHLC4_1 = xOHLC4.getValue(-1);
    nRef = ref(-1);
    if (nOHLC4_1 == null) return;
    rV = xV.getValue(0) / 50000;
    nRes = nRef + (rV * (nOHLC4 - nOHLC4_1) / nOHLC4_1);
    return nRes;
}

function verify() {
    var b = false;
    if (getBuildNumber() < 779) {
        drawTextAbsolute(5, 35, "This study requires version 8.0 or later.",
            Color.white, Color.blue, Text.RELATIVETOBOTTOM|Text.RELATIVETOLEFT|Text.BOLD|Text.LEFT,
            null, 13, "error");
        drawTextAbsolute(5, 20, "Click HERE to upgrade.@URL=https://www.esignal.com/download/default.asp",
            Color.white, Color.blue, Text.RELATIVETOBOTTOM|Text.RELATIVETOLEFT|Text.BOLD|Text.LEFT,
            null, 13, "upgrade");
        return b;
    } else {
        b = true;
    }
    return b;
}
![]() WEALTH-LAB: MODIFIED VOLUME-PRICE TREND INDICATOR
WEALTH-LAB: MODIFIED VOLUME-PRICE TREND INDICATOR
In the article “Modified Volume-Price Trend Indicator” in this issue, author David Hawkins discusses a modification of the volume-price trend indicator (Vpt).
Overlaying Mvpt properly in the PricePane is a big challenge if the user must manually adjust both the level and scaling factors. Changing the scale affects the level, and conversely, changing the level affects the scale. For this reason, our Wealth-Lab script creates the Mvpt only for the data displayed in the chart (skipping the data “off-the-chart”), thereby allowing it to automatically adjust the Mvpt level factor to the average price of the left-most bar. This leaves the analyst with only the simple task of adjusting the scaling parameter for a visually pleasing presentation.
As seen in Figure 3, we’re able to automatically detect divergences, although that part of the code is not given here in the interest of space and clarity.
WealthScript Code (C#):

using System;
using System.Collections.Generic;
using System.Text;
using System.Drawing;
using WealthLab;
using WealthLab.Indicators;
using WealthLab.ChartStyles;    /* Note */

namespace WealthLab.Strategies
{
   public class MyStrategy : WealthScript
   {
      StrategyParameter _scale;
      StrategyParameter _level;
      StrategyParameter _pctRev;

      public MyStrategy()
      {
         _scale = CreateParameter("Scale", 1, 1, 10000, 1);
         _level = CreateParameter("Level (disabled)", 0, 0, 10000, 100);
         _pctRev = CreateParameter("Reverse %", 10, 1, 25, 1);
      }

      protected override void Execute()
      {
         double rev = _pctRev.Value;
         BarChartStyle bcs = null;
         try {
            bcs = (BarChartStyle)ChartStyle;
         }
         catch {
            DrawLabel(PricePane, "Please switch to Bar (OHLC) Chart Style", Color.Red);
            return;
         }
         int b = bcs.LeftEdgeBar;

         DataSeries mvpt = new DataSeries(Bars, "Modified VPT");
         DataSeries avg4 = (Open + High + Low + Close) / 4d;
         _level.Value = avg4[b];

         DataSeries avg4_1 = avg4 >> 1;
         DataSeries change = (avg4 - avg4_1) / avg4_1;
                 // change *= (Volume / 50000d);
         // Compensate a little for diverse ranges of Volume
         change *= ( Volume / Math.Pow(10, Math.Log10(SMA.Value(Bars.Count - 1, Volume, 50))) );

         for (int bar = b; bar < Bars.Count; bar++)
         {
            mvpt[bar] = ( mvpt[bar - 1] + change[bar] );
         }    vp
         mvpt *= _scale.Value;
         mvpt += _level.Value;

         PlotSeries(PricePane, mvpt, Color.Teal, LineStyle.Solid, 2);
      }
   }
}
A sample chart is shown in Figure 3.
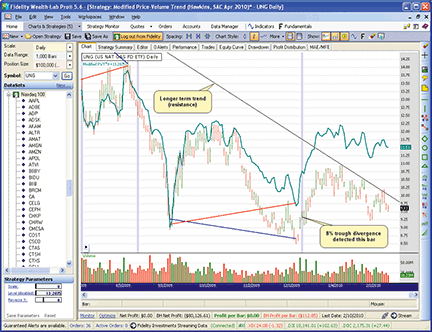
Figure 3: WEALTH-LAB, Modified Volume-Price Trend Indicator. A recent example of MVPT/price divergence can be found in the natural gas ETF, UNG, which has potentially formed a double bottom. A strong break above the trendline resistance could very well signal the start of a larger move higher.
![]() AMIBROKER: MODIFIED VOLUME-PRICE TREND INDICATOR
AMIBROKER: MODIFIED VOLUME-PRICE TREND INDICATOR
In “Modified Volume-Price Trend Indicator” in this issue, author David Hawkins presents his ideas about using the modified volume-price trend (Mvpt) indicator to discern what the “smart money” is doing in a stock.
A ready-to-use formula for the Mvpt is presented here. To use it, enter the formula in the Afl Editor, then press the “insert indicator” button. Click on the chart with the right–mouse button and choose “parameters” from the context menu to select manual or automatic scaling mode.
MVPT CODE FOR AMIBROKER
Version( 5.25 );
Level = Param("Level", 0, -100, 100 );
Scale = Param("Scale", 1, 0.1, 10, 0.1 );

AutoScale = ParamToggle("AutoScale", "No|Yes", 1 );

rV = V/50000;
AvgFour = ( O + H + L + C )/4;

MVPT = Cum( rV * (AvgFour - Ref( AvgFour, -1 ) )/Ref( AvgFour, -1 ) );

Plot( C, "Price", colorBlack, styleBar );

if( AutoScale )
{
 fvb = Status("firstvisiblebar");
 rangePrice = HighestVisibleValue( H ) - LowestVisibleValue( L );
 rangeMVPT = HighestVisibleValue( MVPT ) - LowestVisibleValue( MVPT );
 Scale = rangePrice / rangeMVPT;
 MVPT *= Scale;
 Level = AvgFour[ fvb ] - MVPT[ fvb ];
}
else
{
 MVPT *= Scale;
}

MVPT = MVPT + Level;

Plot( MVPT, "MVPT" + StrFormat("(Scale=%g, Level=%g)", Scale, Level), colorRed, styleThick );
A sample chart is shown in Figure 4.
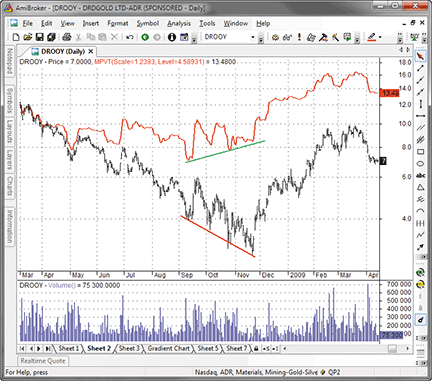
Figure 4: AMIBROKER, Modified Volume-Price Trend Indicator VS. PRICE. The MVPT showed a significant upward divergence, foretelling the major new uptrend.
![]() WORDEN BROTHERS STOCKFINDER: MODIFIED VOLUME-PRICE TREND INDICATOR
WORDEN BROTHERS STOCKFINDER: MODIFIED VOLUME-PRICE TREND INDICATOR
The modified volume-price trend (Mvpt) indicator from David Hawkins’ article in this issue is available in the StockFinder indicator library. You can add the indicator to your chart by clicking the “Add Indicator/Condition” button or by simply typing “/VPT” and choosing “volume-price trend” from the list of available indicators.
By default, Vpt is calculated using closing prices and volume. Hawkins’ modified version uses typical price and volume. If you right-click on the Vpt indicator and select Edit, you can change the “calculate using” setting from “close” to “typical price.” If you want to plot as an overlay on price as illustrated in the article, just click on the Vpt and drag it to the price window. When prompted, choose “overlay” (Figure 5).
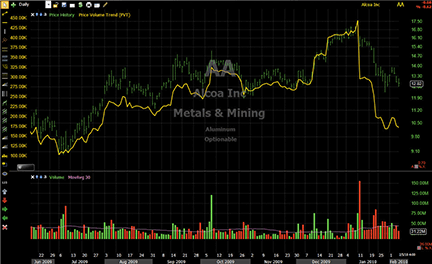
Figure 5: STOCKFINDER, Modified Volume-Price Trend Indicator. The modified VPT indicator is overlaid on the price graph. The scaling for VPT has been edited to put the scaling values on the left side of the price chart.
To download the StockFinder software and get a free trial, go to www.StockFinder.com.
![]() TRADINGSOLUTIONS: MODIFIED VOLUME-PRICE TREND INDICATOR
TRADINGSOLUTIONS: MODIFIED VOLUME-PRICE TREND INDICATOR
In “Modified Volume-Price Trend Indicator” in this issue, author David Hawkins presents some modifications to the classic volume-price trend indicator (Vpt).
The TradingSolutions function presented here is also available as a function file that can be downloaded from the TradingSolutions website (www.tradingsolutions.com) in the Free Systems section.
Function Name: Modified Price and Volume Trend Indicator
Short Name: MVPT
Inputs: Open, High, Low, Close, Volume
VPT (Div (Add (Add (Open, High), Add (Low, Close)), 4), Volume)
![]() AIQ: MODIFIED VOLUME-PRICE TREND INDICATOR
AIQ: MODIFIED VOLUME-PRICE TREND INDICATOR
The Aiq code is given here for the indicators described in David Hawkins’ article in this issue, “Modified Volume-Price Trend Indicator.”
Hawkins’ article discusses three volume-price type indicators: the on-balance volume indicator, the volume-price trend indicator, and the modified volume-price indicator. All three indicators are provided in Aiq code and these can be plotted either as single-line indicators on the chart or as separate indicators as shown in Figure 6 on the recent chart of Apple. Should you want to plot the indicators on the chart, you can adjust the scale by using the “level” and “scale” inputs that are available for each indicator. The Aiq charts can display in either linear scale or semilog scale, but we cannot show the indicator in linear scale and the price in semilog scale at the same time.
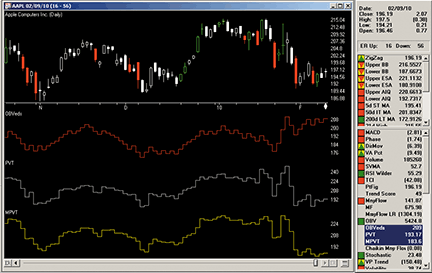
Figure 6: AIQ SYSTEMS, OBV, VPT, AND MVPT. Here is a sample chart of Apple with the on-balance volume, volume-price, and modified volume-price indicators.
The code can be downloaded from the Aiq website at www.aiqsystems.com and also from www.tradersedgesystems.com/traderstips.htm.
! Modified Volume-Price TREND INDICATOR
! ON BALANCE VOLUME INDICATOR
! PRICE-VOLUME TREND INDICATOR
! Author: David G. Hawkins, TASC April 2010
! Coded by: Richard Denning 2/7/10
! www.tradersEdgeSystems.com

! Add OBV, VPT, MVPT as three separate single line
!    indicators to charts
! To speed up the calculation of the indicators, set the
!    startMo, startDa, startYr to the smallest value
!    that is needed for the application - currently it is
!    set to about two years back from 3/1/2010

!-----------INPUTS---------------
obvLevel  is   50.
obvScale  is    1.
vptLevel  is   30.
vptScale  is  100.
mvptLevel is  260.
mvptScale is  100.
startMo	  is   03.
startDa	  is   01.
startYr	  is 2008.
!-------------------------------------

C	is [close].
C1	is val([close],1).
O	is [open].
H	is [high].
L 	is [low].
start	is offSetToDate(startMo,startDa,startYr).
sDate	is makeDate(startMo,startDa,startYr).

!ON BALANCE VOLUME (OBV) INDICATOR
HD	is hasdatafor(start).
DaySum	is HD.
F 	is iff(C > C1,1,iff(C < C1,-1,0)).
VolSum1 is Sum([volume] / 50000 * F, DaySum).
VolSum2 is obvLevel + obvScale * VolSum1.
OBV is iff(sDate >= ReportDate(),obvLevel,VolSum2). !PLOT

!VOLUME PRICE TREND INDICATOR
F2 	is C / C1 - 1.
VolSum3 is Sum([volume] / 50000 * F2, DaySum).
VolSum4 is vptLevel + vptScale * VolSum3.
VPT is iff(sDate >= Reportdate(),vptLevel,VolSum4). !PLOT

!VOLUME PRICE TREND & TYP PRICE
TP	is (O + H + L +C) / 4.
F3	is TP / valresult(TP,1) - 1.
VolSum5 is sum([volume] / 50000 * F3, DaySum) .
VolSum6 is mvptLevel + mvptScale*VolSum5.
MVPT is iff(sDate>=Reportdate(),mvptLevel,VolSum6). !PLOT

List 	if C > 0.
![]() NEUROSHELL TRADER: MODIFIED VOLUME-PRICE TREND INDICATOR
NEUROSHELL TRADER: MODIFIED VOLUME-PRICE TREND INDICATOR
The on-balance volume, volume-price trend, and modified volume-price trend indicators described in David Hawkins’ article in this issue (“Modified Volume-Price Trend Indicator”) can all be easily implemented in NeuroShell Trader by combining a few of NeuroShell Trader’s 800+ indicators. To create the indicators, select “New Indicator…” from the Insert menu and use the Indicator Wizard to create the following indicators:
On-Balance Volume Indicator:
CumSum( OBV( Close, Volume, 1 ), 0 )

Price-Volume Trend:
CumSum( Mul2( Volume, Subtract( ROC( Close, 1 ) , 1 ) ), 0 )

Modified Volume-Price Trend:
Add2( Level, Mul2( Scale, CumSum( Mul2( Volume, Subtract( ROC( Avg4( Open, High, Low, Close ), 1 ) , 1 ) ), 0 ) ) )
Since the NeuroShell Trader program was designed as a tool to produce analytic, automatic trading signals, it was not enough for us to suggest that users do visual analysis. Therefore, we apply the power function to the Mvpt indicator so that this indicator and the close cannot only be plotted in the same scale for visual analysis, but also so users can compute meaningful spreads to use in rules and neural networks.
A sample chart is shown in Figure 7.
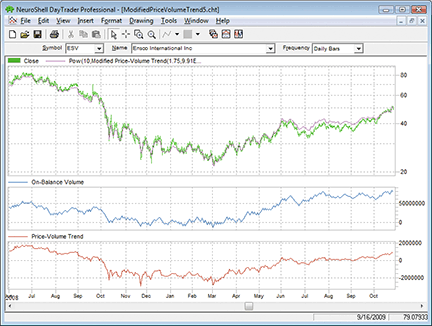
Figure 7: NEUROSHELL TRADER, OBV, VPT, AND MVPT. Here is an example of the modified volume-price trend, on-balance volume, and volume-price trend on a chart in NeuroShell Trader.
![]() TRADERSSTUDIO: MODIFIED VOLUME-PRICE TREND INDICATOR
TRADERSSTUDIO: MODIFIED VOLUME-PRICE TREND INDICATOR
The TradersStudio code for David Hawkins’ indicators from his article in this issue, “Modified Volume-Price Trend Indicator,” is shown here. I have supplied the code for all three indicators discussed in the article as well as the code for a simple system that I chose to test the indicator with.
The test system makes countertrend trades and uses the volume-price indicators in divergence mode to filter out some of the trades. The basic idea is to make countertrend trades based on two moving averages. We buy when the fast average crosses below the slower moving average and sell on the opposite cross. Time and maximum-dollar loss-stops are also used.
Back-adjusted data (day session only) from Pinnacle Data was used for the following symbols: AD, BO, BP, C, CC, CD, CL, CT, DJ, DX, ED, FA, FC, FX, GC, HG, HO, HU, JO, JY, KC, KW, LC, LH, NG, NK, PB, RB, S, SB, SF, SI, SM, SP, TA, TD, UA, and W over the test period from January 2, 1999, to February 8, 2010.
In Figure 8, I show the optimization results comparing average system results when:
- Not using a money flow filter (first line of table)
- Using an on-balance volume filter (second line of table)
- Using the volume-price filter (third line of table)
- Using the modified volume-price filter (fourth line of table).
Each line represents an average of a range of parameters for the system rather than just the best set of parameters. All of the metrics improve as we move from the unfiltered system to the best of the batch, the Mvpt filtered system.

Figure 8: TRADERSSTUDIO, TEST SYSTEM RESULTS. Here is a comparison of average system test results for a portfolio of 38 futures contracts over the period 1/2/1999 to 2/8/2010. The system results were solidly improved by adding the modified volume-price indicator as a filter in the system.
I also used the TradersStudio genetic optimizer to optimize all seven parameters of the system. The set chosen by the genetic optimizer was one that uses the modified volume-price filter.
The code can be downloaded from the TradersStudio website at www.TradersStudio.com and also from www.TradersEdgeSystems.com/traderstips.htm.
![]() TRADECISION: MODIFIED VOLUME-PRICE TREND INDICATOR
TRADECISION: MODIFIED VOLUME-PRICE TREND INDICATOR
In “Modified Volume-Price Trend Indicator” in this issue, author David Hawkins demonstrates using the modified volume-price trend indicator to detect divergences between price and the indicator and to predict new trend directions.
Using Tradecision’s Indicator Builder, use the following code to recreate the Mvpt indicator:
MVPT indicator
input
      Level:"Level",0,-1000,10000;
      Scale:"Scale",1,0.00001,100000;
end_in

var
 rV:=V/50000;
 AvgFour:=(O+H+L+C)/4;
 MVPT:=0;
end_var

if HISTORYSIZE < 1 then return 0;
MVPT:= Level + Scale * Cum( rV * (AvgFour - AvgFour\1\)/AvgFour\1\);
return MVPT;
To import the strategy into Tradecision, visit the area “Traders’ Tips from Tasc Magazine” at www.tradecision.com/support/tasc_tips/tasc_traders_tips.htm or copy the code from the Stocks & Commodities website at www.traders.com.
A sample chart is shown in Figure 9.
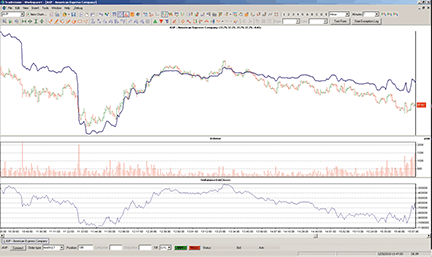
FIGURE 9: TRADECISION, MVPT VS. PRICE. The modified volume-price trend (MVPT) indicator is overlaid on an AXP chart on a log scale. Even though the highs and lows are matched, the curves are quite far apart.
![]() NINJATRADER: MODIFIED VOLUME-PRICE TREND INDICATOR
NINJATRADER: MODIFIED VOLUME-PRICE TREND INDICATOR
The modified volume-price trend (Mvpt) indicator discussed by David Hawkins in his article in this issue, “Modified Volume-Price Trend Indicator,” has been implemented as an indicator available for download at www.ninjatrader.com/SC/April2010SC.zip.
Once you have downloaded the indicator, from within the NinjaTrader Control Center window, select the menu File→Utilities→Import NinjaScript and select the downloaded file. This indicator is for NinjaTrader version 6.5 or greater.
You can review the indicator’s source code by selecting the menu Tools→Edit NinjaScript→Indicator from within the NinjaTrader Control Center window and selecting “Mvpt.”
NinjaScript indicators are compiled Dlls that run native, not interpreted, which provides you with the highest performance possible.
A sample chart implementing the strategy is shown in Figure 10.
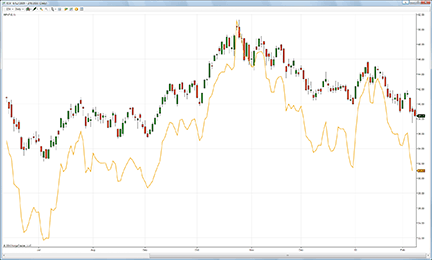
Figure 10: NINJATRADER, Modified Volume-Price Trend Indicator. This screenshot shows the MVPT indicator applied to a daily chart of ESV.
![]() WAVE59: MODIFIED VOLUME-PRICE TREND INDICATOR
WAVE59: MODIFIED VOLUME-PRICE TREND INDICATOR
In “Modified Volume-Price Trend Indicator” in this issue, David Hawkins describes a way to get insight into what large players are doing in the market by watching for accumulation and distribution by measuring the relationship between price and volume.
Rather than look at stocks, we decided to put Hawkins’ tools on a weekly chart of the Dow Jones Industrial Average (Djia) futures, as shown in Figure 11. Note the major (and very clear) divergence signal at the 2007 highs before the market lost more than half its value over the next year.
The following script implements this indicator in Wave59. As always, users of Wave59 can download these scripts directly using the QScript Library found at https://www.wave59.com/library.
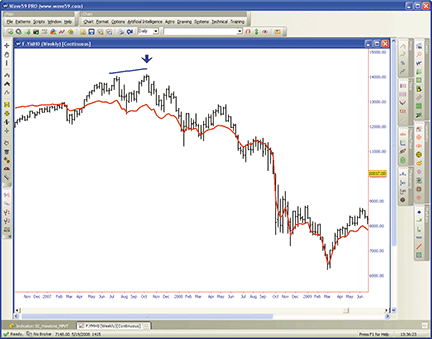
FIGURE 11: WAVE59, Modified Volume-Price Trend Indicator
Indicator: Hawkins_MVPT
#This is David Hawkins MVPT Indicator from the April 2010
#issue of Technical Analysis of Stocks & Commodities

input: color(red), thickness(1);

if (barnum == barsback) {
    mvpt = 0;
    level = 0;
    scale = 1;
}

Rv = volume / 50000;
Avgfour = (o + h + l + c) / 4;

if (avgfour[1]>0) {
    mvpt += rv * (avgfour - avgfour[1]) / avgfour[1];
    plot1 = level + scale * mvpt;
    color1 = color;
    thickness1 = thickness;
}

--------------------------------------------
![]() UPDATA: MODIFIED VOLUME-PRICE TREND INDICATOR
UPDATA: MODIFIED VOLUME-PRICE TREND INDICATOR
This tip is based on David Hawkins’ article in this issue, “Modified Volume-Price Trend Indicator.”
Hawkins adds to the on-balance volume (Obv) and volume-price trend (Vpt) theme of indicators by substituting the typical price, (O+H+L+C)/4, for the closing price in the Vpt formula. Hawkins proposes that this better captures accumulation/distribution in the market, thus giving clearer price/indicator divergences. The level and scale parameters in the article can be omitted in Updata code, as all charts and overlays can be manipulated in real time.
The Updata code for Hawkins’ indicator can be found in the Updata Indicator Library and may be downloaded by clicking the Custom menu and then Indicator Library. Those who cannot access the library due to firewall issues may paste the following code into the Updata Custom editor and save it.
NAME Modified Volume Price Trend
DISPLAYSTYLE LINE
INDICATORTYPE CHART
COLOUR RGB(0,0,255)

@RV=0
@AVGFOUR=0
@MVPT=0

FOR #CURDATE=0 TO #LASTDATE

    IF #CURDATE>1

       @RV=VOL/50000
       @AVGFOUR=(OPEN+HIGH+LOW+CLOSE)/4
       @MVPT=@MVPT+((@AVGFOUR-HIST(@AVGFOUR,1))/HIST(@AVGFOUR,1))*@RV
       @PLOT=@MVPT

    ENDIF

NEXT
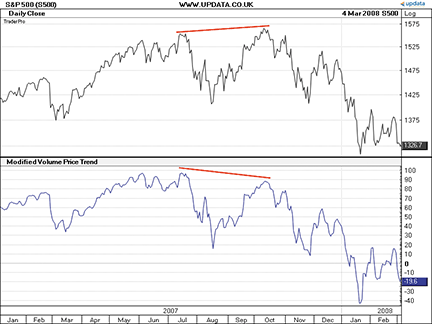
FIGURE 12: UPDATA, Modified Volume-Price Trend Indicator. This chart shows the price/indicator divergence in the S&P 500 in 2007, a precursor to the selloff that occurred.
A sample chart is shown in Figure 12.
![]() VT TRADER: VOLUME-PRICE TREND INDICATOR
VT TRADER: VOLUME-PRICE TREND INDICATOR
- Click the Ribbon→Technical Analysis menu→Indicators group→Indicator Builder command→Indicator Builder window’s [New] button
- In the General tab, type the following text for each field:
Name: Price Volume Trend
Function Name Alias: vt_PVT
Label Mask: Price Volume Trend (%Pr%,%LBP%) = %_PVT%
Placement: New Frame
Data Inspection Alias: Price Volume Trend
- In the Input Variable(s) tab, create the following variables:
[New] button…
Name: Pr
Display Name: Price
Type: price
Default: close

[New] button…
Name: LBP
Display Name: LookBack Periods
Type: integer
Default: 1
- In the Output Variable(s) tab, create the following variables:
[New] button…
Var Name: _PVT
Name: (PVT)
Line Color: purple
Line Width: slightly thicker
Line Type: solid
- In the Horizontal Line tab, create the following lines:
[New] button…
Value: +0.0000
Color: black
Width: thin
Type: dashed
- In the Formula tab, copy and paste the following formula:
_VT:= ((Pr - ref(Pr,-LBP))/ref(Pr,-LBP)) * V) + PREV(0);
_PVT:= cum(_VT);
- Click the “Save” icon to finish building the volume-price trend indicator.
To attach the indicator to a chart (Figure 13), click the right mouse button within the chart window and then select “Add Indicator” → “Price Volume Trend” from the indicator list.
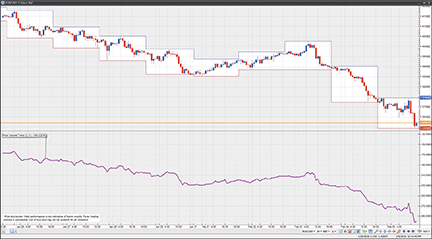
Figure 13: VT TRADER, TRADITIONAL PRICE-VOLUME Trend Indicator. Here is an example of the price-volume trend indicator on a EUR/USD one-hour candlestick chart.
To learn more about VT Trader, visit www.cmsfx.com.
Risk disclaimer: Forex trading involves a substantial risk of loss and may not be suitable for all investors.
![]() MICROSOFT EXCEL: MODIFIED VOLUME-PRICE TREND INDICATOR
MICROSOFT EXCEL: MODIFIED VOLUME-PRICE TREND INDICATOR
Here is an implemention of David Hawkins’ indicator in Excel. The indicator is based on Hawkins’ article in this issue, “Modified Volume-Price Trend Indicator.”
Start by placing your data in the spreadsheet: open, high, low and close are in columns B, C, D, and E respectively. Volume is in column F (Figure 14).
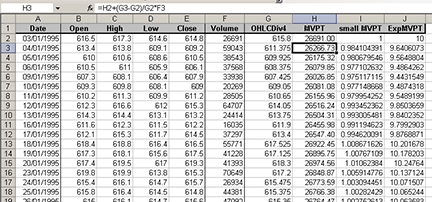
FIGURE 14: CALCULATING THE MODIFIED VOLUME-PRICE TREND INDICATOR USING AN EXCEL SPREADSHEET
The first calculation is for the typical price: (O+H+L+C)/4. It starts in cell G2:
=(B2+C2+D2+E2)/4
The Mvpt formula relies on the previous day’s Mvpt value. It must therefore be primed: the first Mvpt value is set to that day’s volume. In cell H2:
=F2
The formula can then be applied starting in cell H3:
=H2+(G3-G2)/G2*F3
The last step is the plotting of prices on a logarithmic scale, with an overlay of the Mvpt on a linear scale. Excel can handle logarithmic plotting but does not allow for flexible values of the axis scale (minimums and maximums must be a power of 10). This would prevent the adjustment of the level and scale of the Mvpt plot to coincide with the price plot, as recommended by the authors.
Instead of a logarithmic plotting, data can be transformed in the spreadsheet. This could be done by calculating the log of prices. However, this transformation would lose the actual price values information. It is preferable to apply the inverse function for Log to the Mvpt. The inverse for Log is the exponent of base 10 (we would calculate 10∧Mvpt). As Excel cannot handle values greater than 10∧308, we need to apply a scaling-down transformation to the Mvpt by dividing its values by a common number. Divide all Mvpt values by the first Mvpt value starting in cell M2:
=H2/H$2
Apply the exponential transformation to the “small” Mvpt starting in cell N2:
=10∧M2
The data is now ready for plotting. The chart is slightly complex to draw; follow these steps:
- Select columns A to E (including the headers) and generate a chart of type “Stock.”
- Select column A (still including the header), hold down the “Ctrl” key and select column N (ExpMVPT); copy the selection.
- Select the chart, activate the “Edit” menu and select “Paste Special.” Click OK (options should be: “Add cells as new series” with “Values in Columns”). See Figure 15.
- Bring up the “Chart” toolbar (Menu: View/Toolbar/Chart).
- Select ‘Series “ExpMVPT”’ in the drop-down list of the Chart toolbar.
- Right-click on the data series and choose “Format Data Series…”
- Update the “Patterns” tab to display a line with no marker, and update the Axis tab to “Plot series on secondary axis.”
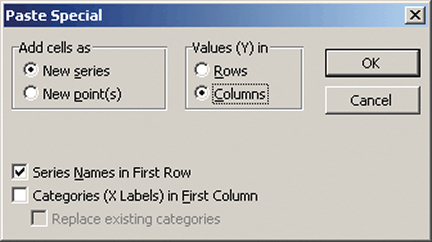
FIGURE 15: PASTE SPECIAL SCREEN
This produces a price and Mvpt chart with automatically adjusted scales as seen in Figure 16.
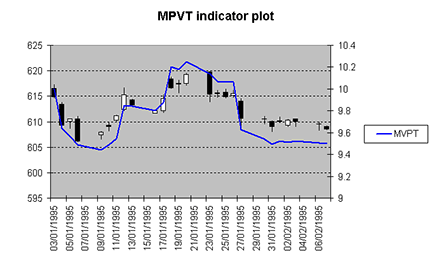
FIGURE 16: PRICE PLOT WITH MVPT OVERLAY
![]() METASTOCK: MODIFIED VOLUME-PRICE TREND INDICATOR
METASTOCK: MODIFIED VOLUME-PRICE TREND INDICATOR
— HAWKINS ARTICLE CODE
METASTOCK CODE FOR MVPT INDICATOR
Level:=Input("Level",-1000,10000,0);
Scale:=Input("Scale",.00001,100000,1);
rV:=V/50000;
AvgFour:=(O+H+L+C)/4;

Level+Scale*Cum(rV*(AvgFour-Ref(AvgFour,-1))/Ref(AvgFour,-1))