AT THE CLOSE
The Schaff Trend Cycle
This indicator can be used with great reliability to catch moves in the currency markets.
Doug Schaff, president and founder of FX Strategy, created the Schaff trend cycle indicator in the 1990s. It is the product of more than 20 years of experience in technical analysis, trading the markets with an expertise in currencies and a masterful understanding of technical analysis and price functions in the markets. Who better to give this generation of traders an interesting, comprehensive, accurate, and brilliant indicator? Schaff divulged the details of his indicator back in 2008, so the public is only now becoming familiar with its functions and uses. In my limited time using this indicator, I’ve found it to be hugely intriguing, a fascination I hope to impart to other traders.
Fascination
What makes this indicator interesting is that it is a combination of moving average convergence/divergence (Macd) and fast stochastics with a cycle component and a smoother to capture market prices more comprehensively. It is a combination of leading and lagging indicators. The Macd is considered to be a leading indicator because it serves as an early warning to where prices will go. It follows prices with its 12- and 26-period exponential moving average (Ema) components and nine-day Ema signal line. In this capacity, it is a trend indicator. Yet it is a lagging indicator because it doesn’t always lead prices, is prone to false signals especially in fast-moving markets such as currencies, and also prone to whipsaw price action. So you have to adjust the settings to satisfy your price and market objectives.
Stochastic indicator
As a lagging indicator, fast stochastics is incorporated by a 14-period %K line and %D signal line. The %K line set at 14 periods calculates the last close by its highest high over 14 days and lowest low over 14 days. This determines the percentile of the last close. The %D line is the signal line composed of a three-day simple moving average and ratio of the %K line. The problem with fast stochastics is its ability to generate false signals, while markets can take off before signals are generated.
Part of the problem with George Lane’s stochastic is its concentration on the three-day simple moving average as the signal line. False signals and slow reactions are just the beginning of problems, especially for short-term and daytraders because the three-day simple moving average is too short a term to represent fast markets and act as a true trigger line. The %D is supposed to serve as a smoother to %K but fails in its objectives unless the periods are adjusted to the particular market. Yet 1950s indicators only focused on simple moving averages and closing prices because the study of Emas hadn’t fully begun yet.
The MACD
But more modern indicators incorporated Emas because the focus gave credence and relevance to recent prices and percentages rather than closing prices incorporated in the simple moving average. It was a historic breakthrough. Yet problems existed with its incorporation because Ema, when established in an indicator, had time frame periods that were too short to be effective other than for quick and short-term moves rather than long-term gains. The Macd with its 12- and 26-period Ema and nine-period signal line needed adjustment upward to be effective. The 12- and 26-period Emas are barely 10- and 20-day simple moving averages, and the nine-period signal line falls short as a true signal in this capacity. More losses were generated before gains were realized due to Ema failures.
Schaff trend cycle
The Schaff trend cycle (Stc) indicator remedied these problems by incorporating a shorter-term Ema set with a default at 23 with a longer-term Ema with a default at 50. This remedies the Macd and fast stochastic false signal and price whipsaw failure and the key to the success of the Stc indicator.
This combination alone can be employed effectively to capture trends, but it doesn’t incorporate entries and exits fully. To fix this, a signal was needed. The Macd’s nine-day exponential signal line was not always effective, while fast stochastic %D signal line was also a failure in the intended three-period moving average setting. You need a true signal that would capture a true trend.
This came from cycle theory, a theory never fully incorporated into an indicator. This signal line was derived from theories and practices of 10-, 20-, and 40-day currency cycles. The halfway point between the 23- and 50-day Ema is, in cycle theory, 10 so the cycle default is set as a standard 10. But this cycle determinant can be viewed as a halfway point of a 20-day cycle as well. This is the signal line that denotes trends, ranges, or congestion. It is the line that moves effectively with prices and candles, a true leading trend indicator that doesn’t appear to fail when it oscillates from tops to bottoms, overbought and oversold.
To measure the vagaries of cycles, the Ema and the stochastic has been one of the most popular measures over many years because they oscillate for stochastics to follow cycles and measure trends by Emas. Why Emas? Because they apply a smoothing constant in the formula that applies appropriate weighting to the most recent price: a smoothing constant = 2/(1+ number of periods for Ema). A 10-period Ema smoothing constant would be 0.1818 (2/number of time periods + 1). This weighs the most recent price 18.18%, while a 20-period Emaß weighs most recent price 9.52%.
EMA calculation:
Current EMA = Smoothing constant * (Current price -
previous EMA) + previous EMA
If the current price is higher than the previous Ema, the difference will be positive (Current price - previous Ema). The positive difference is weighted by multiplying by the constant ((Current price - previous Ema) x smoothing constant). The answer is added to the previous Ema and if the current price is lower than the previous Ema, the difference will be negative (Current price - previous Ema). The negative difference is weighted by multiplying it by the constant (Current price - previous Ema) x smoothing constant. The final number is added to the previous period’s Ema. The new Ema will be lower. I am measuring lengths with Emas since cycle lengths must be measured.
This is important because full cycles are always accompanied by half cycles. For example, a bottom to top or top to bottom is a half cycle. This may represent consolidation into a new trend or represent a market top and reversal. This would depend on the cycle period. The important measurement is time, as market cycle highs and lows must mark time.
Currency cycles generally come in 10-, 20-, and 40-day cycles. A 16- to 23-day period from cycle low to cycle low is considered a 20-day cycle. Yet 20-day cycles can easily become 40-day cycles. These are measured by daily and weekly candlesticks. In addition, you must know that not all highs are cycle highs and not all lows are cycle lows. One of the problems with the Stc indicator is that the signal line can get stuck in overbought or oversold territories for extended periods. This is because cycles haven’t completed their time. This means that more pips can be added to the upside, even though the signal is in overbought territory. Yet when the cycle completes its time, the signal line will generate a powerful buy or sell signal.
Applying the indicator
The EasyLanguage code for the Stc can be found below (“Schaff Trend Cycle EasyLanguage Code”). Using the Stc is quite easy. The Emas alone will denote the direction of the trend. Once that is established, you have to pay attention to the signal line. The signal line oscillates or cycles between zero and 100 just like fast stochastics and Macd, but it is a truer signal.
SCHAFF TREND CYCLE EASYLANGUAGE CODE
Inputs: TCLen (10), MA1 (23), MA2 (50);

Plot1(_SchaffTC(TCLen,MA1,MA2), "Schaff_TLC");
Plot2(25);
Plot3 (75);

Inputs: TCLen(NumericSimple), MA1(NumericSimple), MA2 (NumericSimple);
Variables: XMAC(0), Frac1(0), PF(0), PFF(0), Frac2(0), Factor(.5);

{Calculate a MACD Line}
XMAC=MACD (c,MA1,MA2);

{1st Stochastic: Calculate Stochastic of a MACD}
Value1=Lowest (XMAC,TCLen);
Value2=Highest (XMAC,TCLen) - Value1;

{%Fast K of MACD}
Frac1=IFF(Value2 > 0, ((XMAC-Value1)/Value2) * 100,Frac1[1]);

{Smoothed Calculation for % Fast D of MACD}
PF=IFF(CurrentBar <=1,Frac1,PF[1]+ (Factor * (Frac1-PF[1])));

{2nd Stochastic: DCalculate Stochastic of smoothed Percent Fast D, 'PF', above}
Value3=Lowest(PF,TCLen);
Value4=Highest(PF,TCLen)-Value3;

{% of Fast K of PF}
FRAC2=IFF(Value4 > 0,((PF - Value3)/Value4) * 100,Frac2[1]);

{Smoothed Calculation for %Fast D of PF}
PFF=IFF(CurrentBar<=1,Frac2,PFF[1]+(Factor * (Frac2-PFF[1])));

{The STC Function is the % Fast D of PF}
_SchaffTC=PFF;
Buy and sell signals are generated when the signal line breaches 25 at the bottom and 75 at the top. When the signal line breaches 25 and is heading up, this is a buy, or a long position. Consequently, when the signal line breaches 75 and is pointing down, this is a short. Exit your trades when the short hits the bottom and breaches 25 and when the long hits the top and breaches 75. But if the signal line is pointing in the right direction, you may choose to stay in the trade since currencies can easily trend to the high 90s at the top and near zero at the bottom.
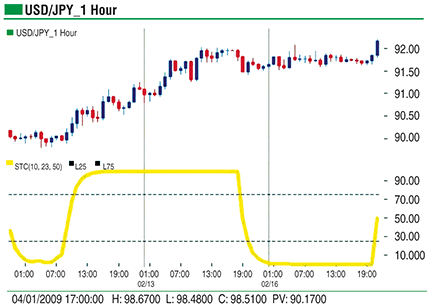
On the hourly chart of the US dollar/Japanese yen (Usd/Jpy) in Figure 1, note how the signal line alerted a buy position that resulted in a 200-pip move. Note the overbought signal at 90, where the cycle alerted the overbought position. When the cycle ended, the downside move from 92 to 91.50 was a sell opportunity that resulted in another 50 pips.

Figure 1: Schaff trend cycle buy and sell signals. On this hourly chart of the USD/JPY, note how the signal line alerted a buy position that resulted in a 200-pip move. Note the overbought signal at 90, where the cycle alerted the overbought position. When the cycle ended, the downside move from 92 to 91.50 was a sell opportunity that resulted in another 50 pips.
Confirming candles
It is a good idea to find confirmation through candles. Before the long position, make sure you have an upward candle and a downward candle for shorts. Doug Schaff recommends a confirmation by entering on the second candle up for longs and the second candle down for shorts. Following the signal line will alert traders to the anticipated move of prices, a move that is usually substantial. But this takes patience.
Identifying tops/bottoms
Technical analysis jargon would classify this indicator as a banded oscillator where fluctuations occur between overbought and oversold extremes. Banded oscillators are used to determine overbought and oversold conditions rather than analyze price momentum. But the objective of this indicator is to identify cycle tops and bottoms more than overbought or oversold extremes. While this is a trend indicator, it can be used on any time frame where longer-term charts are much better for reliability factors. Yet it is an indicator for all types of traders — scalpers to swing traders.
The more interesting aspect is this indicator is that it can be used as a standalone indicator. Yet this is never recommended, regardless of how reliable this indicator may be. Keep in mind not to use another leading indicator such as the relative strength index (Rsi), Williams’ %R, commodity channel index (Cci), or momentum because these are complementary indicators. Settings can be adjusted according to various time frames.
For example, Schaff recommends you try smaller Emas for longer time frames and longer Emas for shorter time frames. The smaller the number used for cycles, the more turns you will witness while the higher numbers will forecast fewer turns with more cycle accuracy. What you want from adjustments is for the signal line to perfectly follow prices and candles.
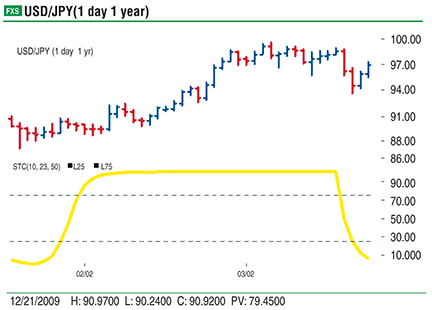
While I find this indicator to be amazingly reliable when the signal is caught correctly, there is one problem. The signal can stay in overbought or oversold conditions for extended periods. The signal may read 92 on an hourly chart and overbought, but still 200 more points were added to the upside. It is similar to oversold conditions. In this instance, you must wait until the proper signal time. On the hourly chart of the Usd/Jpy in Figure 2, a long entry was triggered at 89.00. At 91.00, the Stc was in overbought territory, yet the position resulted in a 200-pip move on this hourly chart. The sell signal came in at about 99.00 and stopped at about 94, a 500-pip profit.

Figure 2: STAYING IN OVERBOUGHT/OVERSOLD TERRITORY FOR EXTENDED PERIODS. A long entry was triggered at 89.00. At 91.00, the STC was in overbought territory, yet the position resulted in a 200-pip move on this hourly chart. The sell signal came in at about 99.00 and stopped at about 94, a 500-pip profit.
Just because a market is overbought doesn’t mean you should sell immediately. What you should do is check the Emas for bullish and bearish tendencies such as the 23- and 50-day crossovers and act based on those tendencies. My cycle period was set at 20, which means 20 bars. What was missed on the upside was another 10 to 20 cycle bars, since cycle theory only allows a maximum of 20 more bars. My early assumption may be to adjust the cycle periods higher rather than the Emas. In addition, this is not an indicator for short-range trades since it is a trending indicator. Signal lines tend to point sideways with range conditions. Periods of congestion won’t work for this indicator either.
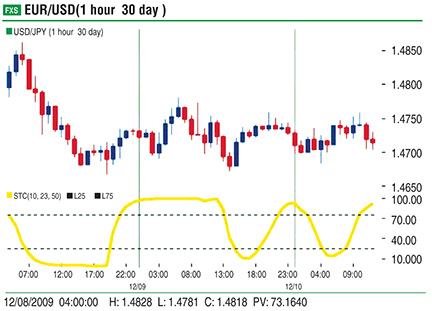
True to form with cycles is the ability to buy and sell many times throughout the day. On the hourly chart of the euro/US dollar (Eur/Usd) in Figure 3, the short became evident at 1.4900 with an exit at about 1.4750, resulting in a 150-pip profit. Also true to form is the wait for cycles to exhaust themselves. The next long position signal came in at 1.4650 with an exit at 1.4750 for a 100-pip profit. Another sell signal came in at 1.4750 and resulted in a 70-pip profit. So throughout this trading day, you could have made more than 250 pips in six trades.

FIGURE 3: BUYING AND SELLING MANY TIMES THROUGHOUT THE TRADING DAY. On this chart the short became evident at 1.4900 with an exit at about 1.4750, resulting in a 150-pip profit. Also true to form is the wait for cycles to exhaust themselves. The next long position signal came in at 1.4650, with an exit at 1.4750 for a 100-pip profit. Another sell signal came in at 1.4750 and resulted in a 70-pip profit.
Pretty close to perfect
It is practically impossible and probably not mathematically possible for an indicator to have a 100% reliability ratio. The best we can achieve is a percentage in the low 90s. The Schaff trend cycle indicator comes close to that number for its reliability factor.
Suggested reading
Schaff, Doug [2002]. “Catching Currency Moves With The Schaff Trend Cycle Indicator,”
Chartpoint: July/August 4.