TRADERS’ TIPS
July 2010
Here is this month’s selection of Traders’ Tips, contributed by various developers of technical analysis software to help readers more easily implement some of the strategies presented in this and other issues.
Other code appearing in articles in this issue is posted in the Subscriber Area of our website at https://technical.traders.com/sub/sublogin.asp. Login requires your last name and subscription number (from mailing label). Once logged in, scroll down to beneath the “Optimized trading systems” area until you see “Code from articles.” From there, code can be copied and pasted into the appropriate technical analysis program so that no retyping of code is required for subscribers.
You can copy these formulas and programs for easy use in your spreadsheet or analysis software. Simply “select” the desired text by highlighting as you would in any word processing program, then use your standard key command for copy or choose “copy” from the browser menu. The copied text can then be “pasted” into any open spreadsheet or other software by selecting an insertion point and executing a paste command. By toggling back and forth between an application window and the open web page, data can be transferred with ease.
This month’s tips include formulas and programs for:
- TRADESTATION: ANCHORED VWAP CHANNEL
- eSIGNAL: ANCHORED VWAP CHANNEL
- WEALTH-LAB: ANCHORED VWAP CHANNEL
- AMIBROKER: ANCHORED VWAP CHANNEL
- NEUROSHELL TRADER: ANCHORED VWAP CHANNEL
- AIQ: ANCHORED VWAP CHANNEL
- TRADERSSTUDIO: ANCHORED VWAP CHANNEL
- WAVE59: ANCHORED VWAP CHANNEL
- UPDATA: ANCHORED VWAP CHANNEL
- WORDEN BROTHERS STOCKFINDER: ANCHORED VWAP CHANNEL
- NINJATRADER: ANCHORED VWAP CHANNEL
- TRADE NAVIGATOR: ANCHORED VWAP CHANNEL
- NEOTICKER: ANCHORED VWAP CHANNEL
- TRADECISION: ANCHORED VWAP CHANNEL
- VT TRADER: ANCHORED VWAP CHANNEL
- METASTOCK: ANCHORED VWAP CHANNEL — COLES ARTICLE CODE
![]() TRADESTATION: ANCHORED VWAP CHANNEL
TRADESTATION: ANCHORED VWAP CHANNEL
In his article in this issue, “An Anchored Vwap Channel For Congested Markets,” author Andrew Coles draws upon previous market analysis work done by Paul Levine and George Reyna. He proposes certain calculations for the creation of a set of price support and resistance curves. This work expands on the author’s September 2008 Stocks & Commodities article, “The Midas Touch,” by adding support and resistance bands a fixed percentage above and below the Midas value.
We have developed EasyLanguage code to allow the calculated values described by Coles to be plotted on price charts. To download the EasyLanguage code for this study, go to the TradeStation and EasyLanguage Support Forum (https://www.tradestation.com/Discussions/forum.aspx?Forum_ID=213). Search for the file “ColesMidasChannel.”
A sample chart is shown in Figure 1.
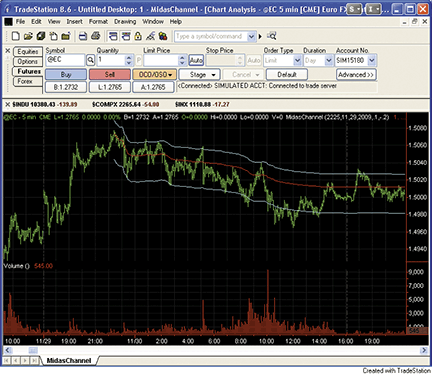
Figure 1: TRADESTATION, ANCHORED VWAP CHANNEL. Here is an example of the MidasChannel indicator applied to a five-minute chart of the euro FX contract on November 30, 2009. The upper channel line is 0.1% above the MIDAS value. The lower channel line is 0.2% below the MIDAS value. The lower pane displays trading volume.
This article is for informational purposes. No type of trading or investment recommendation, advice, or strategy is being made, given, or in any manner provided by TradeStation Securities or its affiliates.
Indicator: MidasChannel

inputs:
	StartTime( 930 ),
	StartMonth( 1 ),
	StartDay( 1 ),
	StartYear( 2009 ),
	UpperPctDisp( .1 ),
	LowerPctDisp( -.2 ) ;

variables:
	StartCalcDate( 0 ),
	VolumeValue( 0 ),
	MedPrice( 0 ),
	PV( 0 ),
	CumulativeVolume( 0 ),
	CumulativePV( 0 ),
	Started( false ),
	Denom( 0 ),
	KeyCumVol( 0 ),
	KeyCumPV( 0 ),
	MidasValue( 0 ) ;

if CurrentBar = 1 then
	StartCalcDate = ELDate( StartMonth, StartDay, StartYear ) ;

{ Midas Calculation }
if (Date >= StartCalcDate and Time >= StartTime)
	or Date > StartCalcDate
then
	begin
	VolumeValue = iff( BarType <= 1, Ticks, Volume ) ;
	MedPrice = MedianPrice ;
	PV = MedPrice * VolumeValue ;
	CumulativeVolume = VolumeValue + CumulativeVolume ;
	CumulativePV = PV + CumulativePV ;
	end ;

if Started = false and ( ( Date >= StartCalcDate and
 Time >= StartTime ) and ( ( Time[1] < StartTime or
 Date[1] < StartCalcDate ) or Date[1] > StartCalcDate ) )
then
	begin
	Started = true ;
	Denom = 1 ;
	KeyCumVol = CumulativeVolume ;
	KeyCumPV = CumulativePV ;
	end
else if Denom >= 1 then
	Denom = CumulativeVolume - KeyCumVol ;

if Started then
	begin
	if Denom > 1 then
		MidasValue = ( CumulativePV - KeyCumPV ) / Denom
	else if Denom = 1 then
		MidasValue = MedPrice ;

	Plot1( MidasValue, “Midas” ) ;
	Plot2( MidasValue * ( 1 + UpperPctDisp / 100), “UpBand”);
	Plot3( MidasValue * ( 1 + LowerPctDisp / 100), “DnBand”);
end;
![]() eSIGNAL: ANCHORED VWAP CHANNEL
eSIGNAL: ANCHORED VWAP CHANNEL
For this month’s Traders’ Tip, we’ve provided two formulas, DailyPDB.efs and IntradayPDB.efs, based on the formula code given in Andrew Coles’ article in this issue, “An Anchored Vwap Channel For Congested Markets.”
The studies contain formula parameters to set the start date/time and the upper/lower percentage for the bands, which may be configured through the Edit Studies window (Advanced Chart menu → Edit Studies). Please note that the formulas may require a custom time template that loads the appropriate amount of data to include the starting date or time entered for the formula parameters.
Sample charts are shown in Figures 2a and 2b.
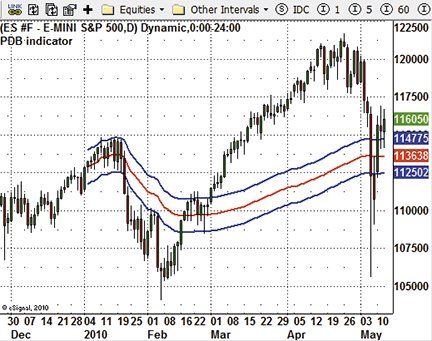
Figure 2a: eSIGNAL, ANCHORED VWAP CHANNEL — Daily
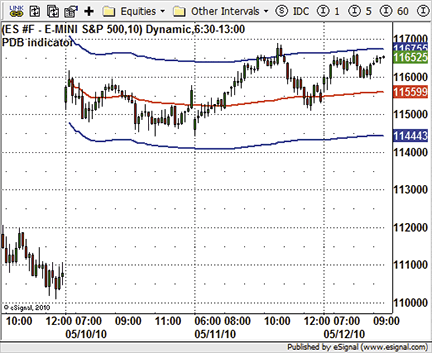
Figure 2b: eSIGNAL, ANCHORED VWAP CHANNEL — intraday
DailyPDB.efs
/*********************************
Provided By:
    eSignal (Copyright c eSignal), a division of Interactive Data
    Corporation. 2010. All rights reserved. This sample eSignal
    Formula Script (EFS) is for educational purposes only and may be
    modified and saved under a new file name.  eSignal is not responsible
    for the functionality once modified.  eSignal reserves the right
    to modify and overwrite this EFS file with each new release.

Description:
    PDB indicator for daily charts

Version:            1.00  05/07/2010

Formula Parameters:                     Default:
    Starting year                       2010
    Startng month                       1
    Starting day of month               4
    Percentage upper                    1
    Percentage lower                    1

Notes:
    The related article is copyrighted material. If you are not a subscriber
    of Stocks & Commodities, please visit www.traders.com.

**********************************/
var fpArray = new Array();
var bInit = false;
var bVersion = null;

function preMain() {
    setPriceStudy(true);
    setShowCursorLabel(true);
    setShowTitleParameters(false);
    setStudyTitle(“PDB indicator”);
    setCursorLabelName(“MIDAS”, 0);
    setDefaultBarFgColor(Color.red, 0);
    setPlotType(PLOTTYPE_LINE, 0);
    setDefaultBarThickness(2, 0);
    setCursorLabelName(“Upper”, 1);
    setDefaultBarFgColor(Color.blue, 1);
    setPlotType(PLOTTYPE_LINE, 1);
    setDefaultBarThickness(2, 1);
    setCursorLabelName(“Lower”, 2);
    setDefaultBarFgColor(Color.blue, 2);
    setPlotType(PLOTTYPE_LINE, 2);
    setDefaultBarThickness(2, 2);
    askForInput();
    var x=0;
    fpArray[x] = new FunctionParameter(“pYear”, FunctionParameter.NUMBER);
	with(fpArray[x++]){
        setName(“Starting year”);
        setLowerLimit(1900);
        setUpperLimit(2100);
        setDefault(2010);
    }
    fpArray[x] = new FunctionParameter(“pMonth”, FunctionParameter.NUMBER);
	with(fpArray[x++]){
        setName(“Startng month”);
        setLowerLimit(1);
        setUpperLimit(12);
        setDefault(1);
    }
    fpArray[x] = new FunctionParameter(“pDay”, FunctionParameter.NUMBER);
	with(fpArray[x++]){
        setName(“Starting day of month”);
        setLowerLimit(1);
        setUpperLimit(31);
        setDefault(4);
    }
    fpArray[x] = new FunctionParameter(“Band1”, FunctionParameter.NUMBER);
	with(fpArray[x++]){
        setName(“Percentage upper”);
        setLowerLimit(1);
        setUpperLimit(50);
        setDefault(1);
    }
    fpArray[x] = new FunctionParameter(“Band2”, FunctionParameter.NUMBER);
	with(fpArray[x++]){
        setName(“Percentage lower”);
        setLowerLimit(1);
        setUpperLimit(50);
        setDefault(1);
    }
}

var xFractalDimension = null;
var bStart = false;
var xMIDAS = null;

function main(pYear, pMonth, pDay, Band1, Band2) {
var nBarState = getBarState();
var nHour = getHour();
var nMinute = getMinute();
var nDay = getDay();
var nMonth = getMonth();
var nYear = getYear();
var nMIDAS = 0;
var Q1 = 0;
var Q2 = 0;
    if (bVersion == null) bVersion = verify();
    if (bVersion == false) return;
    if (!isDaily()) {
        drawTextAbsolute(5, 35, “This study requires Daily Chart.”,
            Color.white, Color.blue, Text.RELATIVETOBOTTOM|Text.RELATIVETOLEFT|Text.BOLD|Text.LEFT,
            null, 13, “M”);
        return;
    }
    if (nBarState == BARSTATE_ALLBARS) {
        if (pYear == null) pYear = 2010;
        if (pMonth == null) pMonth = 1;
        if (pDay == null) pDay = 4;
        if (Band1 == null) Band1 = 1;
        if (Band2 == null) Band2 = 1;
    }
    if (nYear == pYear && nMonth == pMonth && nDay == pDay) {
        bStart = true;
    }
    if (bStart) {
        if (!bInit) {
            xMIDAS = efsInternal(“Calc_MIDAS”, pYear, pMonth, pDay);
            bInit = true;
        }
        nMIDAS = xMIDAS.getValue(0);
        if (nMIDAS == null) return;
        Q1 = nMIDAS * (1 + Band1 / 100);
        Q2 = nMIDAS * (1 - Band2 / 100);

        return new Array(nMIDAS, Q1, Q2);
    } else {
        drawTextAbsolute(5, 35, “Start date not found on chart. Edit Start date in Edit Studies.”,
            Color.white, Color.blue, Text.RELATIVETOBOTTOM|Text.RELATIVETOLEFT|Text.BOLD|Text.LEFT,
            null, 13, “M”);
        return;
    }
}

var bCalc_MIDASInit = false;
var xMP = null;
var xCumMP = null;
var xCumVolume = null;
var xVolume = null;
var nStartV = 0;
var nStartMP = 0;

function Calc_MIDAS(pYear, pMonth, pDay) {
var nMIDAS = 0;
var nMP = 0;
var nCumMP = 0;
var nCumVolume = 0;
    if (!bCalc_MIDASInit) {
        xMP = efsInternal(“Calc_MP_CumMP_CumV”, pYear, pMonth, pDay);
        xCumMP = getSeries(xMP, 1);
        xCumVolume = getSeries(xMP, 2);
        xVolume = volume();
        bCalc_MIDASInit = true;
    }

    nMP = xMP.getValue(0);
    nCumMP = xCumMP.getValue(0);
    nCumVolume = xCumVolume.getValue(0);
    if (nMP == null || nCumMP == null || nCumVolume == null) return;
    if (nStartV == 0 || nStartMP == 0) {
        nStartV = xVolume.getValue(0);
        nStartMP = xCumMP.getValue(0);
    }
    nMIDAS = (nCumMP - nStartMP) / (nCumVolume - nStartV)
    return nMIDAS;
}

var bCalc_MPInit = false;
var xHL2 = null;
var xVolume = null;
var nCumMP = 0;
var nCumV = 0;
var bStartCalc = false;

function Calc_MP_CumMP_CumV(pYear, pMonth, pDay) {
var nRes = 0;
var nlocCumMP = 0;
var nlocCumV = 0;
var nVolume = 0;
var nHour = getHour();
var nMinute = getMinute();
var nDay = getDay();
var nMonth = getMonth();
var nYear = getYear();
    if (!bCalc_MPInit) {
        xHL2 = hl2();
        xVolume = volume();
        bCalc_MPInit = true;
    }
    if (nYear == pYear && nMonth == pMonth && nDay == pDay) {
        bStartCalc = true;
    }
    if (bStartCalc) {
        nVolume = xVolume.getValue(0);
        nRes = xHL2.getValue(0) * nVolume;
        if (getBarState() == BARSTATE_NEWBAR) {
            nCumMP = nCumMP + nRes;
            nCumV = nCumV + nVolume;
            nlocCumMP = nCumMP;
            nlocCumV = nCumV;
        } else {
            nlocCumMP = nCumMP + nRes;
            nlocCumV = nCumV + nVolume;
        }
        return new Array(nRes, nlocCumMP, nlocCumV);
    } else {
        return new Array(null, null, null);
    }
}

function verify() {
    var b = false;
    if (getBuildNumber() < 779) {
        drawTextAbsolute(5, 35, “This study requires version 8.0 or later.”,
            Color.white, Color.blue, Text.RELATIVETOBOTTOM|Text.RELATIVETOLEFT|Text.BOLD|Text.LEFT,
            null, 13, “error”);
        drawTextAbsolute(5, 20, “Click HERE to upgrade.@URL=https://www.esignal.com/download/default.asp”,
            Color.white, Color.blue, Text.RELATIVETOBOTTOM|Text.RELATIVETOLEFT|Text.BOLD|Text.LEFT,
            null, 13, “upgrade”);
        return b;
    } else {
        b = true;
    }
    return b;
}

IntradayPDB.efs

/*********************************
Provided By:
    eSignal (Copyright c eSignal), a division of Interactive Data
    Corporation. 2010. All rights reserved. This sample eSignal
    Formula Script (EFS) is for educational purposes only and may be
    modified and saved under a new file name.  eSignal is not responsible
    for the functionality once modified.  eSignal reserves the right
    to modify and overwrite this EFS file with each new release.

Description:
    PDB indicator for intraday charts

Version:            1.00  05/07/2010

Formula Parameters:                     Default:
    Startng month                       1
    Starting day of month               1
    Startng Hour                        1
    Startng Minute                      0
    Percentage upper                    1
    Percentage lower                    1

Notes:
    The related article is copyrighted material. If you are not a subscriber
    of Stocks & Commodities, please visit www.traders.com.

**********************************/
var fpArray = new Array();
var bInit = false;
var bVersion = null;
function preMain() {
    setPriceStudy(true);
    setShowCursorLabel(true);
    setShowTitleParameters(false);
    setStudyTitle(“PDB indicator”);
    setCursorLabelName(“MIDAS”, 0);
    setDefaultBarFgColor(Color.red, 0);
    setPlotType(PLOTTYPE_LINE, 0);
    setDefaultBarThickness(2, 0);
    setCursorLabelName(“Upper”, 1);
    setDefaultBarFgColor(Color.blue, 1);
    setPlotType(PLOTTYPE_LINE, 1);
    setDefaultBarThickness(2, 1);
    setCursorLabelName(“Lower”, 2);
    setDefaultBarFgColor(Color.blue, 2);
    setPlotType(PLOTTYPE_LINE, 2);
    setDefaultBarThickness(2, 2);
    askForInput();
    var x=0;
    fpArray[x] = new FunctionParameter(“pMonth”, FunctionParameter.NUMBER);
	with(fpArray[x++]){
        setName(“Startng month”);
        setLowerLimit(1);
        setUpperLimit(12);
        setDefault(1);
    }
    fpArray[x] = new FunctionParameter(“pDay”, FunctionParameter.NUMBER);
	with(fpArray[x++]){
        setName(“Starting day of month”);
        setLowerLimit(1);
        setUpperLimit(31);
        setDefault(1);
    }
    fpArray[x] = new FunctionParameter(“pHour”, FunctionParameter.NUMBER);
	with(fpArray[x++]){
        setName(“Starting hour”);
        setLowerLimit(0);
        setUpperLimit(23);
        setDefault(1);
    }
    fpArray[x] = new FunctionParameter(“pMinute”, FunctionParameter.NUMBER);
	with(fpArray[x++]){
        setName(“Starting minute”);
        setLowerLimit(0);
        setUpperLimit(59);
        setDefault(0);
    }
    fpArray[x] = new FunctionParameter(“Band1”, FunctionParameter.NUMBER);
	with(fpArray[x++]){
        setName(“Percentage upper”);
        setLowerLimit(1);
        setUpperLimit(50);
        setDefault(1);
    }
    fpArray[x] = new FunctionParameter(“Band2”, FunctionParameter.NUMBER);
	with(fpArray[x++]){
        setName(“Percentage lower”);
        setLowerLimit(1);
        setUpperLimit(50);
        setDefault(1);
    }
}

var xFractalDimension = null;
var bStart = false;
var xMIDAS = null;

function main(pMonth, pDay, pHour, pMinute, Band1, Band2) {
var nBarState = getBarState();
var nHour = getHour();
var nMinute = getMinute();
var nDay = getDay();
var nMonth = getMonth();
var nMIDAS = 0;
var Q1 = 0;
var Q2 = 0;
    if (bVersion == null) bVersion = verify();
    if (bVersion == false) return;
    if (isDaily() || isMonthly() || isWeekly()) {
        drawTextAbsolute(5, 35, “This study requires Intraday Chart.”,
            Color.white, Color.blue, Text.RELATIVETOBOTTOM|Text.RELATIVETOLEFT|Text.BOLD|Text.LEFT,
            null, 13, “M”);
        return;
    }
    if (nBarState == BARSTATE_ALLBARS) {
        if (pMonth == null) pMonth = 1;
        if (pDay == null) pDay = 1;
        if (pHour == null) pHour = 1;
        if (pMinute == null) pMinute = 0;
        if (Band1 == null) Band1 = 1;
        if (Band2 == null) Band2 = 1;
    }
    if (nMonth == pMonth && nDay == pDay && nHour == pHour && nMinute == pMinute) {
        bStart = true;
    }
    if (bStart) {
        if (!bInit) {
            xMIDAS = efsInternal(“Calc_MIDAS”, pMonth, pDay, pHour, pMinute);
            bInit = true;
        }
        nMIDAS = xMIDAS.getValue(0);
        if (nMIDAS == null) return;
        Q1 = nMIDAS * (1 + Band1 / 100);
        Q2 = nMIDAS * (1 - Band2 / 100);
        return new Array(nMIDAS, Q1, Q2);
    } else {
        drawTextAbsolute(5, 35, “Start date/time not found on chart. Edit Start date/time in Edit Studies.”,
            Color.white, Color.blue, Text.RELATIVETOBOTTOM|Text.RELATIVETOLEFT|Text.BOLD|Text.LEFT,
            null, 13, “M”);
        return;
    }
}

var bCalc_MIDASInit = false;
var xMP = null;
var xCumMP = null;
var xCumVolume = null;
var xVolume = null;
var nStartV = 0;
var nStartMP = 0;

function Calc_MIDAS(pMonth, pDay, pHour, pMinute) {
var nMIDAS = 0;
var nMP = 0;
var nCumMP = 0;
var nCumVolume = 0;
    if (!bCalc_MIDASInit) {
        xMP = efsInternal(“Calc_MP_CumMP_CumV”, pMonth, pDay, pHour, pMinute);
        xCumMP = getSeries(xMP, 1);
        xCumVolume = getSeries(xMP, 2);
        xVolume = volume();
        bCalc_MIDASInit = true;
    }
    nMP = xMP.getValue(0);
    nCumMP = xCumMP.getValue(0);
    nCumVolume = xCumVolume.getValue(0);
    if (nMP == null || nCumMP == null || nCumVolume == null) return;
    if (nStartV == 0 || nStartMP == 0) {
        nStartV = xVolume.getValue(0);
        nStartMP = xCumMP.getValue(0);
    }
    nMIDAS = (nCumMP - nStartMP) / (nCumVolume - nStartV)
    return nMIDAS;
}

var bCalc_MPInit = false;
var xHL2 = null;
var xVolume = null;
var nCumMP = 0;
var nCumV = 0;
var bStartCalc = false;

function Calc_MP_CumMP_CumV(pMonth, pDay, pHour, pMinute) {
var nRes = 0;
var nlocCumMP = 0;
var nlocCumV = 0;
var nVolume = 0;
var nHour = getHour();
var nMinute = getMinute();
var nDay = getDay();
var nMonth = getMonth();
    if (!bCalc_MPInit) {
        xHL2 = hl2();
        xVolume = volume();
        bCalc_MPInit = true;
    }
    if (nMonth == pMonth && nDay == pDay &&& nHour == pHour && nMinute == pMinute) {
        bStartCalc = true;
    }
    if (bStartCalc) {
        nVolume = xVolume.getValue(0);
        nRes = xHL2.getValue(0) * nVolume;
        if (getBarState() == BARSTATE_NEWBAR) {
            nCumMP = nCumMP + nRes;
            nCumV = nCumV + nVolume;
            nlocCumMP = nCumMP;
            nlocCumV = nCumV;
        } else {
            nlocCumMP = nCumMP + nRes;
            nlocCumV = nCumV + nVolume;
        }
        return new Array(nRes, nlocCumMP, nlocCumV);
    } else {
        return new Array(null, null, null);
    }
}

function verify() {
    var b = false;
    if (getBuildNumber() < 779) {
        drawTextAbsolute(5, 35, “This study requires version 8.0 or later.”,
            Color.white, Color.blue, Text.RELATIVETOBOTTOM|Text.RELATIVETOLEFT|Text.BOLD|Text.LEFT,
            null, 13, “error”);
        drawTextAbsolute(5, 20, “Click HERE to upgrade.@URL=https://www.esignal.com/download/default.asp”,
            Color.white, Color.blue, Text.RELATIVETOBOTTOM|Text.RELATIVETOLEFT|Text.BOLD|Text.LEFT,
            null, 13, “upgrade”);
        return b;
    } else {
        b = true;
    }
    return b;
}
To discuss this study or download complete copies of the formula code, please visit the Efs Library Discussion Board forum under the Forums link at www.esignalcentral.com or visit our Efs KnowledgeBase at www.esignalcentral.com/support/kb/efs/. The eSignal formula scripts (Efs) are also available for copying and pasting from the Stocks & Commodities website at Traders.com.
![]() WEALTH-LAB: ANCHORED VWAP CHANNEL
WEALTH-LAB: ANCHORED VWAP CHANNEL
The anchored Vwap channel indicators MidasUpper and MidasLower, presented by Andrew Coles in his article in this issue, have been added to Wealth-Lab’s TASCIndicators library June 2010 update.
The script shown here provides a simple visual method for implementing the channel by using sliders to assign bar numbers to the start and swing points. Arrows indicate the current channel’s anchor points. Since we’re dealing with bar numbers, use the sliders for coarse adjustments, and fine-tune by specifying a parameter’s bar number, as shown in Figure 3.
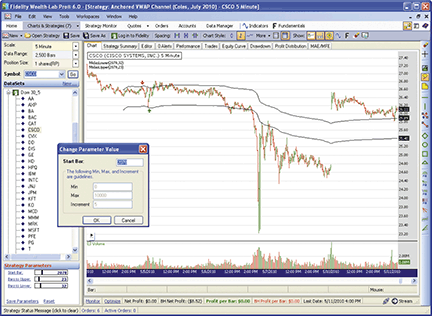
Figure 3: WEALTH-LAB, ANCHORED VWAP CHANNEL. Although the channel appears to have some predictive power, subjective determination of the start and swing points (arrows) clearly influence the outcome.
One approach to objectively evaluating the channel might be to identify the first x% swing points at the start of each trading day, and develop a breakout strategy based on channel support and resistance.
WealthScript code (C#):

using System;
using System.Collections.Generic;
using System.Text;
using System.Drawing;
using WealthLab;
using WealthLab.Indicators;
using TASCIndicators;

namespace WealthLab.Strategies
{
   public class AnchoredVWAPChannel : WealthScript
   {
      private StrategyParameter _startBar;
      private StrategyParameter _barsToUpper;
      private StrategyParameter _barsToLower;

      public AnchoredVWAPChannel()
      {
         _startBar  = CreateParameter(“Start Bar”,100,0,10000,5);
         _barsToUpper = CreateParameter(“Bars to Upper”,20,0,200,1);
         _barsToLower = CreateParameter(“Bars to Lower”,30,0,200,1);

      }
      protected override void Execute()
      {
         int startBar = _startBar.ValueInt;
         int barsToUpper = _barsToUpper.ValueInt;
         int barsToLower = _barsToLower.ValueInt;

         Font font = new Font(“Wingdings”, 8, FontStyle.Bold);
         string upArrow = Convert.ToChar(0x00E9).ToString();
         string dnArrow = Convert.ToChar(0x00EA).ToString();

         AnnotateBar(upArrow, startBar + barsToLower, false, Color.Green, Color.Transparent, font);
         AnnotateBar(dnArrow, startBar + barsToUpper, true, Color.Red, Color.Transparent, font);

         PlotSeries(PricePane,MidasLower.Series(Bars, startBar, barsToLower), Color.Black, LineStyle.Solid,1);
         PlotSeries(PricePane,MidasUpper.Series(Bars, startBar, barsToUpper), Color.Black, LineStyle.Solid,1);
      }
   }
}
![]() AMIBROKER: ANCHORED VWAP CHANNEL
AMIBROKER: ANCHORED VWAP CHANNEL
Implementing the anchored Midas percentage channel indicator presented in Andrew Coles’ article in this issue is easy in AmiBroker Formula Language.
A ready-to-use formula is presented in the Listing 1. To use it, enter the formula in the Afl Editor, then press the “Insert indicator” button. To select an anchor point, simply click on the chart in desired place. AmiBroker will plot the channel automatically. You may also adjust the channel width by clicking on the chart with the right mouse button and choosing “Parameters” from the context menu.
A sample chart is shown in Figure 4.
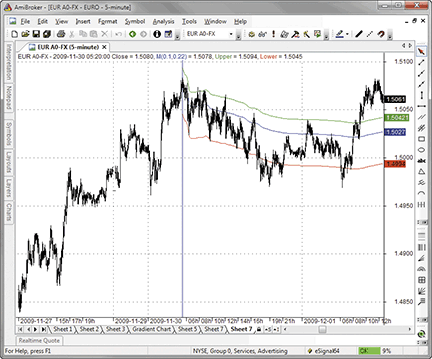
Figure 4: AMIBROKER, ANCHORED VWAP CHANNEL. Here is a euro FX price chart with the MIDAS (+0.1%, -0.22%) displacement channel.
LISTING 1
dn = DateTime();
sd = SelectedValue( dn );

start = dn == sd;

mp = (H+L)/2;

PV = mp * V;
CV = Cum( V );
VSS = CV - ValueWhen( start, CV );

denom = IIf( VSS == 0, 1, VSS );
num = Cum( PV ) - ValueWhen( start, Cum( PV ) );

M = IIf( BarsSince( start ), num/denom, mp );

Q1 = Param(„Percentage Upper”, 1, 0, 10, 0.01 );
Q2 = Param(„Percentage Lower”, 1, 0, 10, 0.01 );

Plot( C, Date() + „ Close”, colorBlack, styleBar );
Plot( M, „M” + _PARAM_VALUES(), colorBlue );
Plot( M * ( 1 + Q1 * 0.01 ), „Upper”, colorGreen );
Plot( M * ( 1 - Q2 * 0.01 ), „Lower”, colorRed );
![]() NEUROSHELL TRADER: ANCHORED VWAP CHANNEL
NEUROSHELL TRADER: ANCHORED VWAP CHANNEL
The Midas displacement channel described in “An Anchored Vwap Channel For Congested Markets” by Andrew Coles in this issue can be easily implemented in NeuroShell Trader by combining a few of the NeuroShell Trader’s 800+ indicators. Select “New Indicator…” from the Insert menu and use the Indicator Wizard to create the following indicators:
    BARNUM:
	CumSum(Add2(1,0),0)

    BARVOLUME:
If ThenElse(A>=B( BARNUM, StartBar# ), Volume, 0 )

    MIDAS:
Divide( CumSum( Multiply2( Avg2( High, Low), BARVOLUME ), 0 ), CumSum(BARVOLUME, 0 ) )

    MIDAS UPPER BAND:
	Multiply2 ( MIDAS, Add2( 1, Divide( PercentageUpper, 100)))

   MIDAS LOWER BAND:
	Multiply2 ( MIDAS, Subtract( 1, Divide( PercentageLower, 100)))
As described in Coles’ article, the Midas indicator should only begin computing after clear reversals in a trend as identified visually on the price chart. The Midas indicator formula given above accomplishes this by beginning computation on the bar number identified by the StartBar# parameter. To determine an appropriate StartBar# value, insert the Barnum indicator on your chart and set the Midas indicator’s StartBar# to the Barnum indicator’s value at a visually identified trend reversal.
A sample chart is shown in Figure 5.
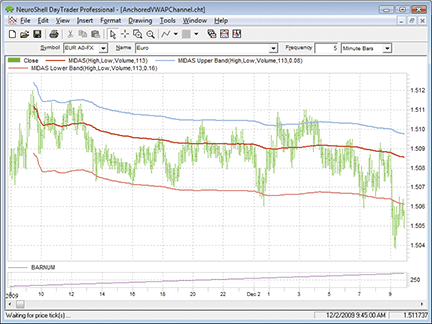
Figure 5: NEUROSHELL TRADER, MIDAS Displacement Channel
![]() AIQ: ANCHORED VWAP CHANNEL
AIQ: ANCHORED VWAP CHANNEL
The Aiq code is given here for Andrew Coles’ indicator and related functions described in his article in this issue, “An Anchored Vwap Channel For Congested Markets.”
In Figure 6, I show the indicator on a chart of the S&P 500 Spdr (Spy). The plot before the start date is a simple percent band using the median price and the percent offset. In my example, I input a start date of 11/9/2009 because this was the start of a consolidation zone on Spy. The Vwap bands will plot from the start date to the end of the chart.
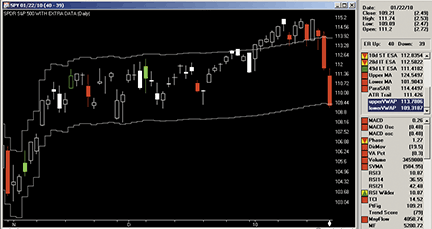
Figure 6: AIQ SYSTEMS, ANCHORED VWAP CHANNEL. This chart shows the anchored VWAP indicator on a chart of S&P 500 SPDR (SPY) using the following inputs: start date = 11/09/2009, pctBand = 2.
The code can be downloaded from the Aiq website at www.aiqsystems.com and also from www.TradersEdgeSystems.com/traderstips.htm.
! ANCHORED VWAP CHANNEL
! Author: Andrew Coles TASC July 2010
! Coded by: Richard Denning 5/12/10
! www.TradersEdgeSystems.com

!INPUTS:
pctBand is 2.
mo is 11.
da is 09.
yr is 2009.

!FORMULAS:
MP is ([High] + [Low]) / 2.
PV is MP * [Volume].
Date1 is makedate(mo,da,yr).
barsToStart is scanany(month()=mo and day()=da and year()=yr,1250)
	then offsettodate(month(),day(),year()).
CPV is sum(PV,^barsToStart).
CV is sum([Volume],^barsToStart).
MIDAS is iff(CV>0,  CPV / CV,MP).
upperBand is MIDAS * (1 + pctBand/100).  !PLOT AS SINGLE LINE ON CHART
lowerBand is MIDAS * (1 - pctBand/100).  !PLOT AS SINGLE LINE ON CHART
![]() TRADERSSTUDIO: ANCHORED VWAP CHANNEL
TRADERSSTUDIO: ANCHORED VWAP CHANNEL
The TradersStudio code for Andrew Coles’ indicator and related functions as discussed in his article in this issue, “An Anchored Vwap Channel For Congested Markets,” is shown here.
In Figure 7, the indicator is shown on a chart of the full size S&P 500 futures contract (SP). The inputs include an end date that can be set to a date in the future if the end date is not desired. The plot before the start date and after the end date is a simple percent band using the median price and the percent offset. In this example, I input a start date of 11/9/2009 because this was the start of a consolidation zone on the SP contract. I did not use the end date, so the anchored Vwap bands continue to the end of the chart.
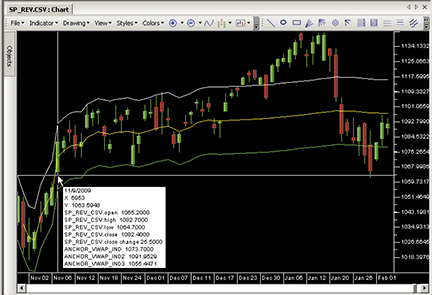
Figure 7: TRADERSSTUDIO, ANCHORED VWAP CHANNEL. Here is the anchored VWAP indicator on a chart of the full-sized S&P 500 futures contract using the following inputs: start_date =11/09/2009, end_date = 12/31/2010, pctBand = 1.8 (1091109, 1101231, 1.8). Note the date input format uses TradeStation-style dates.
The code can be downloaded from the TradersStudio website at www.TradersStudio.com → Traders Resources → FreeCode and also from www.TradersEdgeSystems.com/traderstips.htm.
' ANCHORED VWAP CHANNEL
' Author: Andrew Coles TASC July 2010
' Coded by: Richard Denning 5/12/10
' www.TradersEdgeSystems.com

Function Anchor_VWAP(start_date,end_date,pctBand as double,byref upperBand, byRef lowerBand)
' start date format is same as Tradestation 1/15/2003 is 1030115
Dim MP As BarArray
Dim PV As BarArray
Dim CV As BarArray
Dim MIDAS As BarArray
MP = (H + L) / 2
PV = MP * V
If Date>=MigrateDate(start_date) And Date<=MigrateDate(end_date) Then
    PV = PV + PV[1]
    CV = V + CV[1]
  Else
    PV = 0
    CV = 0
End If
If CV > 0 Then
    MIDAS =  PV / CV
  Else
    MIDAS = MP
End If
Anchor_VWAP = MIDAS
upperBand = MIDAS * (1 + pctBand/100)
lowerBand = MIDAS * (1 - pctBand/100)
End Function

'-----------------------------------------------------------

Sub Anchor_VWAP_IND(start_date,end_date,pctBand)
Dim MIDAS,upperBand,lowerBand
MIDAS = Anchor_VWAP(start_date,end_date,pctBand,upperBand,lowerBand)
plot1(MIDAS)
plot2(upperBand)
plot3(lowerBand)
End Sub
![]() WAVE59: ANCHORED VWAP CHANNEL
WAVE59: ANCHORED VWAP CHANNEL
In his article in this issue, Andrew Coles describes the late Paul Levine’s Midas. As QScript is more flexible than the MetaStock code provided in the article, we were able to enhance the Midas indicator in two significant ways. First, we added “hotspot” support. This allows traders to simply click on the bar they wish to anchor the Midas channels to, which eliminates tedious date and time parameter entry when loading the indicator. Second, we extended the calculation to include other volume types, such as tick volume. This allows us to apply Midas to instruments where volume data typically isn’t available, such as in forex. Take a look at the excellent signals on the one-minute Eur/Usd chart in Figure 8, using increments of 1/3% of the Midas calculation.
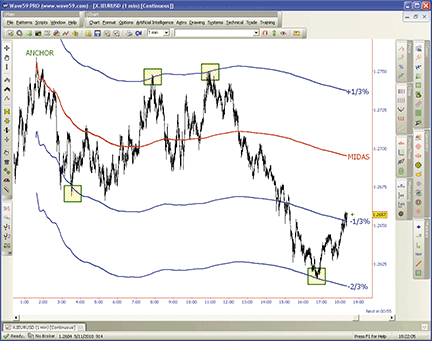
FIGURE 8: WAVE59, ANCHORED VWAP CHANNEL. Signals are shown here on a one-minute EUR/USD chart, using increments of 1/3% of the MIDAS calculation.
The following script implements this indicator in Wave59. As always, users of Wave59 can download these scripts directly using the QScript Library found at https://www.wave59.com/library.
Indicator:  SC_Coles_MIDAS
# SC_Coles_Midas
# This script automates the MIDAS bands described in the July 2010
# issue of Stocks & Commodities magazine
# enter volume or tick_volume for “voltype” input
input: displacement(0.01), voltype(volume), midcolor(red), bandcolor(blue), width(1);

# initialize variables
if (barnum == barsback) {
    startbar = hotspot_to_bar(1);
    pv, cum = 0;
    MIDAS = close;
}

if (barnum >= startbar) {
   # compute MIDAS calculation
   pv = pv+ ((high+low)/2) * voltype;
   cum = cum + voltype;
   MIDAS = pv/cum;

   # plot the results
   plot1 = midas;
   color1 = midcolor;
   plot2 = midas*(1+displacement);
   color2 = bandcolor;
   plot3 = midas*(1-displacement);
   color3 = bandcolor;
   thickness1, thickness2, thickness3 = width;
}
![]() UPDATA: ANCHORED VWAP CHANNEL
UPDATA: ANCHORED VWAP CHANNEL
This tip is based on the article “An Anchored Vwap Channel For Congested Markets” by Andrew Coles in this issue.
In his article, Coles further develops his Midas (market interpretation/data analysis system) approach on the concept of Vwap (volume weighted average price), combining channel and envelope methodologies to predict price reversals.
The Updata code for this indicator (and its intraday version) is in the Updata Indicator Library and may be downloaded by clicking the Custom menu and then Indicator Library. Those who cannot access the library due to firewall issues may paste the code shown here into the Updata Custom editor and save it.
A sample chart is shown in Figure 9.
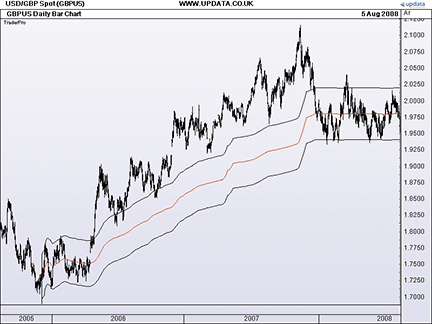
FIGURE 9 UPDATA, ANCHORED VWAP CHANNEL. This chart shows the MIDAS displacement channel generated by USD/GBP daily spot. The upper and lower curves capture significant swings until early 2006. From 2008 onward, the swings are captured again, but with some porosity.
PARAMETER “Year [yyyy]” #YEAR=2005
PARAMETER “Month [m]” #MONTH=12
PARAMETER “Day [d]” #DAY=1
PARAMETER “% Upper” @pctUp=10
PARAMETER “% Lower” @pctDn=10
DISPLAYSTYLE 3LINES
PLOTSTYLE LINE RGB(255,0,0)
PLOTSTYLE2 LINE RGB(0,0,0)
PLOTSTYLE3 LINE RGB(0,0,0)
INDICATORTYPE TOOL

@STARTDATE=DATE(#DAY,#MONTH,#YEAR)
@NUM=0
@DENOM=0
@PV=0
@M=0
@SUMPV=0
@SUMVOL=0
@UPPERBAND=0
@LOWERBAND=0
#COUNT=0
@INITVOL=0
@INITPV=0

FOR #CURDATE=0 TO #LASTDATE

   If #CURDATE=@STARTDATE
      @INITVOL=VOL
      @INITPV=((HIGH+LOW)/2)*VOL
   EndIf

   If #CURDATE>=@STARTDATE

      @PV=((HIGH+LOW)/2)*VOL
      @SUMPV=@SUMPV+@PV
      @SUMVOL=@SUMVOL+VOL

      if @SUMVOL-@INITVOL=0
         @DENOM=1
      else
         @DENOM=@SUMVOL-@INITVOL
      endif

      @M=(@SUMPV-@INITPV)/@DENOM

      @PLOT=@M
      @PLOT2=@M*(1+(@pctUp/100))
      @PLOT3=@M*(1-(@pctDn/100))

   EndIf

NEXT
![]() WORDEN BROTHERS STOCKFINDER: ANCHORED VWAP CHANNEL
WORDEN BROTHERS STOCKFINDER: ANCHORED VWAP CHANNEL
The anchored Vwap indicator discussed by Andrew Coles in his article in this issue (“An Anchored Vwap Channel For Congested Markets”) has now been made available in the StockFinder v5 indicator library.
You can add the indicator to your chart by clicking the “Add Indicator/Condition” button or by simply typing “/Vwap” and choosing “anchored Vwap” from the list of available indicators (Figure 10).
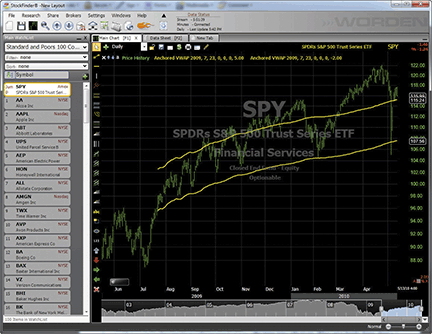
Figure 10: STOCKFINDER, ANCHORED VWAP CHANNEL. Two anchored VWAP plots are added to the price plot to form a channel. The “anchor” date (and time, for intraday charts) and the offset percentage can be set by clicking on the plot, which opens the indicator editor.
To download the StockFinder software and get a free trial, go to www.StockFinder.com.
![]() NINJATRADER: ANCHORED VWAP CHANNEL
NINJATRADER: ANCHORED VWAP CHANNEL
The Midas indicator, as discussed in “An Anchored Vwap Channel For Congested Markets” by Andrew Coles in this issue, has been implemented as an indicator available for download at www.ninjatrader.com/SC/July2010SC.zip.
Once you have it downloaded, from within the NinjaTrader Control Center window, select the menu File → Utilities → Import NinjaScript and select the downloaded file. This indicator is for NinjaTrader version 6.5 or greater.
You can review the indicator’s source code by selecting the menu Tools → Edit NinjaScript → Indicator from within the NinjaTrader Control Center window and selecting “Midas.”
NinjaScript indicators are compiled Dlls that run native, not interpreted, which provides you with the highest performance possible.
A sample chart implementing the strategy is shown in Figure 11.
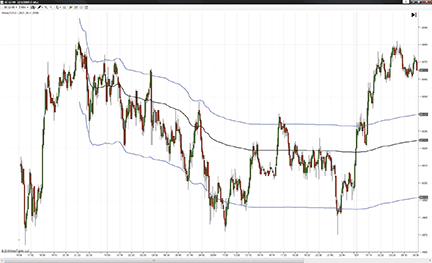
Figure 11: NINJATRADER, ANCHORED VWAP CHANNEL. This screenshot shows the MIDAS indicator applied to a five-minute chart of the CME Globex Euro FX (6E) December 2009 futures contract.
![]() TRADE NAVIGATOR: ANCHORED VWAP CHANNEL
TRADE NAVIGATOR: ANCHORED VWAP CHANNEL
Trade Navigator offers everything needed for recreating the indicators discussed in Andrew Coles’ article in this issue, “An Anchored Vwap Channel For Congested Markets.” Here, we will show you how to set up the custom indicators and add them to any chart in Trade Navigator.
You can set up the custom indicators discussed in Coles’ article in this issue by using the TradeSense code given here. First, open the Trader’s Toolbox, click on the Functions tab, and click the New button. Paste in the following code:
&sm := Month = startmonth
&sd := DayOfMonth = startday
&sy := Year = startyear
&start := &sd And &sm And &sy
&mp := Mid Price
&pv := &mp * Volume
&denom := IFF (CumulativeSum (Volume , 0) - CumulativeSum (Volume , 0).Bars
 Since (&start , 1 , 0) = 0 , 1 , CumulativeSum (Volume , 0) - CumulativeSum
 (Volume , 0).Bars Since (&start , 1 , 0))
&m := IFF (Bars Since (&start) , (CumulativeSum (&pv , 0) - CumulativeSum
(&pv , 0).Bars Since (&start , 1 , 0)) / &denom , &mp)

&m
When you verify or save the function, you will get an “Add inputs” message. Click the Add button and set the input values:
startmonth = 11
startday = 2
startyear = 2009
Note: These input values are examples. Input values can be changed after the indicator is already added to the chart.
Click the Verify button. When you are finished, click on the Save button, type a name for your new function and click OK.
Repeat these steps for the Int Midas Band, Lower Int Midas Band, Lower Midas Band, Upper Int Midas Band, and Upper Midas Band functions using the following formula for each:
Int Midas Band:

&sm := Month = startmonth
&sd := DayOfMonth = startday
&sy := Year = startyear
&sh := Time = starthourmin
&start := &sd And &sm And &sy And &sh
&mp := Mid Price
&pv := &mp * Volume
&denom := IFF (CumulativeSum (Volume , 0) - CumulativeSum (Volume , 0).Bars
 Since (&start , 1 , 0) = 0 , 1 , CumulativeSum (Volume , 0) - CumulativeSum
 (Volume , 0).Bars Since (&start , 1 , 0))
&m := IFF (Bars Since (&start) , (CumulativeSum (&pv , 0) - CumulativeSum
(&pv , 0).Bars Since (&start , 1 , 0)) / &denom , &mp)

&m

Inputs:

startmonth = 11
startday = 2
startyear = 2009
starthourmin = 1000

Lower Int Midas Band:

&sm := Month = startmonth
&sd := DayOfMonth = startday
&sy := Year = startyear
&sh := Time = starthourmin
&start := &sd And &sm And &sy And &sh
&mp := Mid Price
&pv := &mp * Volume
&denom := IFF (CumulativeSum (Volume , 0) - CumulativeSum (Volume , 0).Bars
 Since (&start , 1 , 0) = 0 , 1 , CumulativeSum (Volume , 0) - CumulativeSum
 (Volume , 0).Bars Since (&start , 1 , 0))
&m := IFF (Bars Since (&start) , (CumulativeSum (&pv , 0) - CumulativeSum
 (&pv , 0).Bars Since (&start , 1 , 0)) / &denom , &mp)

&m * (1 - (percentupper / 100))

Inputs:

startmonth = 11
startday = 2
startyear = 2009
starthourmin = 1000
percentlower = 4

Lower Midas Band:

&sm := Month = startmonth
&sd := DayOfMonth = startday
&sy := Year = startyear
&start := &sd And &sm And &sy
&mp := Mid Price
&pv := &mp * Volume
&denom := IFF (CumulativeSum (Volume , 0) - CumulativeSum (Volume , 0).Bars
 Since (&start , 1 , 0) = 0 , 1 , CumulativeSum (Volume , 0) - CumulativeSum
 (Volume , 0).Bars Since (&start , 1 , 0))
&m := IFF (Bars Since (&start) , (CumulativeSum (&pv , 0) - CumulativeSum
 (&pv , 0).Bars Since (&start , 1 , 0)) / &denom , &mp)

&m * (1 - (percentlower / 100))

Inputs:

startmonth = 11
startday = 2
startyear = 2009
percentlower = 1

Upper Int Midas Band:

&sm := Month = startmonth
&sd := DayOfMonth = startday
&sy := Year = startyear
&sh := Time = starthourmin
&start := &sd And &sm And &sy And &sh
&mp := Mid Price
&pv := &mp * Volume
&denom := IFF (CumulativeSum (Volume , 0) - CumulativeSum (Volume , 0).Bars
 Since (&start , 1 , 0) = 0 , 1 , CumulativeSum (Volume , 0) - CumulativeSum
 (Volume , 0).Bars Since (&start , 1 , 0))
&m := IFF (Bars Since (&start) , (CumulativeSum (&pv , 0) - CumulativeSum
 (&pv , 0).Bars Since (&start , 1 , 0)) / &denom , &mp)

&m * (1 + (percentupper / 100))

Inputs:

startmonth = 11
startday = 2
startyear = 2009
starthourmin = 1000
percentupper = 2

Upper Midas Band:

&sm := Month = startmonth
&sd := DayOfMonth = startday
&sy := Year = startyear
&start := &sd And &sm And &sy
&mp := Mid Price
&pv := &mp * Volume
&denom := IFF (CumulativeSum (Volume , 0) - CumulativeSum (Volume , 0).Bars
 Since (&start , 1 , 0) = 0 , 1 , CumulativeSum (Volume , 0) - CumulativeSum
 (Volume , 0).Bars Since (start , 1 , 0))
&m := IFF (Bars Since (&start) , (CumulativeSum (&pv , 0) - CumulativeSum
 (&pv , 0).Bars Since (&start , 1 , 0)) / &denom , &mp)

&m * (1 + (percentupper / 100))

Inputs:

startmonth = 11
startday = 2
startyear = 2009
percentupper = 1
To show the indicator on a daily chart, go to the “Add to chart” window by clicking on the chart and typing “A” on the keyboard. Click on the Indicators tab, find the Midas indicator in the list and either double-click on it or highlight the name and click the Add button.
Repeat these steps to add the Lower Midas Band and Upper Midas Band indicators. Once you have the indicators added to the chart, click on the label for Midas and drag it into the price pane with the lower and upper Midas bands. Highlight each indicator and change it to the desired color in the chart settings window.
When you have everything the way you want, click on Pane 1: Price to highlight everything in that pane. Click on the “Save study” button. Type “Midas” for the name and type a description if desired. Click Save. You now have a study that you can add to any chart by typing the hot key “A” and selecting the study from the Studies tab.
For intraday charts, repeat these steps using an intraday chart and adding the Int Midas Band, Lower Int Midas Band, and Upper Int Midas Band in place of the Midas, Lower Midas Band, and Upper Midas Band.
Genesis Financial Technologies has provided a library called “Vwap for congested markets” that includes the studies with the custom indicators discussed here. To get this library, download the file named “SC0110,” downloadable through Trade Navigator.
A sample chart is shown in Figure 12.
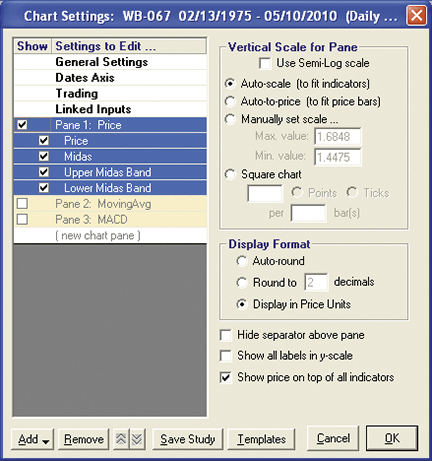
Figure 12: TRADE NAVIGATOR, ANCHORED VWAP CHANNEL
![]() NEOTICKER: ANCHORED VWAP CHANNEL
NEOTICKER: ANCHORED VWAP CHANNEL
There are two Vwap band indicators presented in Andrew Coles’ article in this issue: daily and intraday. The indicator we named “Tasc Vwap channel daily” (Listing 1) has two parameters: upper and lower band percentage. They are real numbers that allow users to adjust the percentage used to calculate Vwap upper and lower bands. The indicator we named “Tasc channel intraday” (Listing 2) is similar to the daily version with different limits to the upper and lower band percentages, and the Vwap calculation is reset on a daily basis.
These two indicators will plot the volume weighted average price (Vwap) and the percentage bands (Figure 13).
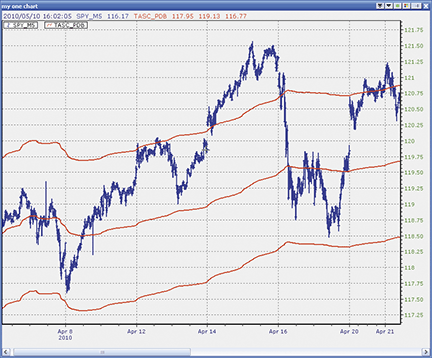
Figure 13: NEOTICKER, ANCHORED VWAP CHANNEL
A downloadable version of this indicator will be available at the NeoTicker blog site (https://blog.neoticker.com).
Listing 1
M := VWAP(0,data1,”(h+l)/2”,”1980/1/1 0:0:0”,”NO”);
$Q1 := choose (param1 < 1, 1, param1 > 50, 50, param1); ‘upper band
$Q2 := choose (param2 < 1, 1, param2 > 50, 50, param2); ‘lower band
plot1 := M;
plot2 := M*(1+$Q1/100);
plot3 := M*(1-$Q2/100);

Listing 2
M := VWAP(0,data1,”(h+l)/2”,”1980/1/1 0:0:0”,”YES”);
$Q1 := choose (param1 < 0.001, 0.001, param1 > 2, 2, param1); ‘upper band
$Q2 := choose (param2 < 0.001, 0.001, param2 > 4, 4, param2); ‘lower band
plot1 := M;
plot2 := M*(1+$Q1/100);
plot3 := M*(1-$Q2/100);
![]() TRADECISION: ANCHORED VWAP CHANNEL
TRADECISION: ANCHORED VWAP CHANNEL
In his article “An Anchored Vwap Channel For Congested Markets” in this issue, Andrew Coles demonstrates how to identify price reversals using an indicator that combines channel and envelope methodologies.
Tradecision users can replicate the indicator using Tradecision’s Indicator Builder. First, set up the following four indicators: PDB_Daily_Top indicator, PDB_Daily_Bottom indicator, PDB_Intraday_Top indicator, and PDB_Intraday_Bottom indicator using the following code:
PDB_Daily_Top indicator:
{user defined input}
input
start_month:»startng month», 1, 1, 12;
start_day:»starting day of month», 1, 1, 31;
start_year:»starting year», 2000, 1980, 2100;
upper_perc:»percentage-upper», 1, 1, 50;
end_input

var
start:=start_day = DayOfMonth() and start_month = Month() and start_year = Year();
denom:=0;
pv:=0;
M:=0;
end_var

{mid price}
pv:=MedianPrice() * v;

{Midas calculation}
denom:=iff(cum(V) - NthValueWhen(1, start, Cum(V)) = 0, 1, Cum(V) -
 NthValueWhen(1, start, Cum(V)));

{Adding percent displacement bands}
M:=iff(BarsSince(start)>0, (Cum(pv) - NthValueWhen(1, start, Cum(pv))) / denom,
 MedianPrice());
return M * (1 + (upper_perc/100));
PDB_Daily_Bottom:
{user defined input}
input
start_month:»startng month», 1, 1, 12;
start_day:»starting day of month», 1, 1, 31;
start_year:»starting year», 2000, 1980, 2100;
lower_perc:»percentage-lower», 1, 1, 50;
end_input

var
start:=start_day = DayOfMonth() and start_month = Month() and start_year = Year();
denom:=0;
pv:=0;
M:=0;
end_var

{mid price}
pv:=MedianPrice() * v;

{Midas calculation}
denom:=iff(cum(V) - NthValueWhen(1, start, Cum(V)) = 0, 1, Cum(V) -
 NthValueWhen(1, start, Cum(V)));

{Adding percent displacement bands}
M:=iff(BarsSince(start)>0, (Cum(pv) - NthValueWhen(1, start, Cum(pv))) / denom,
 MedianPrice());

return M * (1 - (lower_perc/100));

PDB_Intraday_Top:
{user defined input}
input
start_month:»startng month», 1, 1, 12;
start_day:»starting day of month», 1, 1, 31;
start_year:»starting year», 2000, 1980, 2100;
start_hour:»hour», 1, 1, 24;
start_min:»minute», 0, 0,60;
upper_perc:»percentage-upper», 0.001, 0.001, 2;
end_input

var
start:=start_day = DayOfMonth() and start_month = Month() and start_year =
 Year() and start_hour = Hour() and start_min = Minute();
denom:=0;
pv:=0;
M:=0;
end_var

{mid price}
pv:=MedianPrice() * v;

{Midas calculation}
denom:=iff(cum(V) - NthValueWhen(1, start, Cum(V)) = 0, 1, Cum(V) -
 NthValueWhen(1, start, Cum(V)));

{Adding percent displacement bands}
M:=iff(BarsSince(start)>0, (Cum(pv) - NthValueWhen(1, start, Cum(pv))) / denom,
 MedianPrice());

return M * (1 - (upper_perc/100));

PDB_Intraday_Bottom:
{user defined input}
input
start_month:»startng month», 1, 1, 12;
start_day:»starting day of month», 1, 1, 31;
start_year:»starting year», 2000, 1980, 2100;
start_hour:»hour», 1, 1, 24;
start_min:»minute», 0, 0,60;
lower_perc:»percentage-lower», 0.001, 0.001, 4;
end_input

var
start:=start_day = DayOfMonth() and start_month = Month() and
start_year = Year() and start_hour = Hour() and start_min = Minute();
denom:=0;
pv:=0;
M:=0;
end_var

{mid price}
pv:=MedianPrice() * v;

{Midas calculation}
denom:=iff(cum(V) - NthValueWhen(1, start, Cum(V)) = 0, 1, Cum(V) -
 NthValueWhen(1, start, Cum(V)));

{Adding percent displacement bands}
M:=iff(BarsSince(start)>0, (Cum(pv) - NthValueWhen(1, start, Cum(pv))) / denom,
 MedianPrice());

return M * (1 - (lower_perc/100));
To import the strategy into Tradecision, visit the area “Traders’ Tips from Tasc Magazine” at www.tradecision.com/support/tasc_tips/tasc_traders_tips.htm or copy the code from the Stocks & Commodities website at www.traders.com.
A sample chart is shown in Figure 14.
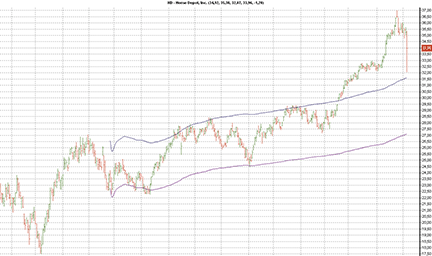
FIGURE 14: TRADECISION, ANCHORED VWAP CHANNEL ON DAILY CHART OF HOME DEPOT. Two channels effectively contain the uptrend, showing both up and down reversals within the trend.
![]() VT TRADER: ANCHORED VWAP CHANNEL
VT TRADER: ANCHORED VWAP CHANNEL
This Traders’ Tip is based on “An Anchored Vwap Channel For Congested Markets” by Andrew Coles in this issue.
The Vwap support and resistance indicator (that is, the Midas) was developed by the late Paul Levine. The main goal of the Midas system is the prediction of major trend reversals using nonlinear support and resistance curves. The anchored Vwap channel expands on the original Midas indicator by creating an upper and lower channel around the Midas to help contain price action that penetrates more deeply than the curves in the original Midas.
The VT Trader code and instructions for creating both versions of the Midas indicator are as follows:
- VT Trader’s Ribbon → Technical Analysis menu → Indicators group → Indicators Builder → [New] button
- In the General tab, type the following text into each corresponding text box:
Name: TASC - 07/2010 - Anchored VWAP Channel
Function Name Alias: tasc_MidasChannel
Label Mask: TASC - 07/2010 - Anchored VWAP Channel
Midas (%sm%/%sd%/%sy% %sh%:%se%) = %Midas%, UB (%UB%) = %UpperBand%, LB (%LB%) = %LowerBand%
Placement: Price Frame
Data Inspection Alias: VWAP Channel
- In the Input Variable(s) tab, create the following variables:
[New] button...
Name: sm
Display Name: Starting Month
Type: integer (with bounds)
Default: 1
Min Bounds: 1
Max Bounds: 12

[New] button...
Name: sd
Display Name: Starting Day
Type: integer (with bounds)
Default: 1
Min Bounds: 1
Max Bounds: 31

[New] button...
Name: sy
Display Name: Starting Year
Type: integer
Default: 2010

[New] button...
Name: sh
Display Name: Starting Hour
Type: integer (with bounds)
Default: 1
Min Bounds: 0
Max Bounds: 23

[New] button...
Name: se
Display Name: Starting Minute
Type: integer (with bounds)
Default: 0
Min Bounds: 0
Max Bounds: 59

[New] button...
Name: UB
Display Name: Upper Band Percentage
Type: float
Default: 1

[New] button...
Name: LB
Display Name: Lower Band Percentage
Type: float
Default: 1
- In the Output Variable(s) tab, create the following variables:
[New] button...
Var Name: Midas
Name: (Dimension)
Line Color: dark blue
Line Width: slightly thicker
Line Type: solid

[New] button...
Var Name: UpperBand
Name: (Upper Band)
Line Color: red
Line Width: thin
Line Type: solid

[New] button...
Var Name: LowerBand
Name: (Lower Band)
Line Color: red
Line Width: thin
Line Type: solid
- In the Formula tab, copy and paste the following formula:
{Provided By: Capital Market Services, LLC & Visual Trading Systems, LLC} {Copyright: 2010} {Description: TASC, July 2010 - “The Mystical MIDAS, an Anchored VWAP Channel for Congested Markets” by Andrew Coles} {File: tasc_MidasChannel.vtscr - Version 1.0} {MIDAS} start:= sd=DayOfMonth() AND sm=Month() AND sy=Year() AND sh=Hour() AND se=Minute(); pv:= MP() * V; denom:= If(ValueWhen(1,start,Cum(V))=0, 1, Cum(V) - ValueWhen(1,start,Cum(V))); Midas:= (Cum(pv) - ValueWhen(1,start,Cum(pv))) / denom; {MIDAS Percent Displacement Bands} UpperBand:= Midas * (1 + (UB/100)); LowerBand:= Midas * (1 - (LB/100)); - Click the “Save” icon in the toolbar to finish building the anchored Vwap channel indicator.
To attach the indicator to a chart (Figure 15), click the right mouse button within the chart window and then select “Add Indicator” → “TASC - 07/2010 - Anchored Vwap Channel” from the indicator list.
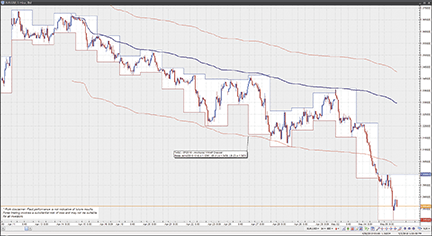
Figure 15: VT TRADER, ANCHORED VWAP CHANNEL. Here is the anchored VWAP channel indicator on a EUR/USD one-hour candlestick chart.
To learn more about VT Trader, visit www.cmsfx.com.
Risk disclaimer: Forex trading involves a substantial risk of loss and may not be suitable for all investors.
![]() METASTOCK: ANCHORED VWAP CHANNEL — COLES ARTICLE CODE
METASTOCK: ANCHORED VWAP CHANNEL — COLES ARTICLE CODE
The MetaStock code for plotting the channel on the daily charts and intraday charts can be seen below.
When the indicator is dropped onto a chart, MetaStock will prompt for the percentage displacement for the upper and the lower band. The fitting to the first significant swing high and low is a matter of trial and error. Readers familiar with Paul Levine’s topfinder/bottomfinder indicator will appreciate the similarity between how the TB-F indicator is fitted to the first significant pullback and how the M-DC is fitted: both involve a visual fit between data inputted and the best possible connection to the price extreme.
Programming the PDB indicator in MetaStock for daily charts
{user defined input}
sm:=Input(“startng month”, 1,12,1);
sd:= Input(“starting day of month”, 1,31,1);
sy:=Input(“starting year”, 1980,2100,2000);
start:=sd=DayOfMonth() AND sm=Month() AND sy=Year();
{mid price}
pv:=MP()*V;

{Midas calculation}
denom:=If(Cum(V)-ValueWhen(1,start,Cum(V))=0,1, Cum(V)-ValueWhen(1,start,Cum(V)));
If(BarsSince(start), (Cum(pv)-ValueWhen(1,start,Cum(pv)))/denom,MP());
{Adding percent displacement bands}
M:=If(BarsSince(start), (Cum(pv)-ValueWhen(1,start,Cum(pv)))/denom,MP());

Q1:=Input(“percentage-upper”,1,50,1);
M * 1 + (Q1/100));
Q2:=Input(“percentage-lower”,1,50,1);
M * (1 - ( Q2/100))


Programming the PDB indicator in MetaStock for intraday charts
{user defined input}
sm:=Input(“startng month”, 1,12,1);
sd:= Input(“starting day of month”, 1,31,1);
sh:=Input(“hour”,1,24,1);
se:=Input(“minute”,0,60,0);
start:=sd=DayOfMonth() AND sm=Month() AND 2009 AND sh=Hour() AND se=Minute();
{mid price}
pv:=MP()*V;
{Midas calculation}
denom:=If(Cum(V)-ValueWhen(1,start,Cum(V))=0,1,Cum(V)-ValueWhen(1,start,Cum(V)));
If(BarsSince(start),(Cum(pv)-ValueWhen(1,start,Cum(pv)))/denom,MP());
{Adding percent displacement bands}
M:=If(BarsSince(start),(Cum(pv)-ValueWhen(1,start,Cum(pv)))/denom,MP());

Q1:=Input(“percentage-upper”,0.001,2,0.001);
M * (1 + (Q1/100));
Q2:=Input(“percentage-lower”,0.001,4,0.001);
M * (1 - (Q2/100))