NEW TECHNIQUES
Getting Clear With Short-Term Swings
Does an indicator that works on all time frames, requires no calculation, and has no delay sound too good to be true? It’s not.
The technician’s unending task is to find a signal in a sea of data. Price patterns can be choppy, chaotic, and wiggly. Sometimes the technician tries to smooth the upward and downward surges in price action in order to make the price movement easier to interpret. But this smoothing can reduce his or her indicators’ sensitivity to the immediate direction of the price.
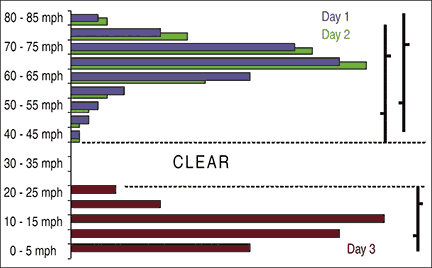
The Clear method, a new technique for identifying the direction of short-term price swings, identifies the direction of the current price swing and the precise day when price direction changes. It works on all time frames, requires no calculation, and has no delay. It is applicable to all stocks, commodities, and indexes. The Clear method is unique because, unlike most technical indicators, it does not use the opening price or the closing price. Instead, it uses the range (length) of the price bar. It is effective because it borrows from a basic statistical concept: if two distributions do not overlap, they can be considered different.
(A note to our statistician friends: this paper is not intended to examine the subtleties of sampling errors, sample size, covariance, confidence intervals, or any other statistical description. I am merely adapting a statistical concept for the purpose of analyzing price action.)

Figure 1: Histograms of the speed of cars on the freeway. Day 1 is shown in blue. Day 2 is shown in green. Day 3 is shown in maroon. Day 3 is “clear” of days 1 and 2.