TRADERS’ TIPS
September 2010
Here is this month’s selection of Traders’ Tips, contributed by various developers of technical analysis software to help readers more easily implement some of the strategies presented in this and other issues.
Other code appearing in articles in this issue is posted in the Subscriber Area of our website at https://technical.traders.com/sub/sublogin.asp. Login requires your last name and subscription number (from mailing label). Once logged in, scroll down to beneath the “Optimized trading systems” area until you see “Code from articles.” From there, code can be copied and pasted into the appropriate technical analysis program so that no retyping of code is required for subscribers.
You can copy these formulas and programs for easy use in your spreadsheet or analysis software. Simply “select” the desired text by highlighting as you would in any word processing program, then use your standard key command for copy or choose “copy” from the browser menu. The copied text can then be “pasted” into any open spreadsheet or other software by selecting an insertion point and executing a paste command. By toggling back and forth between an application window and the open web page, data can be transferred with ease.
This month’s tips include formulas and programs for:
- TRADESTATION: THE CLEAR METHOD
- METASTOCK: THE CLEAR METHOD
- eSIGNAL: THE CLEAR METHOD
- WEALTH-LAB: THE CLEAR METHOD
- WORDEN BROTHERS STOCKFINDER: THE CLEAR METHOD
- AMIBROKER: THE CLEAR METHOD
- NEUROSHELL TRADER: THE CLEAR METHOD
- AIQ: THE CLEAR METHOD
- TRADERSSTUDIO: THE CLEAR METHOD
- TRADECISION: THE CLEAR METHOD
- NINJATRADER: THE CLEAR METHOD
- NEOTICKER: THE CLEAR METHOD
- WAVE59: THE CLEAR METHOD
- UPDATA: THE CLEAR METHOD
- VT TRADER: LINEAR REGRESSION CROSS-TRADING SYSTEM
- TRADESTATION — BLACK ARTICLE CODE
![]() TRADESTATION: THE CLEAR METHOD
TRADESTATION: THE CLEAR METHOD
In his article in this issue, “Getting Clear With Short-Term Swings,” author Ron Black provides a straightforward indicator based on price clearing the lowest high after a downtrend, or price clearing a highest low after an uptrend. We have adapted the article’s code to display the clear signal (SwingTrendLines) and have provided a PaintBar study and simple strategy.
To download the EasyLanguage code for this study, go to the TradeStation and EasyLanguage Support Forum (https://www.tradestation.com/Discussions/forum.aspx?Forum_ID=213). Search for the file “SwingLine.eld.” The original code (“Swing-Line”) by Black is included in the .eld file.
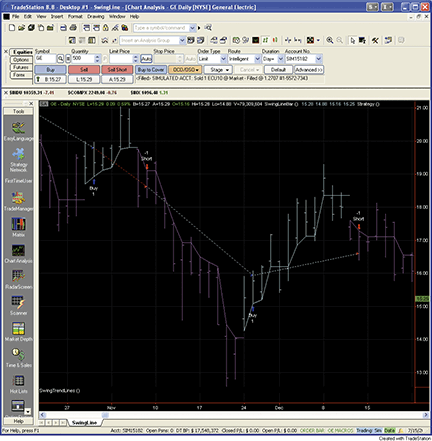
Figure 1: TRADESTATION, CLEAR METHOD. Here is an example of the SwingTrendLines indicator, SwingLineBar paint-bar study, and SwingLine Trader strategy applied to a daily chart of General Electric (GE) from October 22, 2008 to December 22, 2008. Note that the trades occur on the day after a daily low is established clear of the swing line. Since the daily low is not known with certainty until after the market closes, the entry is made on the second bar after clearing the swing line.
This article is for informational purposes. No type of trading or investment recommendation, advice, or strategy is being made, given, or in any manner provided by TradeStation Securities or its affiliates.
Indicator:  SwingTrendLines

variables:
	HighestHigh( High ),
	LowestLow( Low ),
	LowestHigh( High ),
	HighestLow( Low ),
	upsw( 0 ) ;

{Find Swing Direction}
if upsw = 1 then
	begin
	if High > HighestHigh then
		HighestHigh = High ;
		{update HighestHigh, HighestLow}
	if Low > HighestLow then
		HighestLow = Low ;
	if High < HighestLow then
		begin {swing changes to down}
		upsw = 0 ;
		LowestLow = Low ;
		LowestHigh = High ;
		end ;
	end ;

if upsw = 0 then
	begin
	if Low < LowestLow then
		LowestLow = Low ;
		{update LowestLow, LowestHigh}
	if High < LowestHigh then
		LowestHigh = High ;
	if Low > LowestHigh then
		begin {swing changes to up}
		upsw = 1 ;
		HighestHigh = High ;
		HighestLow = Low ;
		end ;
	end ;

if upsw[1] = 1 and upsw = 0 then
	Begin
	Value1 = TL_New( Date[1], Time[1],
		HighestLow[1], Date, Time, HighestLow[1] ) ;
	TL_SetColor( Value1, Cyan ) ;
	end
else if upsw[1] = 0 and upsw = 1 then
	begin
	Value1 = TL_New( Date[1], Time[1], LowestHigh[1],
		Date, Time, LowestHigh[1] ) ;
	TL_SetColor( Value1, Magenta ) ;
	end
else if upsw = 1 then
	begin
	Value1 = TL_New( Date[1], Time[1], HighestLow[1],
		Date, Time, HighestLow ) ;
	TL_SetColor( Value1, Cyan ) ;
	end
else if upsw = 0 then
	begin
	Value1 = TL_New( Date[1], Time[1], LowestHigh[1],
		Date, Time, LowestHigh ) ;
	TL_SetColor( Value1, Magenta ) ;
	end ;

PaintBar: SwingLineBar
variables:
	HighestHigh( High ),
	LowestLow( Low ),
	LowestHigh( High ),
	HighestLow( Low ),
	upsw( 0 ) ;

{Find Swing Direction}
if upsw = 1 then
	begin
	if High > HighestHigh then
		HighestHigh = High ;
		{update HighestHigh, HighestLow}
	if Low > HighestLow then
		HighestLow = Low ;
	if High < HighestLow then
		begin {swing changes to down}
		upsw = 0 ;
		LowestLow = Low ;
		LowestHigh = High ;
		end ;
	end ;

if upsw = 0 then
	begin
	if Low < LowestLow then
		LowestLow = Low ;
		{update LowestLow, LowestHigh}
	if High < LowestHigh then
		LowestHigh = High ;
	if Low > LowestHigh then
		begin {swing changes to up}
		upsw = 1 ;
		HighestHigh = High ;
		HighestLow = Low ;
		end ;
	end ;

if upsw = 1 then
	Begin
	PlotPaintBar( High, Low, Open,
		Close, "SwLine", Cyan ) ;
	end
else if upsw = 0 then
	begin
	PlotPaintBar( High, Low, Open,
		Close, "SwLine", Magenta ) ;
	end ;

Strategy: SwingLine Trader
variables:
	HighestHigh( High ),
	LowestLow( Low ),
	LowestHigh( High ),
	HighestLow( Low ),
	upsw( 0 ) ;

{Find Swing Direction}
if upsw = 1 then
	begin
	if High > HighestHigh then
		HighestHigh = High ;
		{update HighestHigh, HighestLow}
	if Low > HighestLow then
		HighestLow = Low ;
	if High < HighestLow then
		begin {swing changes to down}
		upsw = 0 ;
		LowestLow = Low ;
		LowestHigh = High ;
		end ;
	end ;

if upsw = 0 then
	begin
	if Low < LowestLow then
		LowestLow = Low ;
		{update LowestLow, LowestHigh}
	if High < LowestHigh then
		LowestHigh = High ;
	if Low > LowestHigh then
		begin {swing changes to up}
		upsw = 1 ;
		HighestHigh = High ;
		HighestLow = Low ;
		end ;
	end ;

if upsw = 1 then
	Buy next bar at market
else if upsw = 0 then
	SellShort next bar at market ;
![]() METASTOCK: THE CLEAR METHOD
METASTOCK: THE CLEAR METHOD
Ron Black’s article in this issue, “Getting Clear With Short-Term Swings,” presents an indicator to display the swing line. This can be added to MetaStock with the steps listed here:
- In the Tools menu, select Indicator Builder.
- Click New to open the Indicator Editor for a new indicator.
- Type the name “Swing Line.”
- Click in the larger window and paste or type in the following formula:
upswa:=If(Cum(1)=11, If(H>Ref(H,-1), H, L),
If(PREV>=Ref(H,-1) AND ROC(H,1,$)>0, Max(H,PREV),
If(PREV<=Ref(L,-1) AND ROC(L,1,$)<0, Min(L,PREV),
If(PREV>=Ref(H,-1) AND H<=HHV(L,10), L,
If(PREV<=Ref(L,-1) AND L>=LLV(H,10), H, PREV)))));
upsw:=If(upswa=H, 1, If(upswa=L, 0, PREV));
If(upsw:=1, HHV(L, 10), LLV(H,10))
- Click OK to close the Indicator Editor.
- Click OK to close Indicator Builder.
![]() eSIGNAL: THE CLEAR METHOD
eSIGNAL: THE CLEAR METHOD
For this month’s Traders’ Tip, we’ve provided the formula “ClearSwingLine.efs” based on the code from Ron Black’s article in this issue, “Getting Clear With Short-Term Swings.”
The study is configured to compute on close only and does not contain any formula parameters. A sample chart is shown in Figure 2.
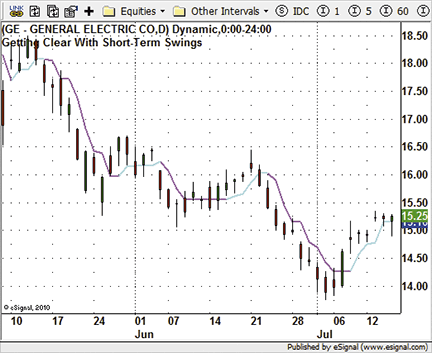
Figure 2: eSIGNAL, CLEAR METHOD
To discuss this study or download complete copies of the formula code, please visit the Efs Library Discussion Board forum under the Forums link from the support menu at www.esignal.com or visit our Efs KnowledgeBase at https://www.esignal.com/support/kb/efs/. The eSignal formula scripts (Efs) are also available for copying and pasting from the Stocks & Commodities website at Traders.com.
Clear swing line.efs

/*********************************
Provided By:
    eSignal (Copyright c eSignal), a division of Interactive Data
    Corporation. 2010. All rights reserved. This sample eSignal
    Formula Script (EFS) is for educational purposes only and may be
    modified and saved under a new file name. eSignal is not responsible
    for the functionality once modified.  eSignal reserves the right
    to modify and overwrite this EFS file with each new release.

Description:
    Getting Clear With Short-Term Swings
Version:            1.00  07/13/2010

Formula Parameters:                     Default:
    Line or Color Bars                  Line

Notes:
   The related article is copyrighted material. If you are not a subscriber
    of Stocks & Commodities, please visit www.traders.com.

**********************************/
var bInit = false;
var bVersion = null;

function preMain() {
    setPriceStudy(true);
    setShowTitleParameters(false);
    setStudyTitle("Getting Clear With Short-Term Swings");
    setShowCursorLabel(true, 0);
    setCursorLabelName("SwLine", 0);
    setDefaultBarFgColor(Color.cyan, 0);
    setPlotType(PLOTTYPE_INSTANTCOLORLINE, 0);
    setDefaultBarThickness(2, 0);
 }

var upsw = 0;
var xHigh = null;
var xLow = null;
var nHHigh = 0;
var nHLow = 0;
var nLHigh = 0;
var nLLow = 0;

function main() {
var nBarState = getBarState();
var nHigh = 0;
var nLow = 0;
var nResult = 0;
    if (bVersion == null) bVersion = verify();
    if (bVersion == false) return;
    if (!bInit) {
        xHigh = high();
        xLow = low();
        nHHigh = xHigh.getValue(0);
        nHLow = xLow.getValue(0);
        nLHigh = xHigh.getValue(0);
        nLLow = xLow.getValue(0);
        bInit = true;
    }
        nHigh = xHigh.getValue(-1);
        nLow = xLow.getValue(-1);
        if (upsw == 1) {
            if (nHigh > nHHigh) nHHigh = nHigh;
            if (nLow > nHLow) nHLow = nLow;
            if (nHigh < nHLow && nBarState == BARSTATE_NEWBAR) {
                upsw = 0;
                nLLow = nLow;
                nLHigh = nHigh;
            }
        } else {
            if (nLow < nLLow) nLLow = nLow;
            if (nHigh < nLHigh) nLHigh = nHigh;
            if (nLow > nLHigh && nBarState == BARSTATE_NEWBAR) {
                upsw = 1;
                nHHigh = nHigh;
                nHLow = nLow;
            }
        }
    if(upsw == 1) {
        nResult = nHLow;
        setBarFgColor(Color.cyan);
    }
    if(upsw == 0)  {
        nResult = nLHigh;
        setBarFgColor(Color.magenta);
    }
    if (nResult == 0) return;
    return nResult;
}

function verify() {
    var b = false;
    if (getBuildNumber() < 779) {
        drawTextAbsolute(5, 35, "This study requires version 8.0 or later.",
            Color.white, Color.blue, Text.RELATIVETOBOTTOM|Text.RELATIVETOLEFT|Text.BOLD|Text.LEFT,
            null, 13, "error");
        drawTextAbsolute(5, 20, "Click HERE to upgrade.@URL=https://www.esignal.com/download/default.asp",
            Color.white, Color.blue, Text.RELATIVETOBOTTOM|Text.RELATIVETOLEFT|Text.BOLD|Text.LEFT,
            null, 13, "upgrade");
        return b;
    } else {
        b = true;
    }
    return b;
}
![]() WEALTH-LAB: THE CLEAR METHOD
WEALTH-LAB: THE CLEAR METHOD
The accompanying WealthScript C# code demonstrates how to generate the Clear method swing line and plot, as described in Ron Black’s article in this issue, “Getting Clear With Short-Term Swings.”
We elected to plot manually using DrawLine instead of using the PlotSeries statements in order to show the transitions, as in the article’s charts. While Black wasn’t necessarily advocating the method as a standalone trading strategy, we added a stop-and-reverse strategy based on the Clear method as a matter of interest.
In a five-year raw profit backtest using daily bars, only five of the Dow 30 symbols returned a profit (excluding commissions). An idea for another test would be to take “clear” trades in lower time frames but only in the direction of the larger trend. A sample chart is shown in Figure 3.
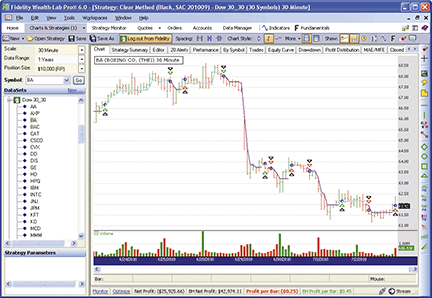
Figure 3: WEALTH-LAB, CLEAR METHOD. The clear method is certain to get you quickly into new trends, but you’ll have to live through the whipsaws along the way as with other trend-following strategies.
WealthScript Code (C#):
using System;
using System.Collections.Generic;
using System.Text;
using System.Drawing;
using WealthLab;
using WealthLab.Indicators;

namespace WealthLab.Strategies
{
   public class ClearMethod : WealthScript
   {
      protected override void Execute()
      {
         Color clr = Color.Cyan;
         DataSeries swingLine = new DataSeries(Bars, "Clear Series");
         DataSeries swingDir = new DataSeries(Bars, "Swing Direction");
                  // init to swing is up, lowest high
         double HH = High[0];
         double LH = HH;
         double HL = Low[0];
         double LL = HL;
         bool upSwing = true;
         swingDir[0] = -1;
         swingLine[0] = LL;

         for(int bar = 1; bar < Bars.Count; bar++)
         {
            double hi = High[bar];
            double lo = Low[bar];
            if (upSwing)
            {
               if (lo > HL) HL = lo;
               if (hi < HL)
               {
                  upSwing = false;
                  LH = hi;
               }
            }
            else
            {
               if (hi < LH) LH = hi;
               if (lo > LH)
               {
                  upSwing = true;
                  HL = lo;
               }
            }

            if (upSwing)
            {
               swingLine[bar] = HL;
               swingDir[bar] = -1;
            }
            else
            {
               swingLine[bar] = LH;
               swingDir[bar] = 0;
            }

            /* Plot the line manually to show crossovers and transitions */
            if (swingDir[bar] != swingDir[bar-1])
            {
               clr = (swingDir[bar] != 0) ? Color.Fuchsia : Color.Cyan;
               DrawLine(PricePane, bar - 1, swingLine[bar-1], bar, swingLine[bar-1], clr, LineStyle.Solid, 2);

            }
            else
            {
               clr = (swingDir[bar] != 0) ? Color.Cyan : Color.Fuchsia;
               DrawLine(PricePane, bar - 1, swingLine[bar-1], bar, swingLine[bar], clr, LineStyle.Solid, 2);
            }
         }

         /* Basic Trend Following "Clear Method" Strategy */
         BuyAtMarket(1);
         for(int bar = 1; bar < Bars.Count; bar++)
         {
            Position p = LastPosition;
            if (swingDir[bar] != 0)   // trend up
            {
               if (IsLastPositionActive && p.PositionType == PositionType.Short)
               {
                  CoverAtMarket(bar + 1, p);
                  BuyAtMarket(bar + 1);
               }
            }
            else
            {
               if (IsLastPositionActive && p.PositionType == PositionType.Long)
               {
                  SellAtMarket(bar + 1, p);
                  ShortAtMarket(bar + 1);
               }
            }
         }
      }
   }
}
![]() WORDEN BROTHERS STOCKFINDER: THE CLEAR METHOD
WORDEN BROTHERS STOCKFINDER: THE CLEAR METHOD
In StockFinder, you can use RealCode to paint the upswings and downswings described in Ron Black’s article in this issue, “Getting Clear With Short-Term Swings.” RealCode is based on the Microsoft Visual Basic.Net framework and uses the Visual Basic (VB) language syntax. RealCode is compiled into a .Net assembly and run by the StockFinder application.
To paint the price plot using RealCode, click the Paint Scheme button, then click “New Paint Scheme,” then click the Edit link to open the editor. See Figure 4.
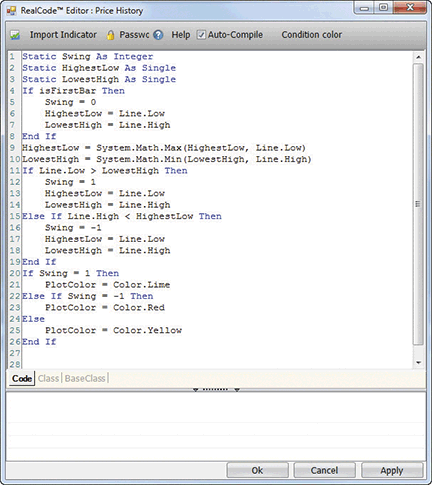
Figure 4: STOCKFINDER, CODE. Here is the paint scheme code in RealCode for Ron Black’s method of identifying upswings and downswings.
Once you’ve coded the paint scheme, save it, and it will become part of your paint scheme library.
The chart shown in Figure 5 is a three-day candlestick chart of US Bancorp, and the paint scheme is indicating the beginning of an upswing.
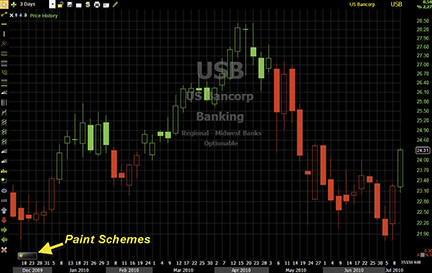
Figure 5: STOCKFINDER, CLEAR METHOD. Here is a three-day candlestick chart of US Bancorp (USB) with upswings painted green and downswings painted red.
To download the StockFinder software and get a free trial, go to www.StockFinder.com.
![]() AMIBROKER: THE CLEAR METHOD
AMIBROKER: THE CLEAR METHOD
Implementing the swing line indicator presented in Ron Black’s article in this issue (“Getting Clear With Short-Term Swings”) is easy in AmiBroker Formula Language.
A ready-to-use formula for the article is presented in Listing 1. To use it, enter the formula in the Afl Editor, then press the Insert Indicator button. To select an anchor point, simply click on the chart in the desired place. AmiBroker will plot the price bar chart with color-coded swings along with a swing line, as shown in Figure 6.
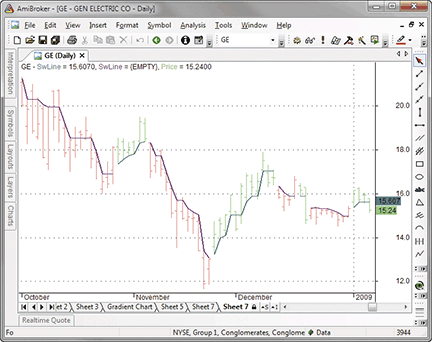
Figure 6: AMIBROKER, THE CLEAR METHOD. Here is the swing line along with color-coded swings on a price chart of GE.
LISTING 1

upsw = 0;
Hh = Lh = H[ 0 ];
Hl = Ll = L[ 0 ];

for( i = 0; i < BarCount; i++ )
{
  Ch = H[ i ];
  Cl = L[ i ];

  if( upsw == 1 )
  {
    Hh = Max( Ch, Hh );
    hL = Max( Cl, Hl );

    if( Ch < Hl )
    {
      upsw = 0;
      Ll = Cl;
      Lh = Ch;
    }
  }

  if( upsw == 0 )
  {
    Ll = Min( Cl, Ll );
    Lh = Min( Ch, Lh );

    if( Cl > Lh )
    {
      upsw = 1;
      Hh = Ch;
      Hl = Cl;
    }
  }

  Hla[ i ] = Hl;
  Lha[ i ] = Lh;
  upswa[ i ] = upsw;
}

Plot( IIf( upswa == 1, Hla, Null ), "SwLine", ColorRGB( 64, 128, 128), styleThick );
Plot( IIf( upswa == 0, Lha, Null ), "SwLine", ColorRGB( 128, 64, 128), styleThick  );

Plot( C, "Price", IIf( upswa == 1,
      ColorBlend( colorGreen, colorWhite ),
      ColorBlend( colorRed, colorWhite )), styleBar);
![]() NEUROSHELL TRADER: THE CLEAR METHOD
NEUROSHELL TRADER: THE CLEAR METHOD
Ron Black’s swing line technique (described in his article in this issue, “Getting Clear With Short-Term Swings”) can be recreated in a standard programming language such as C, C++, Power Basic, or Delphi. First, convert the EasyLanguage programming code given in Black’s article to the standard programming language of your choice and then insert the compiled result into your NeuroShell Trader chart by doing the following:
- Select “New Indicator…” from the Insert menu.
- Choose the External Program & Library Calls category.
- Select the appropriate External Dll Call indicator.
- Set up the parameters to match your Dll.
- Select the Finished button.
Users of NeuroShell Trader can go to the Stocks & Commodities section of the NeuroShell Trader free technical support website to download a copy of this or any past Traders’ Tips.
A sample chart is shown in Figure 7.
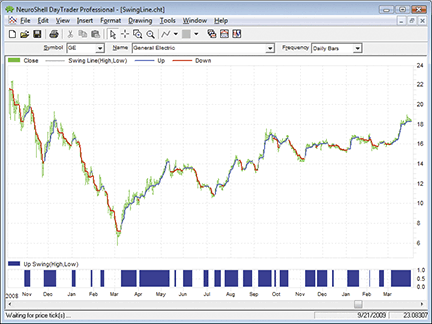
Figure 7: NEUROSHELL TRADER, CLEAR METHOD. This NeuroShell Trader chart shows the swing line and the upswing value.
![]() AIQ: THE CLEAR METHOD
AIQ: THE CLEAR METHOD
The Aiq code given here, which is based on Ron Black’s article in this issue, “Getting Clear With Short-Term Swings,” differs somewhat from the author’s approach. The Aiq code that I am presenting can be used to generate Eds reports that show the current status of the short-term swings as either “UP” or “DN.”
Note that this code is not meant to plot any lines or indicators. The reports are set up on the Eds file that is posted at our website, as shown in Figure 8. I highly recommend that the Eds file be downloaded from our website (www.Traders-EdgeSystems.com) rather than retyping or pasting the code into a new Eds file because the reports have been set up on the Eds file that I created for this article. The author’s code is fixed on one-bar pivots, but I have added an input parameter for the pivot strength.
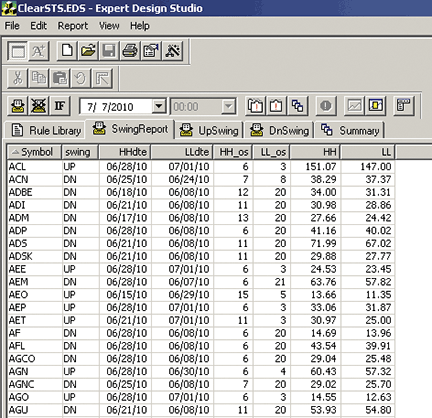
Figure 8: AIQ SYSTEMS, CLEAR METHOD. This chart shows a portion of the SwingReport for 7/14/2010.
The length of the swings can be varied by increasing the pivot strength higher than the current setting of 2. In Figure 8, I show a portion of one of the Eds reports. In Figure 9, I show a portion of the summary report, which has counts of how many stocks on 7/7/2010 were in upswings or downswings. The “SwingReport” shows all stocks that passed the minimum price and volume settings of $10 and one million average daily volume. Of the 1,033 stocks that passed the price and volume filter, 256 were in upswings and 777 were in downswings.
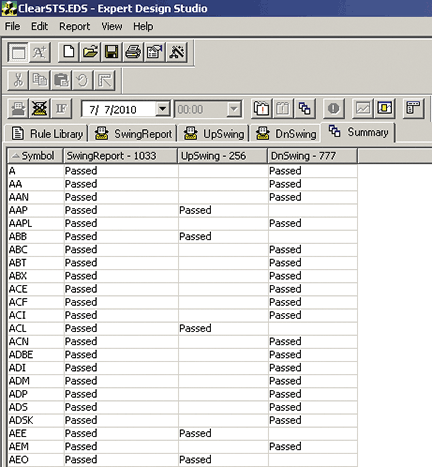
Figure 9: AIQ SYSTEMS, CLEAR METHOD. This chart shows a portion of the summary report for 7/14/2010, which has counts of how many stocks were in upswings or downswings.
Using the Breadth Builder in Aiq, a breadth indicator could be created that would show the daily count and daily percentages of stocks in upswings or downswings, and this could be plotted on a chart as a market breadth indicator. Due to time constraints, I did not generate this indicator.
The code and Eds file can be downloaded from www.TradersEdgeSystems.com/traderstips.htm.
!! GETTING CLEAR WITH SHORT-TERM SWINGS
!  Author: Ron Black, TASC September 2010
!  Coded by: Richard Denning 7/14/2010
!  www.TradersEdgeSystems.com

! INPUTS
	Periods 	is 252.  ! For pivot finder
	Strength	is 2. 	 ! # of bars on each side of pivot
	MinPrice	is 10.	 ! Minimum price for reports
	MinVolume	is 10000.! Minimum average volume
! ABBREVIATIONS:
	H		is [high].
	L		is [low].
	OTD 	is Offsettodate(Month(),Day(),Year()).
	LowR 	is LoVal([low],(2*strength)+1).
	LowM		is Val([low],strength).
	LS 		if  LowR = LowM.
	HighR		is HiVal([high],(2*strength)+1).
	HighM 		is Val([high],strength).
	HS 		if  HighR = HighM.

! FIND FIRST PIVOT LOW
     LT1 		is scanany(LS,periods) then OTD .
      LO1 		is ^LT1 + Strength.
    	LO1dte 		is SetDate(LO1).
	LowLO1 	is val([low],^LO1).

! FIND SECOND PIVOT LOW THAT IS BEFORE THE FIRST PIVOT LOW
	LT2 		is scanany(LS,periods,LO1) then OTD.
	LO2 		is ^LT2 + Strength.
     LO2dte 		is SetDate(LO2).
    	LowLO2	 	is val([low],^LO2).

! FIND THIRD PIVOT LOW THAT IS BEFORE THE SECOND PIVOT LOW
	LT3 		is scanany(LS,periods,LO2) then OTD.
	LO3 		is ^LT3 + Strength.
	LO3dte 		is SetDate(LO3).
	LowLO3 	is val([low],^LO3).

! FIND FORTH PIVOT LOW THAT IS BEFORE THE THIRD PIVOT LOW
	LT4 		is scanany(LS,periods,LO3) then OTD.
	LO4 		is ^LT4 + Strength.
	LO4dte 		is SetDate(LO4).
	LowLO4		is val([low],^LO4).

! FIND FIFTH PIVOT LOW THAT IS BEFORE THE FORTH PIVOT LOW
	LT5 		is scanany(LS,periods,LO4) then OTD.
	LO5 		is ^LT5 + Strength.
	LO5dte 		is SetDate(LO5).
	LowLO5		is val([low],^LO5).

! FIND FIRST PIVOT HIGH
     HT1		is scanany(HS,periods,0) then OTD .
    HO1		is ^HT1 + Strength.
	HO1dte	 	is SetDate(HO1).
	HighHO1	is val([high],HO1).

! FIND SECOND PIVOT HIGH THAT IS BEFORE THE FIRST PIVOT HIGH
	HT2 		is scanany(HS,periods,HO1) then OTD.
	HO2 		is ^HT2 + Strength.
	HO2dte		is SetDate(HO2).
	HighHO2	is val([high],HO2).

! FIND THIRD PIVOT HIGH THAT IS BEFORE THE SECOND PIVOT HIGH
	HT3 		is scanany(HS,periods,HO2) then OTD.
	HO3 		is ^HT3 + Strength.
	HO3dte	 	is SetDate(HO3).
	HighHO3	is val([high],HO3).

! FIND FORTH PIVOT HIGH THAT IS BEFORE THE THIRD PIVOT HIGH
	HT4 		is scanany(HS,periods,HO3) then OTD.
	HO4 		is ^HT4 + Strength.
	HO4dte		is SetDate(HO4).
	HighHO4 	is val([high],HO4).

! FIND FIFTH PIVOT HIGH THAT IS BEFORE THE FORTH PIVOT HIGH
	HT5 		is scanany(HS,periods,HO4) then OTD.
	HO5 		is ^HT5 + Strength.
	HO5dte 		is SetDate(HO5).
	HighHO5	is val([high],HO5).

! FIND WHICH PIVOTS ARE VERIFIED AS CLEAR
	upsw1	if scanany(L > ^valresult(H,LO1),LO1).
	dnsw1	if scanany(H < ^valresult(L,HO1),HO1).
	upsw2	if scanany(L > ^valresult(H,LO2),LO2).
	dnsw2	if scanany(H < ^valresult(L,HO2),HO2).
	upsw3	if scanany(L > ^valresult(H,LO3),LO3).
	dnsw3	if scanany(H < ^valresult(L,HO3),HO3).
	upsw4	if scanany(L > ^valresult(H,LO4),LO4).
	dnsw4	if scanany(H < ^valresult(L,HO4),HO4).
	upsw5	if scanany(L > ^valresult(H,LO5),LO5).
	dnsw5	if scanany(H < ^valresult(L,HO5),HO5).

! FIND THE MOST RECENT PIVOT OFFSET THAT IS A VERIFIED CLEAR PIVOT
	LL_os	is iff(upsw1,LO1,iff(upsw2,LO2,iff(upsw3,LO3,
		iff(upsw4,LO4,iff(upsw5,LO5,999))))).
	HH_os 	is iff(dnsw1,HO1,iff(dnsw2,HO2,iff(dnsw3,HO3,
		iff(dnsw4,HO4,iff(dnsw5,HO5,999))))).

! GET THE HIGHEST HIGH AND LOWEST LOW VALUES AND DATES OF THE
  ! MOST RECENT VERIFIED CLEAR PIVOTS
	HH	is valresult(H,HH_os).
	LL	is valresult(L,LL_os).
	HHdte	is setdate(HH_os).
	LLdte	is setdate(LL_os).

! DETERMINE WHETHER THE CURRENT SWING IS UP OR DOWN
	upsw	if (LL_os < HH_os and HH_os <> 999)
		or (HH_os = 999 and slope([close],HO5) > 0).
	dnsw	if (LL_os > HH_os and LL_os <> 999)
		or (LL_os = 999 and slope([close],LO5) < 0).
	swing	is iff(upsw,"UP",iff(dnsw,"DN","UNK")).

! REPORTS
	PV if [close] > MinPrice
		and simpleavg([volume],50) > MinVolume.
	SwingReport if PV .
	UpSwing if PV and upsw.
	DnSwing if PV and dnsw.
![]() TRADERSSTUDIO: THE CLEAR METHOD
TRADERSSTUDIO: THE CLEAR METHOD
The TradersStudio code for Ron Black’s article in this issue, “Getting Clear With Short-Term Swings,” is given here.
The TradeStation EasyLanguage code provided in the article can be converted easily to TradersStudio code via the Migration Tool, which is located in the Tools menu. Once I converted the basic code using the Migration Tool, I created a function, “CLEAR_ST,” that returns a “1” if the market is in an upswing and a “0” if the market is in a downswing.
Using the function, I then created an indicator, “CLEAR_ST_IND,” that can be plotted on the chart to see the swing direction. Upswing bars are colored green and downswing bars are colored red. In addition, as shown in Figure 10, the bars are not only colored, but also, there is an indicator in the lower panel that oscillates from zero (downswing) to 1 (upswing).
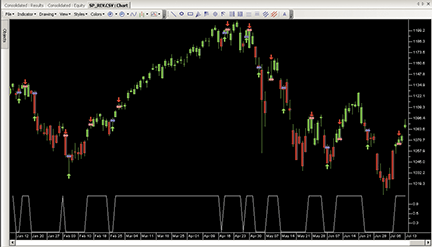
Figure 10: TRADERSSTUDIO, CLEAR METHOD. Here is a sample chart of the SP contract with the swing indicator.
Using the CLEAR_ST swing function, I also created two systems that are always in the market. One trades counter to the swing (CLEAR_CT) and the other trades with the swing (CLEAR_TF). Upon testing the two systems on a portfolio of 38 futures markets, I noticed that mainly the index futures, such as the S&P contract, were able to produce consistent profits using the counterswing system. I used a total of $100 per trade for slippage and commissions round-turn. This turned out to be too much for most of the futures markets to overcome, as both systems showed downsloping equity curves when run on the portfolio of futures markets without the indexes. For the most part, only the index futures showed positive results trading countertrend to the swing indicator.
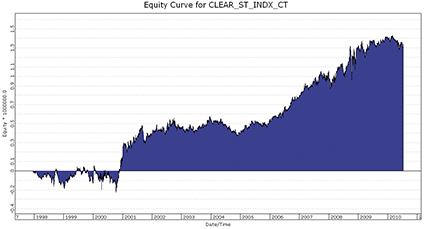
Figure 11: TRADERSSTUDIO, equity curve. Here is a sample chart of the equity curve for countertrend trading for a portfolio of five futures indexes.
In Figure 11, I show the equity curve generated from trading a portfolio of index futures (using data from Pinnacle) for the following markets: DJ, MD, ND, RL, and SP. All index markets showed a positive net profit for the test period (see the table in Figure 12). Only two of the 35 non-index markets showed a net profit when trading countertrend, and only one of the 35 non-index markets showed a net profit when trading in a trend-following mode.
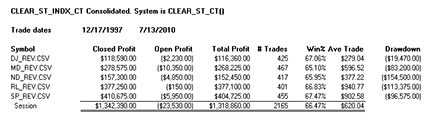
Figure 12: TRADERSSTUDIO, TABLE OF RETURNS. Here are market-by-market results for the countertrend trading system.
This code can be downloaded from the TradersStudio website at www.TradersStudio.com → Traders Resources → FreeCode and also from www.TradersEdgeSystems.com/traderstips.htm.
' GETTING CLEAR WITH SHORT-TERM SWINGS
' Author: Ron Black, TASC September 2010
' Coded by: Richard Denning 7/14/2010
' www.TradersEdgeSystems.com

Function CLEAR_ST()
    Dim hH As BarArray
    Dim lL As BarArray
    Dim lH As BarArray
    Dim hL As BarArray
    Dim upsw As BarArray
    Dim SwLine As BarArray

    If BarNumber=FirstBar Then
        hH = H
        lL = L
        lH = H
        hL = L
        upsw = 0
        SwLine = 0
    End If

    If upsw=1 Then
        If H>hH Then
            hH=H
        End If
        If L>hL Then
            hL=L
        End If
        If H<hL Then
            upsw=0
            lL=L
            lH=H
        End If
    End If
    If upsw=0 Then
        If L<lL Then
            lL=L
        End If
        If H<lH Then
            lH=H
        End If
        If L>lH Then
            upsw=1
            hH=H
            hL=L
        End If
    End If
CLEAR_ST = upsw
End Function
'--------------------------------------------------
Sub CLEAR_ST_TF()
    Dim SwingDir As BarArray
    SwingDir = CLEAR_ST()
    If SwingDir = 1 Then Buy("LE",1,0,Market,Day)
    If SwingDir = 0 Then Sell("SE",1,0,Market,Day)
    MARKETBREAKDOWN2()
End Sub
'--------------------------------------------------
Sub CLEAR_ST_CT()
    Dim SwingDir As BarArray
    SwingDir = CLEAR_ST()
    If SwingDir = 0 Then Buy("LE",1,0,Market,Day)
    If SwingDir = 1 Then Sell("SE",1,0,Market,Day)
    MARKETBREAKDOWN2()
End Sub
'--------------------------------------------------
Sub CLEAR_ST_IND()
    plot1(CLEAR_ST())
    If CLEAR_ST() = 1 Then BarColor(0) = vbGreen
    If CLEAR_ST() = 0 Then barcolor(0) = vbRed
End Sub
'---------------------------------------------------
![]() TRADECISION: THE CLEAR METHOD
TRADECISION: THE CLEAR METHOD
In his article in this issue, “Getting Clear With Short-Term Swings,” Ron Black demonstrates an indicator that finds an effective way to identify and visualize short-term price swings. The method is simple and objective. It requires no calculation and has no delay.
Using Tradecision’s Indicator Builder, first create the swing line indicator:
var
hH:=H;
lL:=L;
lH:=H;
hL:=L;
upsw:=0;
upswprev:=0;
end_var

if HISTORYSIZE < 1 then upswprev:=0;
   else upswprev:=upsw\1\;

       {Find Swing Direction}
if upswprev=1 then begin
   if H>hH\1\ then hH:=H; {update hH, hL}
      else hH := hH\1\;
   if L>hL\1\ then hL:=L;
      else hL := hL\1\;

   if H<hL then begin {swing changes to down}
      upsw:=0;
      lL:=L;
      lH:=H;
   end;
end;

if upswprev=0 then begin
   if L<lL\1\ then lL:=L; {update lL, lH}
      else lL:= lL\1\;
   if H<lH\1\ then lH:=H;
      else lH:= lH\1\;

   if L>lH then begin {swing changes to up}
      upsw:=1;
      hH:=H;
      hL:=L;
   end;
end;

print(1,upswprev);
if upsw=1 then return hL;
if upsw=0 then return lH;
return 0;
To import the strategy into Tradecision, visit the area “Traders’ Tips from TASC Magazine” at www.tradecision.com/support/tasc_tips/tasc_traders_tips.htm or copy the code from the Stocks & Commodities website at www.traders.com.
A sample chart is shown in Figure 13.
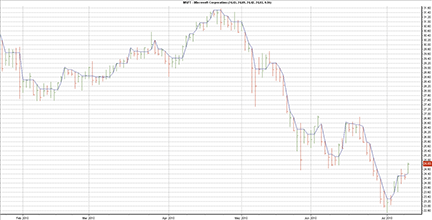
FIGURE 13: TRADECISION, CLEAR METHOD. This chart shows using the highest low and lowest high on Microsoft. When price clears the highest low, a new downtrend begins. When price clears the lowest high, a new uptrend begins.
![]() NINJATRADER: THE CLEAR METHOD
NINJATRADER: THE CLEAR METHOD
The short-term swing indicator discussed in Ron Black’s article in this issue, “Getting Clear With Short-Term Swings,” has now been implemented as an indicator available for download at www.ninjatrader.com/SC/September2010SC.zip.
Once you have it downloaded, from within the NinjaTrader Control Center window, select the menu File → Utilities → Import NinjaScript and select the downloaded file. This indicator is for NinjaTrader version 7 or greater.
You can review the indicator’s source code by selecting the menu Tools → Edit NinjaScript → Indicator from within the NinjaTrader Control Center window and selecting “ShortTermSwings.”
NinjaScript indicators and strategies are compiled Dlls that run native, not interpreted, which provides you with the highest performance possible.
A sample chart implementing the strategy is shown in Figure 14.
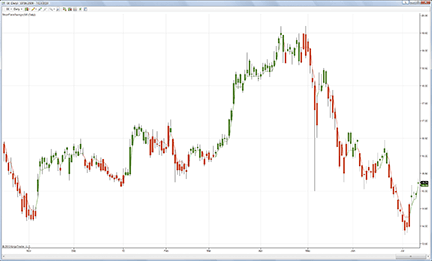
Figure 14: NINJATRADER, CLEAR METHOD. This sample screenshot shows the ShortTermSwings indicator applied to a daily chart of General Electric (GE).
![]() NEOTICKER: THE CLEAR METHOD
NEOTICKER: THE CLEAR METHOD
The swing line indicator featured in Ron Black’s article in this issue, “Getting Clear With Short-Term Swings,” can be implemented in NeoTicker using formula language.
The indicator is named “Tasc Swing Line” (Listing 1) with no parameters and two plots. The result plots hL and lH lines on a chart (Figure 15).
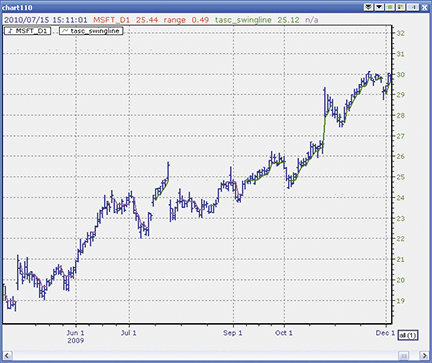
Figure 15: NEOTICKER, CLEAR METHOD. The indicator “TASC Swing Line” plots hL and lH lines.
A downloadable version of this indicator will be available at the NeoTicker blog site (https://blog.neoticker.com).
LISTING 1
$hH := if(firstcall > 0, H, $hH);
$lL := if(firstcall > 0, L, $lL);
$lH := if(firstcall > 0, H, $lH);
$hL := if(firstcall > 0, L, $hL);
$upsw := if(firstcall > 0, 0, $upsw);
$upsw := choose(($upsw = 1) and (H < $hL), 0,
($upsw = 0) and (L > $lH), 1, $upsw);
$hH := if(($upsw = 1) and (H > $hH), H, $hH);
$hL := if(($upsw = 1) and (L > $hL), L, $hL);
$lL := if(($upsw = 1) and (H < $hL), L, $lL);
$lH := if(($upsw = 1) and (H < $hL), H, $lH);
$lL := if(($upsw = 0) and (L < $lL), L, $lL);
$lH := if(($upsw = 0) and (H < $lH), H, $lH);
$hH := if(($upsw = 0) and (L > $lH), H, $hH);
$hL := if(($upsw = 0) and (L > $lH), L, $hL);
plot1 := $hL;
plot2 := $lH;
success1 := $upsw = 1;
success2 := $upsw = 0;
A sample chart implementing the strategy is shown in Figure 15.
![]() WAVE59: THE CLEAR METHOD
WAVE59: THE CLEAR METHOD
In his article in this issue, “Getting Clear With Short-Term Swings,” Ron Black describes how he follows short-term swings using his clear swing line indicator.
We added buy and sell entries to the indicator to see how it would perform in the market. As you can see in Figure 16, it is catching a nice move in early 2010.
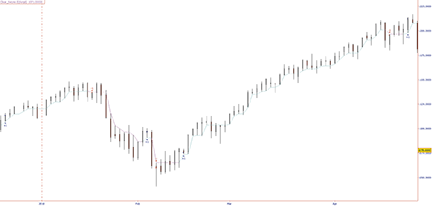
FIGURE 16: WAVE59, CLEAR METHOD. As you can see, Ron Black’s clear swing line indicator catches a nice move in early 2010.
The following script implements this indicator in Wave59. As always, users of Wave59 can download these scripts directly using the QScript Library found at www.wave59.com/library.
Indicator:  R_Black_ClearSwL
#Initialize variables on first bar
if (barnumber==barsback)
{
   hh=h;
   ll=l;
   lh=h;
   hl=l;
   upsw=0;
   swline=0;
}

if (upsw==1)
{
   if (h>hh) hh=h;
   if (l>hl) hl=l;

   if (h<hl)
   {
      upsw=0;
      ll=l;
      lh=h;
   }
}
if (upsw==0)
{
   if (l<ll) ll=l;
   if (h<lh) lh=h;
   if (l>lh)
   {
      upsw=1;
      hh=h;
      hl=l;
   }
}
if (upsw==1)
{
    plot1=hl;
    color1=aqua;
}
if (upsw==0)
{
    plot1=lh;
    color1=fuchsia;
}
if ((upsw==0) and (upsw[1]!=0))
    sell(1,c,"market","onebar");
if ((upsw==1) and (upsw[1]!=1))
    buy(1,c,"market","onebar");
--------------------------------------------
![]() UPDATA: THE CLEAR METHOD
UPDATA: THE CLEAR METHOD
This tip is based on Ron Black’s article in this issue, “Getting Clear With Short-Term Swings.” In the article, Black examines the theme of datasets being distinct when there is no overlap in distributions. From this, the author then develops a swing indicator that changes on directional gaps in the market.
The Updata code for this indicator has been added to the Updata Indicator Library and may be downloaded by clicking the Custom menu and then Indicator Library. Those who cannot access the library due to firewall issues may paste the code shown below into the Updata Custom editor and save it.
NAME The Swing Line
INDICATORTYPE CHART REPLACE
DISPLAYSTYLE CANDLE
@HH=0
@LL=0
@LH=0
@HL=0
@SWING=0

FOR #CURDATE=0 TO #LASTDATE

   If #CURDATE=0
      @HH=HIGH
      @LL=LOW
      @LH=HIGH
      @HL=LOW
   EndIf

   'Find Swing Direction

   If @SWING=1
      if HIGH>@HH
         @HH=HIGH
      endif
      if LOW>@HL
         @HL=LOW
      endif
      'swing changes to down
      if HIGH<@HL
         @SWING=0
         @LL=LOW
         @LH=HIGH
      endif
   EndIf

   If @SWING=0
      if LOW<@LL
         @LL=LOW
      endif
      if HIGH<@LH
         @LH=HIGH
      endif
      'swing changes to up
      if LOW>@LH
         @SWING=1
         @HH=HIGH
         @HL=LOW
      endif
   EndIf

   'Coloured Candlestick Version
   @PLOTOPEN = OPEN
   @PLOT = CLOSE
   @PLOTHIGH = HIGH
   @PLOTLOW = LOW

   If @SWING=1
      COLOUR RGB(0,255,0)
   Else
      COLOUR RGB(255,0,0)
   EndIf

NEXT
A sample chart is shown in Figure 17.
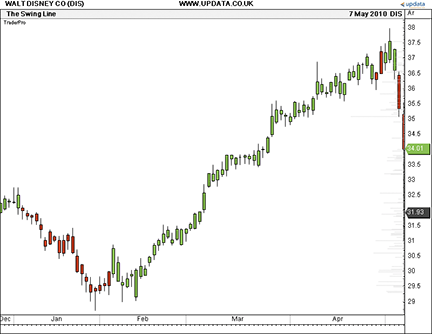
FIGURE 17: UPDATA, CLEAR METHOD. This chart shows the colored candlestick version of the swing line on the Walt Disney stock. Upswings are in green, downswings are in red.
![]() VT TRADER: LINEAR REGRESSION CROSS-TRADING SYSTEM
VT TRADER: LINEAR REGRESSION CROSS-TRADING SYSTEM
This Traders’ Tip is based on an article from the March 2010 issue of S&C titled “My Trading Strategy, Revised” by Leonardo Jafet. In the article, Jafet presents a “bare-bones” version of the linear regression trading system he initially described in his June 2009 S&C article, “Developing My Trading Strategy.”
We’ll be offering Jafet’s linear regression trading system for download in our client forums.
- Ribbon → Technical Analysis menu → Trading Systems group → Trading Systems Builder command → [New] button
- In the General tab, type the following text for each field:
Name: TASC - 09/2010 - Linear Regression System Short Name: tasc_LinRegCross Label Mask: TASC - 09/2010 - Linear Regression System Fast Regression (%fpr%,%fper%) = %FastLinReg% Slow Regression (%spr%,%sper%) = %SlowLinReg% - In the Input Variable(s) tab, create the following variables:
[New] button... Name: fpr , Display Name: Fast Regression Price , Type: price , Default: close
[New] button... Name: fper , Display Name: Fast Regression Periods , Type: integer , Default: 14
[New] button... Name: spr , Display Name: Slow Regression Price , Type: price , Default: close
[New] button... Name: sper , Display Name: Slow Regression Periods , Type: integer , Default: 27
- In the Output Variable(s) tab, create the following variables:
	[New] button...
Var Name: FastLinReg
Name: Fast Regression
* Checkmark: Indicator Output
Select Indicator Output tab
Line Color: blue
Line Width: 2
Ling Style: solid
Placement: Price Frame
[OK] button...

	[New] button...
Var Name: SlowLinReg
Name: Slow Regression
* Checkmark: Indicator Output
Select Indicator Output tab
Line Color: red
Line Width: 2
Ling Style: solid
Placement: Price Frame
[OK] button...

[New] button...
Var Name: LongSignal
Name: Long Signal
* Checkmark: Graphic Enabled
* Checkmark: Alerts Enabled
Select Graphic Bookmark
Font […]: Up Arrow
Size: Medium
Color: Blue
Symbol Position: Below price plot
	Select Alerts Bookmark
		Alert Message: Long signal detected! Fast Regression crossed above Slow Regression.
		Alert Sound: others.wav
[OK] button...

[New] button...
Var Name: ShortSignal
Name: Short Signal
* Checkmark: Graphic Enabled
* Checkmark: Alerts Enabled
Select Graphic Bookmark
Font [...]: Down Arrow
Size: Medium
Color: Red
Symbol Position: Above price plot
	Select Alerts Bookmark
		Alert Message: Short signal detected! Fast Regression crossed below Slow Regression.
		Alert Sound: others.wav
[OK] button...

[New] button...
Var Name: OpenBuy
Name: Open Buy
* Checkmark: Trading Enabled
Select Trading Bookmark
Trading Action: BUY
Trader's Range: 10
[OK] button...

[New] button...
Var Name: CloseBuy
Name: Close Buy
* Checkmark: Trading Enabled
Select Trading Bookmark
Trading Action: SELL
Trader's Range: 10
[OK] button...

[New] button...
Var Name: OpenSell
Name: Open Sell
* Checkmark: Trading Enabled
Select Trading Bookmark
Trading Action: SELL
Trader's Range: 10
[OK] button...

[New] button...
Var Name: CloseSell
Name: Close Sell
* Checkmark: Trading Enabled
Select Trading Bookmark
Trading Action: BUY
Trader's Range: 10
[OK] button...
- In the Formula tab, copy and paste the following formula:
{Provided By: Capital Market Services, LLC & Visual Trading Systems, LLC} {Copyright: 2010} {Description: TASC, March 2010 - "Developments & Improvements; My Trading
Strategy, Revised" by Leonardo Jafet} {File: tasc_LinRegCross.vttrs - Version 1.0} {Fast/Slow Linear Regression Indicators} FastLinReg:= LinReg(fpr,fper); SlowLinReg:= LinReg(spr,sper); {Signal Long and Short} LongSignal:= Cross(FastLinReg,SlowLinReg); ShortSignal:= Cross(SlowLinReg,FastLinReg); {Auto-Trading Functionality; Used in Auto-Trade Mode Only} OpenBuy:= LongSignal=1 AND (EventCount('OpenBuy') = EventCount('CloseBuy')); CloseBuy:= ShortSignal=1 AND (EventCount('OpenBuy') > EventCount('CloseBuy')); OpenSell:= ShortSignal=1 AND (EventCount('OpenSell') = EventCount('CloseSell')); CloseSell:= LongSignal=1 AND (EventCount('OpenSell') > EventCount('CloseSell')); - Click the “Save” icon to finish building the linear regression trading system.
To attach the trading system to a chart (Figure 18), select the “Add Trading System” option from the chart’s contextual menu, select “Tasc → 09/2010 → Linear Regression System” from the trading systems list, and click the [Add] button.
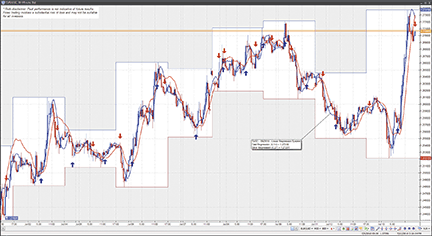
FIGURE 18: VT TRADER. Here is an example of Jafet’s linear regression system on a EUR/USD 30-minute candle chart.
To learn more about VT Trader, visit www.cmsfx.com.
![]() TRADESTATION — BLACK ARTICLE CODE
TRADESTATION — BLACK ARTICLE CODE
A precise picture of the short-term price swings is basic to understanding the market direction. The Clear method is an effective way to identify and visualize short-term price swings. The method benefits the individual trader because it is simple, objective, requires no calculation, and has no delay.
EASYLANGUAGE CODE FOR DISPLAYING THE SWING LINE

Vars: hH(H), lL(L), lH(H), hL(L), upsw(0), SwLine(0);

		{Find Swing Direction}
if upsw=1 then begin
	if H>hH then hH=H;	{update hH, hL}
	if L>hL then hL=L;

	if H<hL then begin {swing changes to down}
		upsw=0;
		lL=L;
		lH=H;
	end;
end;

if upsw=0 then begin
	if L<lL then lL=L;	{update lL, lH}
	if H<lH then lH=H;

	if L>lH then begin	{swing changes to up}
		upsw=1;
		hH=H;
		hL=L;
	end;
end;

if upsw=1 then plot1(hL, "SwLine", cyan);
if upsw=0 then plot1(lH, "SwLine", magenta);