TRADERS’ TIPS
October 2010
Here is this month’s selection of Traders’ Tips, contributed by various developers of technical analysis software to help readers more easily implement some of the strategies presented in this and other issues.
Other code appearing in articles in this issue is posted in the Subscriber Area of our website at https://technical.traders.com/sub/sublogin.asp. Login requires your last name and subscription number (from mailing label). Once logged in, scroll down to beneath the “Optimized trading systems” area until you see “Code from articles.” From there, code can be copied and pasted into the appropriate technical analysis program so that no retyping of code is required for subscribers.
You can copy these formulas and programs for easy use in your spreadsheet or analysis software. Simply “select” the desired text by highlighting as you would in any word processing program, then use your standard key command for copy or choose “copy” from the browser menu. The copied text can then be “pasted” into any open spreadsheet or other software by selecting an insertion point and executing a paste command. By toggling back and forth between an application window and the open web page, data can be transferred with ease.
This month’s tips include formulas and programs for:
- TRADESTATION: SMOOTHED RSI INVERSE FISHER TRANSFORM
- eSIGNAL: SMOOTHED RSI INVERSE FISHER TRANSFORM
- WEALTH-LAB: SMOOTHED RSI INVERSE FISHER TRANSFORM
- AMIBROKER: SMOOTHED RSI INVERSE FISHER TRANSFORM
- NEUROSHELL TRADER: SMOOTHED RSI INVERSE FISHER TRANSFORM
- AIQ: SMOOTHED RSI INVERSE FISHER TRANSFORM
- TRADERSSTUDIO: SMOOTHED RSI INVERSE FISHER TRANSFORM
- TRADECISION: SMOOTHED RSI INVERSE FISHER TRANSFORM
- NINJATRADER: SMOOTHED RSI INVERSE FISHER TRANSFORM
- NEOTICKER: SMOOTHED RSI INVERSE FISHER TRANSFORM
- WAVE59: SMOOTHED RSI INVERSE FISHER TRANSFORM
- UPDATA: SMOOTHED RSI INVERSE FISHER TRANSFORM
- VT TRADER: SMOOTHED RSI INVERSE FISHER TRANSFORM
- WORDEN BROTHERS STOCKFINDER: SMOOTHED RSI INVERSE FISHER TRANSFORM
- METASTOCK — VERVOORT ARTICLE CODE
![]() TRADESTATION: SMOOTHED RSI INVERSE FISHER TRANSFORM
TRADESTATION: SMOOTHED RSI INVERSE FISHER TRANSFORM
Calculation of Sylvain Vervoort’s smoothed Rsi inverse Fisher transform, as presented in his article in this issue, begins by smoothing the price curve with the “rainbow” weighted moving average. This smoothed price curve is used to calculate an Rsi, which is then smoothed with the Vervoort zero-lag exponential moving average. The resulting curve is then transformed with an inverse Fisher filter.
Fisher suggests that a breakout above 12 indicates buying opportunities and a breakdown below 88 indicates selling opportunities. These opportunities should then be studied in the context of a slow stochastic and Vervoort’s own Arsi indicator. Here, we present the code for Vervoort’s rainbow (the indicator code) and Rsi_InverseFisher transforms (indicator and strategy code). The “Sve_RainbowAverage” function is used in the strategy and indicators.
A sample chart is shown in Figure 1.
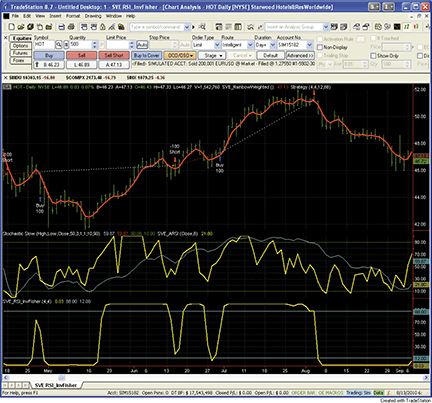
Figure 1: TRADESTATION, Smoothed Rsi Inverse Fisher Transform. Here is a daily chart of Starwood Hotels (HOT) displaying Vervoort’s RSI inverse Fisher transform. The upper subgraph shows price, the “rainbow” weighted average indicator, and unevaluated RSI InverseFisher trade opportunities. The middle subgraph displays a slow stochastic indicator overlaid with Vervoort’s ARSI. The lower subgraph displays the RSI inverse Fisher transform. Breakouts over 12 and under 88 represent initial trade opportunities.
To download the EasyLanguage code for this study, go to the TradeStation and EasyLanguage support forum (https://www.tradestation.com/Discussions/forum.aspx?Forum_ID=213). Search for the file “Sve_Rsi_InvFisher.eld”. A version of Vervoort’s Arsi matching the chart in his article is included.
Function: SVE_RainbowAverage

SVE_RainbowAverage = ( 5 * WAverage( Close, 2 )
 + 4 * WAverage( WAverage( Close, 2 ), 2 )
 + 3 * WAverage( WAverage( WAverage( Close, 2 ), 2 ), 2 )
 + 2 * WAverage( WAverage( WAverage( WAverage( Close, 2 ), 2 ) , 2 ), 2 )
 + WAverage( WAverage( WAverage( WAverage( WAverage( Close, 2 ),  2 ), 2 ), 2 ), 2 )
 + WAverage( WAverage( WAverage( WAverage( WAverage(
    WAverage( Close, 2 ), 2 ), 2 ), 2 ), 2 ), 2 )
 + WAverage( WAverage( WAverage( WAverage( WAverage( WAverage( WAverage(
    Close, 2 ), 2 ), 2 ), 2 ), 2 ), 2 ), 2 )
 + WAverage( WAverage( WAverage( WAverage( WAverage( WAverage( WAverage(
    WAverage( Close, 2 ), 2 ), 2 ), 2 ), 2 ), 2 ), 2 ), 2 )
 + WAverage( WAverage( WAverage( WAverage( WAverage( WAverage( WAverage(
    WAverage( WAverage( Close, 2 ), 2 ), 2 ), 2 ), 2 ), 2 ), 2 ), 2 ), 2 )
 + WAverage( WAverage( WAverage( WAverage( WAverage( WAverage( WAverage(
    WAverage( WAverage( WAverage( Close, 2 ), 2 ), 2 ), 2 ), 2 ), 2 ), 2 ), 2 ), 2 ), 2 ) ) / 20 ;

Strategy: SVE_RSI_InvFisher
inputs:
	RSI_Period( 4 ),
	EMA_Period( 4 ),
	LongTrigger( 12 ),
	ShortTrigger( 88 ) ;

variables:
	X( 0 ),
	EMA1( 0 ),
	EMA2( 0 ),
	Difference( 0 ),
	Z1EMA( 0 ),
	InverseFisher( 0 ) ;

X = 0.1 * ( RSI( SVE_RainbowAverage, RSI_Period ) - 50 ) ;

EMA1 = XAverage( X , EMA_Period ) ;
EMA2 = XAverage( EMA1, EMA_Period ) ;
Difference = EMA1 - EMA2 ;
Z1EMA = EMA1 + Difference ;

InverseFisher = ( ( Power( 2.71828183, 2 * Z1EMA ) - 1 ) /
 ( Power( 2.71828183, 2 * Z1EMA ) + 1 ) + 1 ) * 50 ;

if InverseFisher crosses over LongTrigger then
	Buy next bar at market
else if InverseFisher crosses under ShortTrigger then
	SellShort next bar at market ;

Indicator: SVE_RSI_InvFisher

inputs:
	RSI_Period( 4 ),
	EMA_Period( 4 ) ;

variables:
	X( 0 ),
	EMA1( 0 ),
	EMA2( 0 ),
	Difference( 0 ),
	Z1EMA( 0 ),
	InverseFisher( 0 ) ;

X = 0.1 * ( RSI( SVE_RainbowAverage, RSI_Period ) - 50 ) ;

EMA1 = XAverage( X , EMA_Period ) ;
EMA2 = XAverage( EMA1, EMA_Period ) ;
Difference = EMA1 - EMA2 ;
Z1EMA = EMA1 + Difference ;

InverseFisher = ( ( Power( 2.71828183, 2 * Z1EMA ) - 1 ) /
 ( Power( 2.71828183, 2 * Z1EMA ) + 1 ) + 1 ) * 50 ;

Plot1( InverseFisher, "InvFisher" ) ;
Plot2( 88 );
Plot3( 12 );

Indicator: SVE_RainbowWeighted

Plot1( SVE_RainbowAverage, "SVE_Rainbow" ) ;
This article is for informational purposes. No type of trading or investment recommendation, advice, or strategy is being made, given, or in any manner provided by TradeStation Securities or its affiliates.
![]() eSIGNAL: SMOOTHED RSI INVERSE FISHER TRANSFORM
eSIGNAL: SMOOTHED RSI INVERSE FISHER TRANSFORM
For this month’s Traders’ Tip, we’ve provided the formula, “Sve_InvFish_Rsi.efs,” based on the formula code from Sylvain Vervoort’s artidscle in this issue, “A Smoothed Rsi Inverse Fisher Transform.”
The study contains formula parameters to set the Rsi and Ema periods, which may be configured through the Edit Studies window (Advanced Chart menu → Edit Studies).
To discuss this study or download complete copies of the formula code, please visit the Efs Library Discussion Board forum under the Forums link from the Support menu at www.esignal.com or visit our Efs KnowledgeBase at https://www.esignal.com/support/kb/efs/. The eSignal formula scripts (Efs) are also available for copying and pasting from the Stocks & Commodities website at Traders.com.
A sample chart is shown in Figure 2.
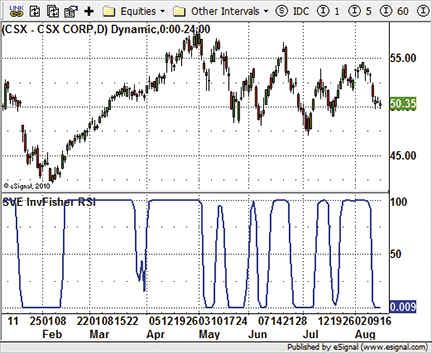
Figure 2: eSIGNAL, Smoothed Rsi Inverse Fisher Transform
/*********************************
Provided By:
    eSignal (Copyright c eSignal), a division of Interactive Data
    Corporation. 2010. All rights reserved. This sample eSignal
    Formula Script (EFS) is for educational purposes only and
    may be modified and saved under a new file name. eSignal
    is not responsible for the functionality once modified. eSignal
    reserves the right to modify and overwrite this EFS file with
    each new release.

Description:
    A Smoothed RSI Inverse Fisher Transform
    Version:            1.00  08/10/2010

Formula Parameters:                     Default:
    RSI Period                          4
    EMA Period                         4
Notes:
    The related article is copyrighted material. If you are not a
    subscriber of Stocks & Commodities, please visit
    www.traders.com.

**********************************/
var fpArray = new Array();
var bInit = false;
var bVersion = null;

function preMain() {
    setPriceStudy(false);
    setShowCursorLabel(true);
    setShowTitleParameters(false);
    setStudyTitle("SVE InvFisher RSI");
    setCursorLabelName("SVE InvFisher RSI", 0);
    setDefaultBarFgColor(Color.blue, 0);
    setPlotType(PLOTTYPE_LINE, 0);
    setDefaultBarThickness(2, 0);
    var x=0;
    fpArray[x] = new FunctionParameter("RSIPeriod", FunctionParameter.NUMBER);
	with(fpArray[x++]){
        setName("RSI Period");
        setLowerLimit(2);
        setUpperLimit(30);
        setDefault(4);
    }
    fpArray[x] = new FunctionParameter("EMAPeriod", FunctionParameter.NUMBER);
	with(fpArray[x++]){
        setName("EMA Period");
        setLowerLimit(1);
        setUpperLimit(100);
        setDefault(4);
    }
}

var xSVEInvFisherRSI = null;

function main(RSIPeriod, EMAPeriod) {
var nBarState = getBarState();
var nSVEInvFisherRSI = null;
    if (bVersion == null) bVersion = verify();
    if (bVersion == false) return;
    if (nBarState == BARSTATE_ALLBARS) {
        if (RSIPeriod == null) RSIPeriod = 4;
        if (EMAPeriod == null) EMAPeriod = 4;
    }
    if (!bInit) {
        xSVEInvFisherRSI = efsInternal("Calc_SVEInvFisherRSI", RSIPeriod, EMAPeriod);
        bInit = true;
    }
    nSVEInvFisherRSI = xSVEInvFisherRSI.getValue(0);
    if (nSVEInvFisherRSI == null) return;
    return nSVEInvFisherRSI;
}

var bSecondInit = false;
var xRainbW = null;
var xValueX = null;
var xEMA1 = null;
var xEMA2 = null;

function Calc_SVEInvFisherRSI(RSIPeriod, EMAPeriod) {
var nRes = 0;
var nEMA1 = 0;
var nEMA2 = 0;
var Difference = 0;
var ZlEma = 0;
    if (!bSecondInit) {
        xRainbW = efsInternal("Calc_RainbW");
        xValueX = efsInternal("Calc_ValueX", RSIPeriod, xRainbW);
        xEMA1 = ema(EMAPeriod, xValueX);
        xEMA2 = ema(EMAPeriod, xEMA1);
        bSecondInit = true;
    }
    nEMA1 = xEMA1.getValue(0);
    nEMA2 = xEMA2.getValue(0);
    if (nEMA2 == null) return;
    Difference = nEMA1 - nEMA2;
    ZlEma = nEMA1 + Difference;
    nRes = ((Math.exp(2 * ZlEma) - 1) / (Math.exp(2 * ZlEma) + 1) + 1) * 50;
    return nRes;
}

var bThirdInit = false;
var xWMA1 = null;
var xWMA2 = null;
var xWMA3 = null;
var xWMA4 = null;
var xWMA5 = null;
var xWMA6 = null;
var xWMA7 = null;
var xWMA8 = null;
var xWMA9 = null;
var xWMA10 = null;

function Calc_RainbW() {
var nRes = 0;
var nWMA1 = 0;
var nWMA2 = 0;
var nWMA3 = 0;
var nWMA4 = 0;
var nWMA5 = 0;
var nWMA6 = 0;
var nWMA7 = 0;
var nWMA8 = 0;
var nWMA9 = 0;
var nWMA10 = 0;
    if (!bThirdInit) {
        xWMA1 = wma(2);
        xWMA2 = wma(2, xWMA1);
        xWMA3 = wma(2, xWMA2);
        xWMA4 = wma(2, xWMA3);
        xWMA5 = wma(2, xWMA4);
        xWMA6 = wma(2, xWMA5);
        xWMA7 = wma(2, xWMA6);
        xWMA8 = wma(2, xWMA7);
        xWMA9 = wma(2, xWMA8);
        xWMA10 = wma(2, xWMA9);
        bThirdInit = true;
    }
    nWMA1 = xWMA1.getValue(0);
    nWMA2 = xWMA2.getValue(0);
    nWMA3 = xWMA3.getValue(0);
    nWMA4 = xWMA4.getValue(0);
    nWMA5 = xWMA5.getValue(0);
    nWMA6 = xWMA6.getValue(0);
    nWMA7 = xWMA7.getValue(0);
    nWMA8 = xWMA8.getValue(0);
    nWMA9 = xWMA9.getValue(0);
    nWMA10 = xWMA10.getValue(0);
    if (nWMA10 == null) return;
    nRes = (5 * nWMA1 + 4 * nWMA2 + 3 * nWMA3 + 2 * nWMA4 +
            nWMA5 + nWMA6 + nWMA7 + nWMA8 + nWMA9 + nWMA10) / 20;
    return nRes;
}

var bFourInit = false;
var xRSI_RainbW = null;

function Calc_ValueX(RSIPeriod, xRainbW) {
var nRes = 0;
var nRSI_RainbW = null;
    if (!bFourInit) {
        xRSI_RainbW = rsi(RSIPeriod, xRainbW);
        bFourInit = true;
    }
    nRSI_RainbW = xRSI_RainbW.getValue(0);
    if (nRSI_RainbW == null) return;
    nRes = 0.1 * (nRSI_RainbW - 50);
    return nRes;
}

function verify() {
    var b = false;
    if (getBuildNumber() < 779) {
        drawTextAbsolute(5, 35, "This study requires version 8.0 or later.",
            Color.white, Color.blue, Text.RELATIVETOBOTTOM|Text.RELATIVETOLEFT|Text.BOLD|Text.LEFT,
            null, 13, "error");
        drawTextAbsolute(5, 20, "Click HERE to upgrade.@URL=https://www.esignal.com/download/default.asp",
            Color.white, Color.blue, Text.RELATIVETOBOTTOM|Text.RELATIVETOLEFT|Text.BOLD|Text.LEFT,
            null, 13, "upgrade");
        return b;
    } else {
        b = true;
    }
    return b;
}
![]() WEALTH-LAB: SMOOTHED RSI INVERSE FISHER TRANSFORM
WEALTH-LAB: SMOOTHED RSI INVERSE FISHER TRANSFORM
Because of the interesting tail-recursion type of construction of the Sve inverse Fisher Rsi indicator presented by Sylvain Vervoort in “A Smoothed Rsi Inverse Fisher Transform” in this issue, we included it with this month’s script.
For the often-neglected bears out there, our WealthScript code includes a simple shorting strategy that triggers an entry when a) Sve_IF_Rsi crosses under 70, and b) price negatively diverges with the Arsi. We employed rudimentary divergence detection that keys off the two Arsi peaks just prior to the Sve_IF_Rsi trigger. The technique compares the relative price peaks corresponding to the Arsi peak bars and, if a negative divergence is detected, the script draws in the divergence lines and initiates a short position. For simplicity, we exit the position after seven bars.
Figure 3 shows a sample chart.
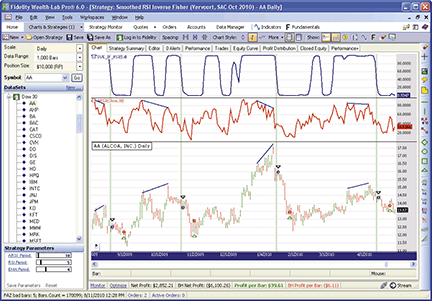
Figure 3: WEALTH-LAB, Smoothed Rsi Inverse Fisher Transform. While the strategy is not expected to work as well on all stocks, the four most recent short trades for Alcoa would have worked out quite well.
WealthScript Code (C#):
using System;
using System.Collections.Generic;
using System.Text;
using System.Drawing;
using WealthLab;
using WealthLab.Indicators;
using TASCIndicators;

namespace WealthLab.Strategies
{
   public class ShortDivergence : WealthScript
   {
      StrategyParameter _rsiPeriod;
      StrategyParameter _emaPeriod;
      StrategyParameter _arsiPeriod;

      public ShortDivergence()
      {
         _arsiPeriod = CreateParameter("ARSI_Period", 10, 2, 200, 20);
         _rsiPeriod = CreateParameter("RSI Period", 4, 2, 30, 1);
         _emaPeriod = CreateParameter("EMA Period", 4, 2, 10, 1);
      }

      public DataSeries SVEInvFisherRSI(int rsiPeriod, int emaPeriod)
      {
         DataSeries rbw = WMA.Series(Close, 2);
         DataSeries sve = 5 * rbw;

         for (int w = 4; w >= -4 ; w--)
         {
            rbw = WMA.Series(rbw, 2);
            if (w > 1 ) sve += (w * rbw);
            else       sve += rbw;
         }
         sve /= 20d;
         sve.Description = "SVE Rainbow";

         DataSeries x = 0.1 * (RSI.Series(sve, rsiPeriod) - 50);
         DataSeries e1 = EMA.Series(x, emaPeriod, EMACalculation.Modern);
         DataSeries e2 = EMA.Series(e1, emaPeriod, EMACalculation.Modern);
         DataSeries z1ema = e1 + (e1 - e2);
         z1ema = (InverseFisher.Series(z1ema) + 1) * 50;
         z1ema.Description = "SVE_IF_RSI(" + rsiPeriod + "," + emaPeriod + ")";
         return z1ema;
      }

      protected override void Execute()
      {
         HideVolume();
         const double d = 1.01;
         int perRSI = _rsiPeriod.ValueInt;
         int perEMA = _emaPeriod.ValueInt;

         /* Create and plot indicators */
         DataSeries arsi = ARSI.Series(Close, _arsiPeriod.ValueInt);
         ChartPane rsiPane = CreatePane(40, true, true);
         PlotSeries(rsiPane, arsi, Color.Red, LineStyle.Solid, 2);

         DataSeries invfish = SVEInvFisherRSI(perRSI, perEMA);
         ChartPane cp = CreatePane(40, true, true);
         PlotSeries(cp, invfish, Color.Navy, LineStyle.Solid, 2);

         /* Trading loop */
         for (int bar = 3 * GetTradingLoopStartBar(4) ; bar < Bars.Count; bar++)
         {
            if (IsLastPositionActive)
            {
               Position p = LastPosition;
               if (bar + 1 - p.EntryBar > 6)
                  ExitAtMarket(bar + 1, p, "Time-based");
            }
            else if (CrossUnder(bar, invfish, 70))
            {
               // check the last two arsi peaks for negative divergence with price
               int pb1 = (int)PeakBar.Value(bar, arsi, 20, PeakTroughMode.Value);
               if (pb1 == -1) continue;
               int pb2 = (int)PeakBar.Value(pb1, arsi, 20, PeakTroughMode.Value);
               if (pb2 == -1) continue;
               if ( Math.Sign(arsi[pb1] - arsi[pb2])==-1 && Math.Sign(High[pb1] - High[pb2])==1)
               {
                  SetBackgroundColor(bar, Color.FromArgb(50, Color.Green));
                  DrawLine(rsiPane, pb2, arsi[pb2], pb1, arsi[pb1], Color.Blue, LineStyle.Solid, 2);
                  DrawLine(PricePane, pb2, High[pb2] *d, pb1, High[pb1]*d, Color.Blue, LineStyle.Solid, 2);
                  ShortAtMarket(bar + 1);
               }
            }
         }
      }
   }
}
![]() AMIBROKER: SMOOTHED RSI INVERSE FISHER TRANSFORM
AMIBROKER: SMOOTHED RSI INVERSE FISHER TRANSFORM
Implementing a smoothed Rsi inverse Fisher transform as described in Sylvain Vervoort’s article in this issue is easy in AmiBroker Formula Language (Afl).
A ready-to-use formula for the article is presented in Listing 1. Note that instead of the difficult-to-read, nested code of the original article, we use iteration (a loop). This results not only in cleaner code but also allows changing the “depth” of the rainbow without the need to recode the formula. In addition to that, we are also providing an asymmetrical Rsi (Arsi) formula in Listing 2. To use it, enter the formula in the Afl editor, then press the Insert Indicator button.
LISTING 1

// TASC Oct 2010 - SVE Inv Fisher

RSIPer = Param("RSI Period", 4, 2, 30 );
EMAper = Param("EMA Period", 4, 1, 100 );

mwiter = C;
RainbW = 0;
for( i = 0; i < 10; i++ )
{
   weight = Max( 5 - i, 1 );
   mwiter = WMA( mwiter, 2 );
   RainbW += weight * mwiter;
}

RainbW /= 20;

x = 0.1 * ( RSIa( RainbW, RSIper ) - 50 );

EMA1 = EMA( x, EMAPer );
EMA2 = EMA( EMA1, EMAPer );
Difference = EMA1 - EMA2;
Z1Ema = EMA1 + Difference;

ex = exp( 2 * Z1EMA );
y = ( ex - 1 )/( ex + 1 );
invfish = 50 * ( y + 1 );

Plot( invfish, "SVE Inverse Fisher RSI", colorRed );

LISTING 2

// ARSI formula
// variable  period version

Period = Param("ARSI Period", 14, 1, 100 );
Chg = C - Ref( C, -1 );
UpCount = Sum( Chg >= 0, Period );
DnCount = Period - UpCount;
UpMove = AMA( Max( Chg, 0 ), Nz( 1/UpCount ) );
DnMove = AMA( Max( -Chg, 0 ), Nz( 1/DnCount ) );

RS = UpMove/DnMove;

ARSI = 100-(100/(1+RS));

Plot( ARSI, "ARSI_V("+Period+")", colorBlue );
A sample chart is shown in Figure 4.
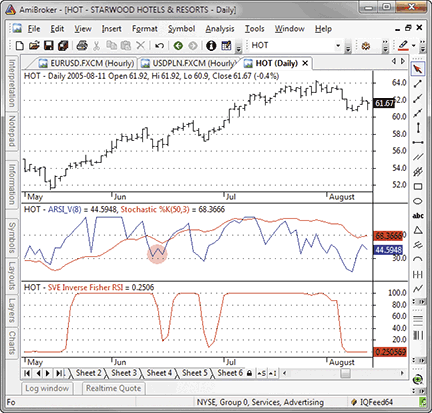
Figure 4: AMIBROKER, Smoothed Rsi Inverse Fisher Transform. Here is a daily chart of HOT (upper pane) with an eight-period asymmetrical RSI, 50-period %K stochastic (middle pane) and a four-period SVE inverse RSI Fisher transform, replicating the chart from Sylvain Vervoort’s article in this issue.
![]() NEUROSHELL TRADER: SMOOTHED RSI INVERSE FISHER TRANSFORM
NEUROSHELL TRADER: SMOOTHED RSI INVERSE FISHER TRANSFORM
The smoothed Rsi inverse Fisher transform described by Sylvain Vervoort in his article in this issue can be easily implemented with a few of NeuroShell Trader’s 800+ indicators. Select “New Indicator…” from the Insert menu and use the Indicator Wizard to set up the following indicators:
Rainb1 = Multiply2(5, LinWgtAvg(Close, 2) )
Rainb2 = Multiply2(4, LinWgtAvg( LinWgtAvg(Close, 2), 2)
Rainb3 = Multiply2(3, LinWgtAvg( LinWgtAvg( LinWgtAvg(Close, 2), 2), 2)
Rainb4 = Multiply2(2, LinWgtAvg( LinWgtAvg( LinWgtAvg( LinWgtAvg(Close, 2), 2), 2), 2)
Rainb5 = LinWgtAvg( LinWgtAvg( LinWgtAvg( LinWgtAvg( LinWgtAvg(Close, 2), 2), 2), 2), 2)
Rainb6 = LinWgtAvg( LinWgtAvg( LinWgtAvg( LinWgtAvg( LinWgtAvg( LinWgtAvg(Close, 2), 2), 2), 2), 2), 2)
Rainb7 = LinWgtAvg( LinWgtAvg( LinWgtAvg( LinWgtAvg( LinWgtAvg( LinWgtAvg( LinWgtAvg(Close, 2), 2), 2), 2), 2), 2), 2)
Rainb8 = LinWgtAvg( LinWgtAvg( LinWgtAvg( LinWgtAvg( LinWgtAvg( LinWgtAvg( LinWgtAvg( LinWgtAvg(Close, 2), 2), 2), 2), 2), 2), 2), 2)
Rainb9 = LinWgtAvg( LinWgtAvg( LinWgtAvg( LinWgtAvg( LinWgtAvg( LinWgtAvg( LinWgtAvg( LinWgtAvg( LinWgtAvg(Close, 2), 2), 2), 2), 2), 2), 2), 2), 2)
Rainb10 = LinWgtAvg( LinWgtAvg( LinWgtAvg( LinWgtAvg( LinWgtAvg( LinWgtAvg( LinWgtAvg( LinWgtAvg( LinWgtAvg( LinWgtAvg(Close, 2), 2), 2), 2), 2), 2), 2), 2), 2), 2)

RainbW = Divide( Add4( Add4( Rainb1, Rainb2, Rainb3, Rainb4 ), Add4( Rainb5, Rainb6, Rainb7, Rainb8 ), Rainb9, Rainb10 ), 20 )

LimitedSwingRSI = Mult2 ( 0.1, Subtract( RSI( RainbW, RSIper ), 50 )
EMA1 = ExpAvg( LimitedSwingRSI, EMAper )
EMA2 = ExpAvg ( EMA1, EMAper )
ZeroLagEMA = Add2( EMA1, Subtract ( EMA1, EMA2 ) )

InvFisherTransform = Multiply2( Add2( Divide( Subtract ( Exp( Multiply2( 2, ZeroLagEMA)), 1 ), Add2( Exp( Multiply2( 2, ZeroLagEMA)), 1 ), 1 ), 50 )
The author suggests using the asymmetric Rsi (which was described in the October 2008 S&C) and a stochastic oscillator to aid in identifying entry and exit signals. To add these indicators to the chart, select “New Indicator…” from the Insert menu and use the Indicator Wizard to add the following:
ARSI( Close, 8 )
Stochastic%D( High, Low, Close, 50, 3)
Readers will find information on the creation of the asymmetric Rsi (Arsi) for NeuroShell Trader in the Stocks & Commodities October 2008 Traders’ Tips. NeuroShell Trader users can download the Arsi custom indicator for free at www.ward.net along with the rest of the indicators described in this article.
A sample chart is shown in Figure 5.
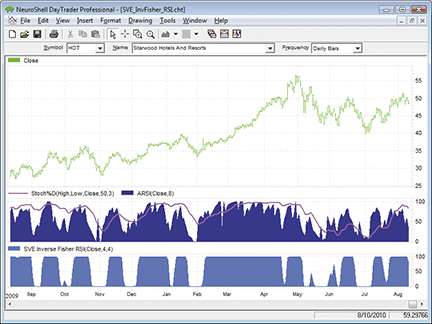
Figure 5: NEUROSHELL TRADER, Smoothed Rsi Inverse Fisher Transform. Here is a sample NeuroShell Trader chart showing the smoothed RSI inverse Fisher transform, asymmetric RSI, and stochastic oscillator.
![]() AIQ: SMOOTHED RSI INVERSE FISHER TRANSFORM
AIQ: SMOOTHED RSI INVERSE FISHER TRANSFORM
The Aiq code is given here for “A Smoothed Rsi Inverse Fisher Transform” by Sylvain Vervoort.
In Figure 6, I show the four-bar Rsi compared to Vervoort’s inverse Fisher transformation of the Rsi on a chart of Adobe Systems.
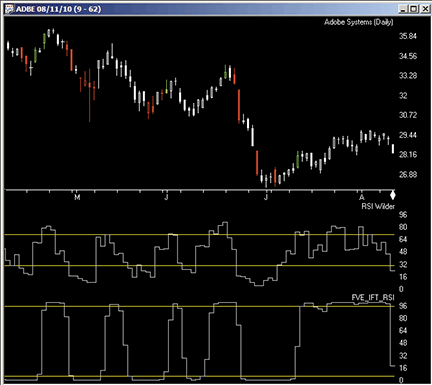
Figure 6: AIQ SYSTEMS, Smoothed Rsi Inverse Fisher Transform. Here is a demonstration of the four-bar RSI compared to the four-bar SVE_IFT_RSI on a chart of Adobe Systems.
The code and Eds file can be downloaded from www.TradersEdgeSystems.com/traderstips.htm.
!! SMOOTHED RSI INVERSE FISHER TRANSFORM
!  Author: Sylvain Vervoort, TASC October 2010
!  Coded by: Richard Denning 8/12/2010
!  www.TradersEdgeSystems.com

! INPUTS:
  xmaLen is 4.
  rsiLen is 4.

! ABBREVIATIONS:
  C is [close].
  C1 is valresult(C,1).

! INDICATOR CODE:
  WMA1 is (2*C+C1)/3 .
  WMA2 is (2*WMA1+valresult(WMA1,1))/3.
  WMA3 is (2*WMA2+valresult(WMA2,1))/3.
  WMA4 is (2*WMA3+valresult(WMA3,1))/3.
  WMA5 is (2*WMA4+valresult(WMA4,1))/3.
  WMA6 is (2*WMA5+valresult(WMA5,1))/3.
  WMA7 is (2*WMA6+valresult(WMA6,1))/3.
  WMA8 is (2*WMA7+valresult(WMA7,1))/3.
  WMA9 is (2*WMA8+valresult(WMA8,1))/3.
  WMA10 is (2*WMA9+valresult(WMA9,1))/3.
  SVE_RAIN is (5*WMA1+4*WMA2+3*WMA3+2*WMA4
   +WMA5+WMA6+WMA7+WMA8+WMA9+WMA10) / 20.

  price is SVE_RAIN.
  U is price-valresult(price,1).
  D is valresult(price,1)-price.
  W1 is rsiLen.
  rsiLen1 is 2 * W1 - 1.
  AvgU is ExpAvg(iff(U>0,U,0),rsiLen1).
  AvgD is ExpAvg(iff(D>=0,D,0),rsiLen1).
  rsi_RainbowWtgAvg is 100-(100/(1+(AvgU/AvgD))).

  RainRSI is 0.1 * (rsi_RainbowWtgAvg - 50).
  xma1 is expavg(RainRSI,xmaLen).
  xma2 is expavg(xma1,xmaLen).
  diff is xma1 - xma2.
  ZeroLagXmaRainRSI is xma1 + diff.

! INDICATOR TO PLOT:
  SVE_IFT_RSI is ((Exp(2*ZeroLagXmaRainRSI)-1)
	/ (Exp(2*ZeroLagXmaRainRSI)+1)+1)*50.
![]() TRADERSSTUDIO: SMOOTHED RSI INVERSE FISHER TRANSFORM
TRADERSSTUDIO: SMOOTHED RSI INVERSE FISHER TRANSFORM
The TradersStudio code for the smoothed Rsi inverse Fisher transform (Sve_Ift_Rsi) indicator, function, and sample system from the article, “A Smoothed Rsi Inverse Fisher Transform” by Sylvain Vervoort, is provided here.
The coded version that I have supplied also includes a system that can be used to test the indicator. The system uses only the Sve_Ift_Rsi (or Rsi) indicator. The system I set up to test the indicator in comparison to the original Rsi (relative strength index) devised by J. Wells Wilder is based on crossovers of overbought/oversold levels. The rules for the system are:
- Go long when the Sve_Ift_Rsi (or Rsi) goes below the oversold level.
- Go short when the Sve_Ift_Rsi (or Rsi) goes above the overbought level.
- All trades are placed next day market on open.
The system is always in the market either long or short. To test the indicator, I created a portfolio of 38 of the more actively traded, full-sized, futures contracts. I used back-adjusted data (day session only) from Pinnacle Data for the following symbols: AD, BO, BP, C, CC, CD, CL, CT, DJ, DX, ED, FA, FC, FX, GC, HG, HO, HU, JO, JY, KC, KW, LC, LH, NG, NK, PB, RB, S, SB, SF, SI, SM, SP, TA, TD, UA, W.
The comparative test of the indicator versus the original Rsi is shown on a year-by-year basis in the table in Figure 7. The test runs from 1997 to August 11, 2010. The years and metrics where the Sve_Ift_Rsi outperformed the Rsi are highlighted in light green. Over the entire test period and also within the last eight years, the Sve_Ift_Rsi indicator shows a better performance than the original Rsi when tested on this portfolio of futures markets with the four-day parameter.
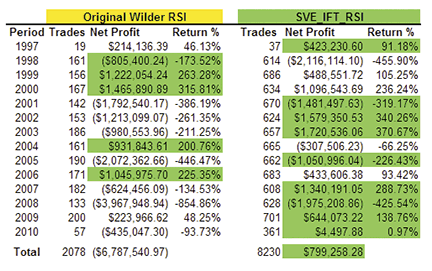
Figure 7: TRADERSSTUDIO, Smoothed Rsi Inverse Fisher Transform. Here is a year-by-year comparison of the SVE_IFT_RSI versus the RSI on a portfolio of 38 futures contracts trading one contract per trade. Light-green shaded areas highlight which indicator had the better performance.
The code can be downloaded from the TradersStudio website at www.TradersStudio.com → Traders Resources → FreeCode and also from www.TradersEdgeSystems.com/traderstips.htm.
' SMOOTHED RSI INVERSE FISHER TRANSFORM
' Author: Sylvain Vervoort, TASC October 2010
' Coded by: Richard Denning 8/12/2010
' www.TradersEdgeSystems.com
' System code:

Sub SVE_IFT_RSI_sys(rsiLen,xmaLen,upperSVE,lowerSVE,upperRSI,lowerRSI,useSVE)
  Dim SVErsi As BarArray
  Dim theRSI As BarArray

  SVErsi = SVE_IFT_RSI(rsiLen,xmaLen)
  theRSI = rsi(C,rsiLen,0)
  If useSVE = 1 Then
    If SVErsi[1] > lowerSVE And SVErsi < lowerSVE Then Buy("LE_SVE",1,0,Market,Day)
    If SVErsi[1] < upperSVE And SVErsi > upperSVE Then Sell("SE_SVE",1,0,Market,Day)
  Else
    If theRSI[1] > lowerRSI And theRSI < lowerRSI Then Buy("LE_RSI",1,0,Market,Day)
    If theRSI[1] < upperRSI And theRSI > upperRSI Then Sell("SE_RSI",1,0,Market,Day)
  End If
  marketbreakdown2()
End Sub
'-----------------------------------------------------------------------------------
' Indicator plot code:
Sub SVE_IFT_RSI_IND(rsiLen,xmaLen)
  plot1(SVE_IFT_RSI(rsiLen,xmaLen))
End Sub
'------------------------------------------------------------------------------------
' Function code - sve_ift_rsi:
Function SVE_IFT_RSI(rsiLen,xmaLen)
  Dim RainbowWtgAvg
  Dim RainbowRSI
  Dim ZeroLagXmaRainbowRSI
  RainbowWtgAvg = SVE_RAIN()
  RainbowRSI = 0.1 * (rsi(RainbowWtgAvg,rsiLen,0) - 50)
  ZeroLagXmaRainbowRSI = ZeroLagXMA(RainbowRSI,xmaLen)
 SVE_IFT_RSI = ((Exp(2*ZeroLagXmaRainbowRSI)-1)/(Exp(2*ZeroLagXmaRainbowRSI)+1)+1)*50
End Function
'------------------------------------------------------------------------------------
' Function code - zero lag xma:
Function ZeroLagXMA(Price As BarArray,xmaLen) As BarArray
  Dim xma1 As BarArray
  Dim xma2 As BarArray
  Dim diff As BarArray
  xma1 = XAverage(Price,xmaLen)
  xma2 = XAverage(xma1,xmaLen)
  diff = xma1 - xma2
  ZeroLagXMA = xma1 + diff
End Function
'-------------------------------------------------------------------------------------
' Function code - rainbow weighted average
Function SVE_RAIN()
  Dim WMA1,WMA2,WMA3,WMA4,WMA5,WMA6,WMA7,WMA8,WMA9,WMA10
  WMA1=WeightedMA(C,2,0)
  WMA2=WeightedMA(WMA1,2,0)
  WMA3=WeightedMA(WMA2,2,0)
  WMA4=WeightedMA(WMA3,2,0)
  WMA5=WeightedMA(WMA4,2,0)
  WMA6=WeightedMA(WMA5,2,0)
  WMA7=WeightedMA(WMA6,2,0)
  WMA8=WeightedMA(WMA7,2,0)
  WMA9=WeightedMA(WMA8,2,0)
  WMA10=WeightedMA(WMA9,2,0)

  SVE_RAIN=(5*WMA1+4*WMA2+3*WMA3+2*WMA4+WMA5+WMA6+WMA7+WMA8+WMA9+WMA10) / 20
  ' Print FormatDateTime(Date)," ",SVE_RAIN
End Function
 '--------------------------------------------------------------------------------------
![]() TRADECISION: SMOOTHED RSI INVERSE FISHER TRANSFORM
TRADECISION: SMOOTHED RSI INVERSE FISHER TRANSFORM
The article by Sylvain Vervoort in this issue, “A Smoothed Rsi Inverse Fisher Transform,” demonstrates an indicator that gives clear entry and exit signals, making it easier to make your entry and exit decisions.
Using the Indicator Builder in Tradecision, you can recreate the Sve inverse Fisher Rsi with the following code.
SVE inverse Fisher RSI

input
RSIper : "RSI Period?",4,2,30;
EMAper : "Exponential Moving AveragePeriod?",4,1,100;
end_input

var
RainbW:=0;
x:=0;
EMA1:=0;
EMA2:=0;
Difference:=0;
ZlEma:=0;
invfish:=0;
end_var
RainbW:=(5 * Mov(C, 2, W) + 4 * Mov(Mov(C, 2, W), 2, W) +
3 * Mov(Mov(Mov(C, 2, W), 2, W), 2, W) +
2 * Mov(Mov(Mov(Mov(C, 2, W), 2, W), 2, W), 2, W) +
Mov(Mov(Mov(Mov(Mov(C, 2, W), 2, W), 2, W), 2, W), 2, W) +
Mov(Mov(Mov(Mov(Mov(Mov(C, 2, W), 2, W), 2, W), 2, W), 2, W), 2, W) +
Mov(Mov(Mov(Mov(Mov(Mov(Mov(C, 2, W), 2, W), 2, W), 2, W), 2, W), 2, W), 2, W) +
Mov(Mov(Mov(Mov(Mov(Mov(Mov(Mov(C, 2, W), 2, W), 2, W), 2, W), 2, W), 2, W), 2, W), 2, W) +
Mov(Mov(Mov(Mov(Mov(Mov(Mov(Mov(Mov(C, 2, W), 2, W), 2, W), 2, W), 2, W), 2, W), 2, W), 2, W), 2, W) +
Mov(Mov(Mov(Mov(Mov(Mov(Mov(Mov(Mov(Mov(C, 2, W), 2, W), 2, W), 2, W), 2, W), 2, W), 2, W), 2, W), 2, W), 2, W)) / 20;

x:=0.1 * (RSI(RainbW, RSIper) - 50);
EMA1:=Mov(x, EMAper, Exponential);
EMA2:=Mov(EMA1, EMAper, Exponential);
Difference:=EMA1 - EMA2;
ZlEma:=EMA1 + Difference;

invfish:=((Exp(2*ZlEma)-1)/(Exp(2*ZlEma)+1)+1)*50;

return invfish;
To import the strategy into Tradecision, visit the area “Traders’ Tips from Tasc magazine” at www.tradecision.com/support/tasc_tips/tasc_traders_tips.htm or copy the code from the Stocks & Commodities website at www.traders.com.
A sample chart is shown in Figure 8.
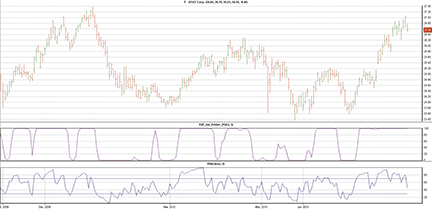
FIGURE 8: TRADECISION, AT&T CHART WITH THE RSI AND THE SVE INVERSE FISHER RSI. Here you see that the SVE inverse Fisher RSI gives very clear buy and sell signals and makes it easier for medium- to longer-term traders to find additional entry points in a medium-term up move.
![]() NINJATRADER: SMOOTHED RSI INVERSE FISHER TRANSFORM
NINJATRADER: SMOOTHED RSI INVERSE FISHER TRANSFORM
The smoothed Rsi inverse Fisher transform, as discussed by Sylvain Vervoort in his article in this issue (“A Smoothed Rsi Inverse Fisher Transform”), has now been implemented as an indicator available for download at www.ninjatrader.com/SC/October2010SC.zip.
Once you have it downloaded, from within the NinjaTrader Control Center window, select the menu File → Utilities → Import NinjaScript and select the downloaded file. This indicator is for NinjaTrader version 6.5 or greater.
You can review the indicator’s source code by selecting the menu Tools → Edit NinjaScript → Indicator from within the NinjaTrader Control Center window and selecting SmoothedRsiInverseFisherTransform.
NinjaScript indicators are compiled Dlls that run native, not interpreted, which provides you with the highest performance possible.
A sample chart implementing the strategy is shown in Figure 9.
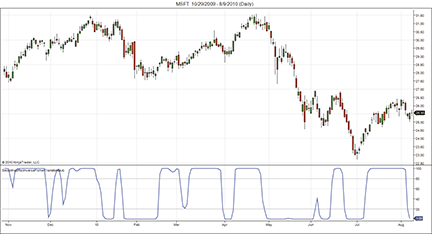
Figure 9: NINJATRADER, Smoothed Rsi Inverse Fisher Transform. This sample screenshot shows the smoothed RSI inverse Fisher transform applied to a daily chart of Microsoft (MSFT).
![]() NEOTICKER: SMOOTHED RSI INVERSE FISHER TRANSFORM
NEOTICKER: SMOOTHED RSI INVERSE FISHER TRANSFORM
The indicator described by Sylvain Vervoort in his article in this issue, “A Smoothed Rsi Inverse Fisher Transform,” has two integer parameters: the Rsi period and the exponential moving average period. It returns one plot (see Figure 10).
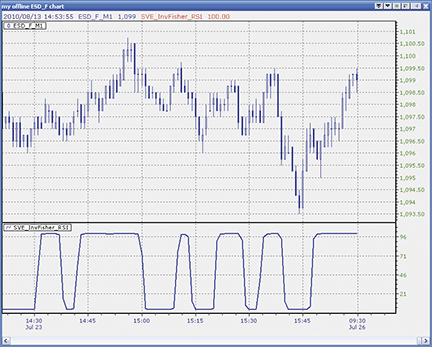
Figure 10: NEOTICKER, Smoothed Rsi Inverse Fisher Transform
Listing 1 shows the code for the smoothed Rsi inverse Fisher transform written in our formula language. The source code for the indicator will be available for download at the NeoTicker blog site (https://blog.neoticker.com).
Listing 1
$RSIper := choose(param1 > 30, 30, param1 < 2, 2, param1);
$EMAper := choose(param2 > 100, 100, param2 < 1, 1, param2);
RainbW :=
 (5*waverage(data1,2) +
  4*waverage(waverage(data1,2),2) +
  3*waverage(waverage(waverage(data1,2),2),2) +
  2*waverage(waverage(
    waverage(waverage(data1,2),2),2),2) +
  waverage(waverage(
    waverage(waverage(
      waverage(data1,2),2),2),2),2) +
  waverage(waverage(
    waverage(waverage(
      waverage(waverage(data1,2),2),2),2),2),2) +
  waverage(waverage(
    waverage(waverage(
      waverage(waverage(
        waverage(data1,2),2),2),2),2),2),2) +
  waverage(waverage(
    waverage(waverage(
      waverage(waverage(
        waverage(waverage(data1,2),2),2),2),2),2),2),2) +
  waverage(waverage(
    waverage(waverage(
      waverage(waverage(
        waverage(waverage(
          waverage(data1,2),2),2),2),2),2),2),2),2) +
  waverage(waverage(
    waverage(waverage(
      waverage(waverage(
        waverage(waverage(
          waverage(waverage(data1,2),2),2),2),2),2),2),2),2),2))/20;
x := 0.1*(rsindex(RainbW, $RSIper)-50);
EMA1 := xaverage(x, $EMAper);
EMA2 := xaverage(EMA1, $EMAper);
$Difference := EMA1-EMA2;
ZlEma := EMA1 + $Difference;
plot1 := ((exp(2*ZlEma)-1)/(exp(2*ZlEma)+1)+1)*50;
![]() WAVE59: SMOOTHED RSI INVERSE FISHER TRANSFORM
WAVE59: SMOOTHED RSI INVERSE FISHER TRANSFORM
In “A Smoothed Rsi Inverse Fisher Transform” in this issue, Sylvain Vervoort describes an improved version of the relative strength index (Rsi).
We were interested to see how the indicator performs as a standalone indicator on S&P. In Figure 11, the indicator can be seen catching a huge trend earlier this year.
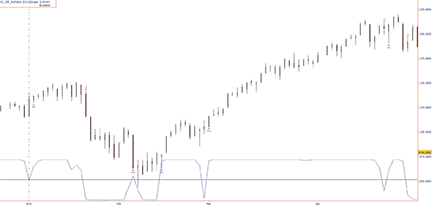
FIGURE 11: WAVE59, Smoothed Rsi Inverse Fisher Transform. In this example, the indicator can be seen catching a huge trend earlier this year.
The following script implements this indicator in Wave59. As always, users of Wave59 can download these scripts directly using the QScript Library found at https://www.wave59.com/library.
Indicator:  SC_Invfish_RSI
#SVE_InvFisher_RSI
input: RSIper(4),EMAper(4), Plot_Thickness(1), Color(Blue);
RainbW=(5*waverage(C,2)+4*waverage(waverage(C,2),2) +
3*waverage(waverage(waverage(C,2),2),2) +
2*waverage(waverage(waverage(waverage(C,2),2),2),2) +
waverage(waverage(waverage(waverage(waverage(C,2),2),2),2),2) +
waverage(waverage(waverage(waverage(waverage(waverage(C,2),2),2),2),2),2) +
waverage(waverage(waverage(waverage(waverage(waverage(waverage(C,2),2),2),2),2),2),2) +
waverage(waverage(waverage(waverage(waverage(waverage(waverage(waverage(C,2),2),2),2),2),2),2),2) +
waverage(waverage(waverage(waverage(waverage(waverage(waverage(waverage(waverage(C,2),2),2),2),2),2),2),2),2) +
waverage(waverage(waverage(waverage(waverage(waverage(waverage(waverage(waverage(waverage(C,2),2),2),2),2),2),2),2),2),2))/20;
x = .1*( RSI(RainbW,RSIper)-50);
EMA1= xaverage(x,EMAper);
EMA2= xaverage(EMA1,EMAper);
Difference = EMA1 - EMA2;
ZlEma = EMA1 + Difference;
invfish =((Exp(2*ZlEma)-1)/(Exp(2*ZlEma)+1)+1)*50;
plot1 = invfish;
thickness1 = Plot_Thickness;
color1=color;
plot2 = 50;
color2=black;
--------------------------------------------
![]() UPDATA: SMOOTHED RSI INVERSE FISHER TRANSFORM
UPDATA: SMOOTHED RSI INVERSE FISHER TRANSFORM
This tip is based on “A Smoothed Rsi Inverse Fisher Transform” by Sylvain Vervoort in this issue.
This indicator exploits the boundary constraints imposed by the Fisher transform on a zero-lag smoothed Rsi to restrict transition paths between threshold levels. The intention is to give clearer, and thus more robust periods of overbought and oversold.
The Updata code for this indicator has been added to the Updata Indicator Library and may be downloaded by clicking the Custom menu and then Indicator Library. Those who cannot access the library due to a firewall may paste the code below into the Updata Custom editor and save it.
A sample chart is shown in Figure 12.
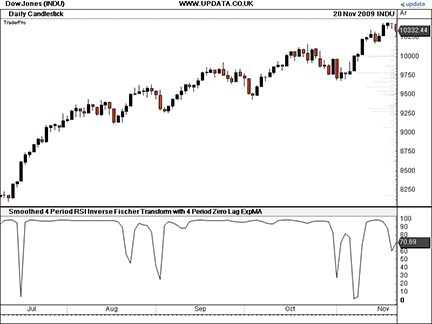
FIGURE 12: UPDATA, Smoothed Rsi Inverse Fisher Transform. This chart shows the RSI (post-Fisher transform) of the Dow Jones Industrial Average. The clear minima extreme before the start of the July rally highlights the simplified output of this approach.
NAME "Smoothed Inverse Fisher Transform"
PARAMETER "RSI Period" #PERIOD=14
PARAMETER "Exp Avg Period 1" #EPERIOD1=12
PARAMETER "Exp Avg Period 2" #EPERIOD2=24
DISPLAYSTYLE LINE
INDICATORTYPE CHART
@X=0
@SUM=0
@RAINBW=0
#i=0
#j=0
@RAINBOWRSI=0
@UP=0
@DOWN=0
@RS=0
@EMA1=0
@EMA2=0
@DIFF=0
@ZEROLAG=0
@INVFISCHER=0

FOR #CURDATE=0 TO #LASTDATE

   If #CURDATE>MAX(#EPERIOD1,#EPERIOD2)

      ‘nested weighted moving averages
      @X=CLOSE
      @SUM=0
      for #i=0 to 9
          @X=SGNL(@X,2,W)
          @SUM=@SUM+(MAX(1,5-#i)*@X)
      next

      @RAINBW=@SUM/20

      for #j=0 TO #PERIOD-1
          if HIST(@RAINBW,#j)>HIST(@RAINBW,#j+1)
             @UP=HIST(@RAINBW,#j)-HIST(@RAINBW,#j+1)
          elseif HIST(@RAINBW,#j)>HIST(@RAINBW,#j+1)
             @DOWN=HIST(@RAINBW,#j+1)-HIST(@RAINBW,#j)
          endif
      next
           @RS=SGNL(@UP,#PERIOD,E)/SGNL(@DOWN,#PERIOD,E)
      @RAINBOWRSI=0.1*(100-(100/(1+@RS))-50)
      @EMA1=SGNL(@RAINBOWRSI,#EPERIOD1,M)
      @EMA2=SGNL(@EMA1,#EPERIOD2,M)
      @DIFF=@EMA1-@EMA2
      @ZEROLAG=@EMA1+@DIFF

      @INVFISCHER=(1+((EXPBASE(2*@ZEROLAG,2)-
                  1)/(EXPBASE(2*@ZEROLAG,2)+1)))*50

      @PLOT=@INVFISCHER

   EndIf

NEXT
![]() VT TRADER: SMOOTHED RSI INVERSE FISHER TRANSFORM
VT TRADER: SMOOTHED RSI INVERSE FISHER TRANSFORM
Our Traders’ Tip this month is based on the article in this issue by Sylvain Vervoort, “A Smoothed Rsi Inverse Fisher Transform.”
The VT Trader code and instructions for recreating this indicator are as follows:
- VT Trader’s Ribbon → Technical Analysis menu → Indicators group → Indicators Builder → [New] button
- In the General tab, type the following text into each corresponding text box:
Name: TASC - 10/2010 - Smoothed RSI Inverse Fisher Transform
Function Name Alias: tasc_SmRsiInvFish
Label Mask: TASC - 10/2010 - Smoothed RSI Inverse Fisher Transform (%RsiPeriods%,%EmaPeriods%) = %InvFish%
Placement: New Frame
Data Inspection Alias: Smoothed RSI Inv. Fisher
- In the Input Variable(s) tab, create the following variables:
[New] button…
Name: RsiPeriods
Display Name: RSI Periods
Type: integer
Default: 4

[New] button...
Name: EmaPeriods
Display Name: Exp. Moving Average Periods
Type: integer
Default: 4
- In the Output Variable(s) tab, create the following variables:
[New] button…
Var Name: InvFish
Name: (Inv. Fisher Transform)
Line Color: dark blue
Line Width: slightly thicker
Line Type: solid
- In the Horizontal Line tab, create the following horizontal lines:
[New] button…
Value: +88
Line Color: red
Line Width: thin
Line Type: dashed

[New] button…
Value: +12
Line Color: red
Line Width: thin
Line Type: dashed
- In the Formula tab, copy and paste the following formula:
{Provided By: Capital Market Services, LLC & Visual Trading Systems, LLC} {Copyright: 2010} {Description: TASC, October 2010 - "Clarity In Decision-Making, A Smoothed RSI Inverse Fisher Transform" by Sylvain Vervoort} {File: tasc_SmRsiInvFish.vtscr - Version 1.0} {SVE Rainbow Weighted} RainbW:= (5*Mov(C,2,W) + 4*Mov(Mov(C,2,W),2,W) + 3*Mov(Mov(Mov(C,2,W),2,W),2,W) + 2*Mov(Mov(Mov(Mov(C,2,W),2,W),2,W),2,W) + Mov(Mov(Mov(Mov(Mov(C,2,W),2,W),2,W),2,W),2,W) + Mov(Mov(Mov(Mov(Mov(Mov(C,2,W),2,W),2,W),2,W),2,W),2,W) + Mov(Mov(Mov(Mov(Mov(Mov(Mov(C,2,W),2,W),2,W),2,W),2,W),2,W),2,W) + Mov(Mov(Mov(Mov(Mov(Mov(Mov(Mov(C,2,W),2,W),2,W),2,W),2,W),2,W),2,W),2,W) + Mov(Mov(Mov(Mov(Mov(Mov(Mov(Mov(Mov(C,2,W),2,W),2,W),2,W),2,W),2,W),2,W),2,W),2,W) + Mov(Mov(Mov(Mov(Mov(Mov(Mov(Mov(Mov(Mov(C,2,W),2,W),2,W),2,W),2,W),2,W),2,W),2,W),2,W),2,W)) / 20; {RSI of SVE Rainbow Weighted} rsi_r:= (RainbW - ref(RainbW,-1)); rsi_rs:= Wilders(if(rsi_r>0,rsi_r,0),RsiPeriods) / Wilders(if(rsi_r>0,Abs(rsi_r),0),RsiPeriods); RSIndex:= 100-(100/(1+rsi_rs)); {Limit Swing of RSI of SVE Rainbow Weighted to +5/-5} x:= 0.1*(RSIndex-50); {Apply Zero-Lag Technique to Limited Swing RSI of SVE Rainbow Weighted} EMA1:= Mov(x,EmaPeriods,E); EMA2:= Mov(EMA1,EmaPeriods,E); Difference:= EMA1 - EMA2; ZlEma:= EMA1 + Difference; {Inverse Fisher Transform of Smoothed RSI with Swing Range of 0-100} InvFish:=((Exp(2*ZlEma)-1)/(Exp(2*ZlEma)+1)+1)*50; - Click the “Save” icon in the toolbar to finish building the inverse Fisher transform of the smoothed Rsi.
To attach the indicator to a chart (Figure 13), click the right mouse button within the chart window and then select “Add Indicator” → “TASC - 10/2010 - Smoothed Rsi inverse Fisher transform” from the indicator list.
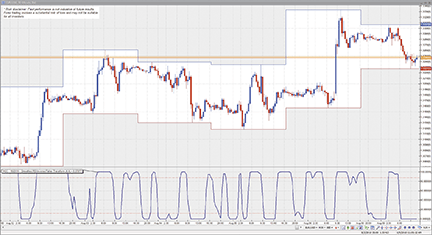
Figure 13: VT TRADER, Smoothed Rsi Inverse Fisher Transform. Here is an example of the smoothed RSI inverse Fisher transform attached to a one-hour candlestick chart of the EUR/USD.
To learn more about VT Trader, visit www.cmsfx.com.
Forex trading involves a substantial risk of loss and may not be suitable for all investors.
![]() WORDEN BROTHERS STOCKFINDER: SMOOTHED RSI INVERSE FISHER TRANSFORM
WORDEN BROTHERS STOCKFINDER: SMOOTHED RSI INVERSE FISHER TRANSFORM
The smoothed Rsi inverse Fisher transform presented in Sylvain Vervoort’s article in this issue, “A Smoothed Rsi Inverse Fisher Transform,“ has now been made available in the StockFinder v5 indicator library.
You can add the indicator to your chart (Figure 14) by clicking the “Add Indicator/Condition” button or by simply typing “/smooth” and choosing it from the list of available indicators.
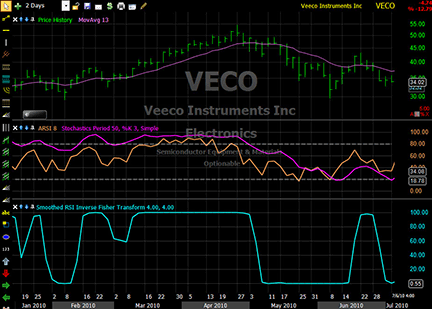
FIGURE 14: STOCKFINDER, COMBINING THE SMOOTHED RSI INVERSE FISHER TRANSFORM WITH OTHER INDICATORS. Here you see the eight-period asymmetrical RSI and a slow standard 50-period stochastic oscillator with a three-period slowing. The blue curve at the bottom is the smoothed RSI inverse Fisher transform with a four-period RSI and a four-period zero-lagging exponential moving average. Combining these indicators gives very clear buy and sell signals.
This indicator was constructed using RealCode, which is based on the Microsoft Visual Basic.Net framework and uses the Visual Basic (VB) language syntax. RealCode is compiled into a .Net assembly and run by the StockFinder application.
To download the StockFinder software and get a free trial, go to www.StockFinder.com.
![]() METASTOCK — VERVOORT ARTICLE CODE
METASTOCK — VERVOORT ARTICLE CODE
I am using a default value of four periods for the Rsi and the zero-lagging moving average. These values give clear turning points, which are often clearer and faster than the five-period Rsi original formula.
{SVE_InvFisher_RSI}
RSIper := Input(“RSI Period?”,2,30,4);
EMAper := Input(“Exponential Moving Average Period?”,1,100,4);
ma1:= Mov(C,2,W);
ma2:= Mov(ma1,2,W);
ma3:= Mov(ma2,2,W);
ma4:= Mov(ma3,2,W);
ma5:= Mov(ma4,2,W);
ma6:= Mov(ma5,2,W);
ma7:= Mov(ma6,2,W);
ma8:= Mov(ma7,2,W);
ma9:= Mov(ma8,2,W);
ma10:= Mov(ma9,2,W);
RainbW:= (5*ma1+4*ma2+3*ma3+2*ma4+ma5+ma6+ma7+ma8+ma9+ma10)/20;
x:= .1*(RSI(RainbW,RSIper)-50);
EMA1:= Mov(x,EMAper,Exponential);
EMA2:= Mov(EMA1,EMAper,Exponential);
Difference:= EMA1 - EMA2;
ZlEma:= EMA1 + Difference;
invfish:=((Exp(2*ZlEma)-1)/(Exp(2*ZlEma)+1)+1)*50;
invfish