INDICATORS
Clarity In Decision-Making
A Smoothed Rsi Inverse Fisher Transform
This indicator gives clear entry and exit signals, so your trading decisions are easier.
The Fisher transform has been a familiar concept to Stocks & Commodities readers in recent years following its introduction in 2002 by frequent S&C contributor John Ehlers. Its creator, Ronald Fisher, was one of the leading scientists of the 20th century, making major contributions to statistics, evolutionary biology, and genetics. Ehlers’ 2004 followup applied an inverse Fisher transform to the relative strength index (Rsi), changing what was a good turning-point indicator to one that fine-tuned the timing of possible entry and exit points. Here is the inverse Fisher transform formula:
y = (Exp(2 * x) - 1)/(Exp(2 * x) + 1)
where x is the input value and y is the transformed value.
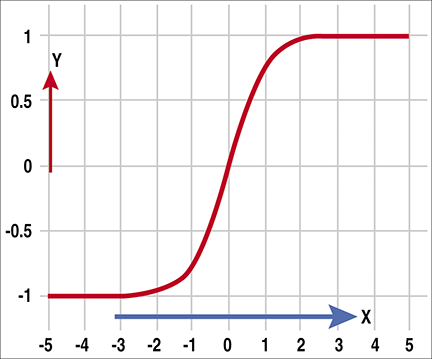
Figure 1 shows a plot of the inverse Fisher transform. The transform creates boundaries to keep the output value in the range between -1 to +1. Input values larger than 2 generate a result close to 1, while input values less than -2 generate a result close to -1. This boundary characteristic is useful with any indicator moving between two fixed values, like the relative strength index (Rsi).

Figure 1: inverse fisher transform. The transform creates boundaries to keep the output value in the range of -1 to +1. Input values larger than 2 generate a result close to 1, and input values less than -2 generate a result close to -1. This boundary characteristic is useful with any indicator moving between two fixed values, like the RSI.
But the input data for the inverse Fisher transform formula needs to be in the range of -5 to +5. The normal Rsi is in the range of zero to 100, but we can convert this to a range of -5 to 5, using the following formula:
x = 0.1 * (Rsi value - 50)