CHART PATTERNS
Simple Yet Effective
Identifying Cup Formations Early 
Here’s a simple mechanical recognition method for identifying possible emerging cup formations.
In my article “Identifying The Cup (With Or Without The Handle),” which appeared in the February 2006 Stocks & Commodities, I introduced a simple mechanical algorithmic method for identifying cup formations (also known as rounding bottoms) in their late phase. The core part of the algorithm was based on the idea of using a virtual grid on the chart. Since then, I have been asked by technical analysts to provide an algorithm for identifying possible cup formations in their early phase. This time I will show you how you can easily use the grid technique for spotting possible cup formations during their development.
The cup formation
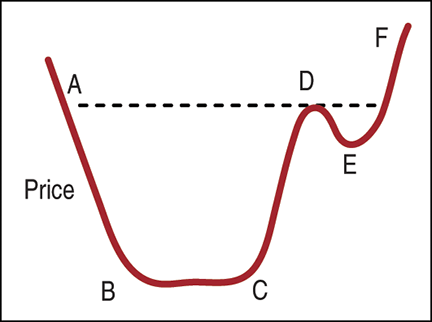
In Figure 1 you can see a typical cup formation. I will not elaborate on the technical details of the cup formation (see “Related reading”). I will say that the identification method I introduced in my previous article on the subject was able to spot cup formations in their late phase (to the right after point C in Figure 1). The goal of the algorithm I will describe is to identify the development of such a formation before or near point C. “But are you sure a cup is being formed at point C?” you might ask. No, we are not. We can’t be sure that a specific formation is going to take place. However, if the price is about to form a cup, it has to form a half-cup before integrating the formation in its entirety. You might want to be informed that the price shows such intentions.

Figure 1: A textbook cup formation. This is the typical cup formation. The price declines (segment A-B), lands low smoothly, and remains there for a while (segment B-C), and in the sequence it advances to where it was before the fall (segment C-D), creating a cup-like formation. Often, it then falls back creating what is called “the handle of the cup” (segment D-E) before moving on to new highs (segment E-F).