TRADERS’ TIPS
April 2011
Here is this month’s selection of Traders’ Tips, contributed by various developers of technical analysis software to help readers more easily implement some of the strategies presented in this and other issues.
Other code appearing in articles in this issue is posted in the Subscriber Area of our website at https://technical.traders.com/sub/sublogin.asp. Login requires your last name and subscription number (from mailing label). Once logged in, scroll down to beneath the “Optimized trading systems” area until you see “Code from articles.” From there, code can be copied and pasted into the appropriate technical analysis program so that no retyping of code is required for subscribers.
You can copy these formulas and programs for easy use in your spreadsheet or analysis software. Simply “select” the desired text by highlighting as you would in any word processing program, then use your standard key command for copy or choose “copy” from the browser menu. The copied text can then be “pasted” into any open spreadsheet or other software by selecting an insertion point and executing a paste command. By toggling back and forth between an application window and the open web page, data can be transferred with ease.
This month’s tips include formulas and programs for:
- TRADESTATION: IDENTIFYING CUP FORMATIONS EARLY
- BLOOMBERG: IDENTIFYING CUP FORMATIONS EARLY
- THINKORSWIM.COM: IDENTIFYING CUP FORMATIONS EARLY
- eSIGNAL: IDENTIFYING CUP FORMATIONS EARLY
- WEALTH-LAB: IDENTIFYING CUP FORMATIONS EARLY
- AMIBROKER: IDENTIFYING CUP FORMATIONS EARLY
- NEUROSHELL TRADER: IDENTIFYING CUP FORMATIONS EARLY
- AIQ: IDENTIFYING CUP FORMATIONS EARLY
- TRADERSSTUDIO: IDENTIFYING CUP FORMATIONS EARLY
- STRATASEARCH: IDENTIFYING CUP FORMATIONS EARLY
- NINJATRADER: IDENTIFYING CUP FORMATIONS EARLY
- UPDATA: IDENTIFYING CUP FORMATIONS EARLY
- MICROSOFT EXCEL: IDENTIFYING CUP FORMATIONS EARLY
- VT TRADER: COMBINING RSI WITH RSI
- IDENTIFYING CUP FORMATIONS EARLY — SILIGARDOS ARTICLE CODE

TRADESTATION: IDENTIFYING CUP FORMATIONS EARLY
In “Identifying Cup Formations Early” in this issue, author Giorgos Siligardos describes an algorithm to identify possible cup formations early by detecting roughly the first half of the formation.
Here, we present the indicator code (_CupFormation) to implement the algorithm described in the article as well as to provide an alert and a dot that is plotted when the cup conditions are all met. The indicator can also show historical formations by setting the “ShowHistory” input to true.
To download the EasyLanguage code for the indicator, go to the TradeStation and EasyLanguage Support Forum (https://www.tradestation.com/Discussions/forum.aspx?Forum_ID=213) and search for the file “_CupFormation.Eld”.
A sample chart is shown in Figure 1.
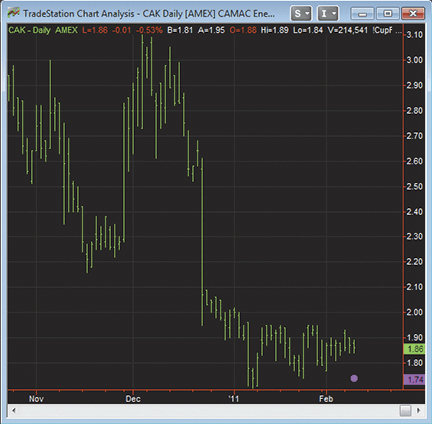
Figure 1: TRADE-STATION, CUP FORMATION IDENTIFICATION INDICATOR. Here is a daily chart of CAK with the indicator applied. The magenta marker indicates that all of the requirements for the _ cup have been met on the bar that is marked.
This article is for informational purposes. No type of trading or investment recommendation, advice, or strategy is being made, given, or in any manner provided by TradeStation Securities or its affiliates.
EasyLanguage code:

_CupFormation (Indicator)
{ TASC Apr 2011 - "Identifying Cup Formations Early" }

inputs:
	Parameter( 1.5 ),
	MinNumBars( 20 ), { min bars in setup }
	OffsetTicks( 10 ), { offset ticks for ShowMe dot }
	ShowHistory( false ) ; { only show last cup }

variables:
	CupCond1( false), CupCond2A( false ),
	CupCond2B( false ),	CupCond3( false ),
	CupCond4( false ), CupFormation( false ),
	EndOfBar( false ), SemiCupPeriod( 0 ),
	BoxHeight( 0 ),	N( 0 ),	L2( 0 ),
	L3( 0 ), B2( 0 ), B3( 0 ),
	PTop( 0 ), PBot( 0 ), FilC( 0 ),
	DX1( 0 ), DX2( 0 ), MyTick( 0 ) ;

const:
	eps1( 0.0000000001 ) ;

arrays:
	FilC_Array[1001]( 0 ),
	CloseArray[1001]( 0 ),
	DXPlusArray[1001]( 0 ),
	DXMinusArray[1001]( 0 ) ;

once MyTick = MinMove / PriceScale ;

EndOfBar = BarStatus( 1 ) = 2 ;

if EndOfBar then
	begin
	FilC = Iff( C > 0, Log( C ), 0 ) ;
	for N = 1000 downto 1
		begin
		FilC_Array[N] = FilC_Array[N-1] ;
		CloseArray[N] = CloseArray[N-1] ;
		DXPlusArray[N] = DXPlusArray[N-1] ;
		DXMinusArray[N] = DXMinusArray[N-1] ;
		end ;
	FilC_Array[0] = FilC ;
	CloseArray[0] = C ;
	if Currentbar > 1 then
		begin
		DXPlusArray[0] = MaxList(FilC - FilC[1], 0) ;
		DXMinusArray[0] = MaxList(FilC[1] - FilC, 0) ;
		end
	else
		begin
		if C[1] > 0 then
			begin
			DXPlusArray[0] = MaxList( FilC -
			 Log( C[1] ), 0 ) ;
			DXMinusArray[0] = MaxList( Log( C[1] ) -
			 FilC, 0 ) ;
			end ;
		end ;
	end ;

Condition1 = IffLogic( ShowHistory,
 true, LastBarOnChart ) ;

if Condition1 and EndOfBar then
	begin
	SemiCupPeriod = 0 ;
	PTop = 0 ;
	CupCond1 = false ;
	CupCond2A = false ;
	CupCond2B = false ;
	CupCond3 = false ;
	CupCond4 = false ;
	Value1 = 0 ;
	Value2 = 0 ;
	Value3 = 0 ;
	Value4 = 0 ;

	for N = 1 to 1000
		begin
		if CloseArray[N] > C * Parameter then
			begin
			SemiCupPeriod = N + 1 ;
			PTop = FilC_Array[N] ;
			B2 = IntPortion( 0.6 * N ) ;
			B3 = IntPortion( 0.4 * N ) ;
			end ;
		if SemiCupPeriod > 0 then
			break ;
		end ;

	if SemiCupPeriod >= MinNumBars then
		begin
		CupCond1 = true ;
		PBot = 1000000000 ;
		for N = 0 to SemiCupPeriod
			begin
			PBot = MinList( FilC_Array[N], PBot ) ;
			end ;
		BoxHeight = ( PTop - PBot ) / 5 ;
		L2 = PBot + 2 * BoxHeight ;
		L3 = PBot + 3 * BoxHeight ;

		for N = 0 to B3
			begin
			if FilC_Array[N] < L2 then
				CupCond2A = true
			else
				begin
				CupCond2A = false ;
				break ;
				end ;
			end ;

		for N = B3 to B2
			begin
			if FilC_Array[N] < L3 then
				CupCond2B = true
			else
				begin
				CupCond2B = false ;
				break ;
				end ;
			end ;

		{ Calculate DX1 }
		for N = B2 to SemiCupPeriod
			begin
			Value1 = Value1 + DXPlusArray[N] ;
			Value2 = Value2 + DXMinusArray[N] ;
			end ;
		DX1 = AbsValue( Value1 - Value2 ) /
		 ( eps1 + Value1 + Value2 ) * 100 ;
		CupCond3 = DX1 > 25 ;

		{ Calculate DX2 }
		for N = 0 to B2 - 1
			begin
			Value3 = Value3 + DXPlusArray[N] ;
			Value4 = Value4 + DXMinusArray[N] ;
			end ;
		DX2 = AbsValue( Value3 - Value4 ) /
		 ( eps1 + Value3 + Value4 ) * 100 ;
		CupCond4 = DX2 < 25 ;

		end ;

	CupFormation = CupCond1 and CupCond2A and
	 CupCond2B and CupCond3 and CupCond4 ;

	if CupFormation then
		begin
		Alert( "1/2 Cup Formation" ) ;
		Plot1( L - OffsetTicks * MyTick, "CupForm" ) ;
		end ;

	end ;

BLOOMBERG: IDENTIFYING CUP FORMATIONS EARLY
The semi-cup formation, as described in “Identifying Cup Formations Early” in this issue by Giorgos Siligardos, has now been added to the chart studies available on Bloomberg Terminals.
This indicator is displayed on the price chart in order to help identify cup formations at an early stage of development. While later confirmation of the cup formation is necessary, this type of early phase identification can give traders an excellent way to narrow down their selection of markets that may be preparing to trigger an entry after the development of the full cup formation.
Using the CS.Net framework within the Stdy<GO> function on the Bloomberg Terminal, C# or Visual Basic code can be written to display the SemiCup indicator (Figure 2). The C# code for this indicator is shown here. All Bloomberg code contributions to Traders’ Tips can also be found in the sample files provided with regular Sdk updates, and the studies will also be included in the Bloomberg global study list.
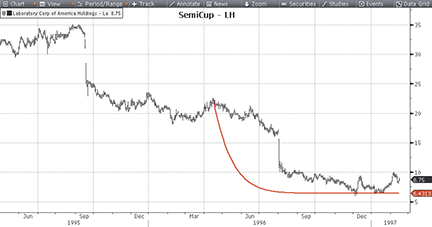
Figure 2: BLOOMBERG, CUP FORMATION IDENTIFICATION INDICATOR. Shown here is a chart of Laboratory Corp. (LH). In his article, Giorgos Siligardos shows a chart of LH (Figure 7 in the article) that shows a shaded area where the semi-cup would have formed and then failed. Here, we show LH ending in the area of the shaded box on the original chart, with the semi-cup forming before the point at which it failed to complete the cup formation.
Bloomberg code:

using System;
using System.Collections.Generic;
using System.Text;
using System.Drawing;
using Bloomberg.Study.API;
using Bloomberg.Study.CoreAPI;
using Bloomberg.Study.Util;
using Bloomberg.Study.TA;
using Bloomberg.Math;

namespace SemiCup
{

    public partial class SemiCup
    {
        /// <summary>
        /// This is where the properties of the study are defined.  These properties are
        /// displayed in the "Study Properties" dialog in the "Settings" tab for the end-user
        /// to modify. These properties are also accessible on the right-click context menu
        /// of the study.
        /// </summary>
        //
        // This study has one end-user modifiable property:
        // Parameter: This study property allows the end-user to select a Parameter
        //            which is used for finding the appropriate semicup period
        public StudyDoubleProperty Parameter = new StudyDoubleProperty(1.5, 1, 100);

        /// <summary>
        /// Initialize() sets up the study outputs and visuals that the study will use.
        ///
        /// Initialize() is called once when the study is applied to the chart or
        /// when the chart is reinitialized due to a chart property change such as
        /// a symbol or time interval change.
        /// </summary>
        private void Initialize()
        {
            // Create an output TimeSeries with the name "SemiCupData"
            // for the curve that will be drawn if a semicup formation is found.
            // Because the purpose of this curve is to demonstrate a formation,
            // it is not necessary to show the values of the curve on the legend.
            Output.Add("SemiCupData", new TimeSeries());
            StudyLine semiCupLine = new StudyLine("SemiCupData", Color.Red);
            semiCupLine.Width = 2;
            semiCupLine.ShowValues(false);
            ParentPanel.Visuals.Add("SemiCup", semiCupLine);

        }

        /// <summary>
        /// Calculate() updates the outputs used by the study visuals.
        ///
        /// Calculate() is called when the study is first applied to the chart
        /// and periodically when the chart's data changes.
        ///
        /// Uncaught exceptions in Calculate() will be displayed as a pop-up
        /// error message.
        /// </summary>
        public override void Calculate()
        {
            TimeSeries close = Input.Close;
            int count = close.Count;
            TimeSeries filc = new TimeSeries(count);
            int semicupperiod = -1;

            // semicupperiod is the last bar whose value is greater than or equal to
            // the last close multiplied by Parameter.
            // We'll call this our comparison
            double comparison = close[count - 1] * Parameter.Value;

            for (int ii = count - 1; ii >= 0; ii--)
            {
                // Step 1: Calculate current filc value as the natural logarithm of each bar
                filc[ii] = Math.Log(close[ii]);

                if (close[ii] >= comparison)
                {
                    semicupperiod = count - ii;

                    // We need one additional filc value to calculate change for dxp & dxn
                    if (ii > 0)
                    {
                        filc[ii - 1] = Math.Log(close[ii - 1]);
                    }
                    break;
                }
            }

            // Rule 1: semicupperiod must be at least 20 bars
            if (semicupperiod < 20)
            {
                return;
            }

            // Step 2a: b0 is the time value of the first bar
            int b0 = count - semicupperiod;

            // Step 2b: Ptop is the filc at b0
            double ptop = filc[b0];

            // Step 2c: b5 is the last bar
            int b5 = count - 1;

            // Step 2d: Pbot is the lowest filc from b0 to b5
            double pbot = filc.Slice(b0).Minimum;

            // Step 3a: level1-level4 divide the price span between pbot and ptop
            //          into 5 equal parts
            //          Only level2 and level3 are used
            double boxheight = (ptop - pbot) / 5;
            double level2 = pbot + (2 * boxheight);
            double level3 = level2 + boxheight;

            // Step 3b: b1-b4 divide the time span between b0 and b5 into 5 equal parts
            //          only b2 and b3 are used
            int boxlength = semicupperiod / 5;
            int b2 = b0 + (2 * boxlength);
            int b3 = b2 + boxlength;

            // Rule 2: filc Values from b2 to b3 must be less than level3
            //         filc Values from b3 to b5 must be less than level2
            if (filc.Slice(b2, b3 + 1).Maximum >= level3 ||
                filc.Slice(b3).Maximum >= level2)
            {
                return;
            }

            // Step 4: Define dxp as positive movement and dxn as negative movement
            TimeSeries dxp = (filc - filc.ShiftRight(1)).SetFloor(0);
            TimeSeries dxn = (filc.ShiftRight(1) - filc).SetFloor(0);

            // Step 5a: Calculate dx1 as the directional movement between b0 and b2
            //          Rather than calculating over the whole TimeSeries,
            //          use Slice() to calculate on a window from b0 to b2
            double dxpAverage = dxp.Slice(b0, b2 + 1).Mean;
            double dxnAverage = dxn.Slice(b0, b2 + 1).Mean;
            double dx1 = (Math.Abs(dxpAverage - dxnAverage) / (dxpAverage + dxnAverage)) * 100;

            // Step 5b: Calculate dx2 as the directional movement between b2 and b5 (the end)
            //          Rather than calculating over the whole TimeSeries,
            //          use Slice() to calculate on a window from b2 to b5
            dxpAverage = dxp.Slice(b2).Mean;
            dxnAverage = dxn.Slice(b2).Mean;
            double dx2 = (Math.Abs(dxpAverage - dxnAverage) / (dxpAverage + dxnAverage)) * 100;

            // Rule 3: dx1 > 25
            // Rule 4: dx2 < 25
            if (dx1 <= 25 || dx2 >= 25)
            {
                return;
            }

            // Setup a TimeSeries to hold the data for the output curve
            // and calculate the values for the curve
            TimeSeries semiCup = new TimeSeries(count);
            for (int ii = b0; ii <= b5; ii++)
            {
                semiCup[ii] = (((Math.Exp(ptop) - Math.Exp(pbot)) /
                                Math.Pow(b0 - b5, 10)) * Math.Pow(ii - b5, 10)) +
                                (0.98 * Math.Exp(pbot));
            }

            // Update the "SemiCupData" output with the TimeSeries that was just setup
            Output.Update("SemiCupData", semiCup);
        }

    }
}

THINKORSWIM.COM: IDENTIFYING CUP FORMATIONS EARLY
In “Identifying Cup Formations Early” in this issue, author Giorgos Siligardos describes an algorithm for identifying possible cup-and-handle formations.
We have created two study files utilizing our proprietary programming language, thinkScript. When applied, the studies provide the algorithm for Siligardos’ methodology.
The code, along with instructions for applying it, is shown here.
- From our TOS Charts, Select Studies → Edit Studies
- Select “New” in the lower left hand corner.
- Name the Study (i.e. SemiCupFormation)
- Click in the script editor window, remove “plot Data = close;” and paste the following:
input price = close; input minLength = 20; input maxLength = 252; input factor = 2.0; script VariableSumMax { input price = close; input index1 = 0; input index2 = 0; input maxOffset = 0; def inf = 1 / 0; plot VSum = fold i = index1 to index2 with s do s + getValue(price, i, maxOffset); plot VMax = fold i = index1 to index2 with m = -inf do Max(m, getValue(price, i, maxOffset)); } def LogPrice = log(price); def DXPlus = Max(LogPrice - LogPrice[1], 0); def DXMinus = Max(LogPrice[1] - LogPrice, 0); def offset = fold i = MinLength to MaxLength + 1 with off = -1 do if off = = -1 and getValue(price, i, MaxLength) > price * factor then i else off; def HiLogPrice = if IsNaN(getValue(LogPrice, offset, MaxLength)) then LogPrice else getValue(LogPrice, offset, MaxLength); def LoLogPrice = -VariableSumMax(-LogPrice, 0, offset + 1, MaxLength).VMax; def B2Offset = if offset < 0 then -1 else round(offset * 0.6, 0); def B3Offset = if offset < 0 then -1 else round(offset * 0.4, 0); def L2 = LoLogPrice * 0.6 + HiLogPrice * 0.4; def L3 = LoLogPrice * 0.4 + HiLogPrice * 0.6; def eps = 0.000000001; def SumDXPlusB0toB2 = VariableSumMax(DXPlus, B2Offset + 1, offset + 1, MaxLength).VSum; def SumDXMinusB0toB2 = VariableSumMax(DXMinus, B2Offset + 1, offset + 1, MaxLength).Vsum; def DX1 = AbsValue(SumDXPlusB0toB2 - SumDXMinusB0toB2) / (SumDXPlusB0toB2 + SumDXMinusB0toB2 + eps) * 100; def SumDXPlusB2toB5 = VariableSumMax(DXPlus, 0, B2Offset + 1, MaxLength).VSum; def SumDXMinusB2toB5 = VariableSumMax(DXMinus, 0, B2Offset + 1, MaxLength).VSum; def DX2 = AbsValue(SumDXPlusB2toB5 - SumDXMinusB2toB5) / (SumDXPlusB2toB5 + SumDXMinusB2toB5 + eps) * 100; def HighestB2toB3 = VariableSumMax(LogPrice, B3Offset + 1, B2Offset + 1, MaxLength).VMax; def HighestB3toB5 = VariableSumMax(LogPrice, 0, B3Offset + 1, MaxLength).VMax; plot SemiCup = offset > 0 and DX1 > 25 and DX2 < 25 and HighestB2toB3 < L3 and HighestB3toB5 < L2; SemiCup.SetDefaultColor(GetColor(2)); SemiCup.SetPaintingStrategy(PaintingStrategy.BOOLEAN_POINTS); SemiCup.SetLineWeight(3); AddChartLabel(SemiCup, concat("Semi-Cup formation size: ", offset + 1), GetColor(2)); - Select OK.
- Select “New” in the lower left hand corner.
- Name the Study (i.e. SemiCupVisual). Click in the script editor window, remove “plot Data = close;” and paste the following:
input price = close;
input length = 100;
def formation = IsNaN(price[-length]);
def t = length - sum(formation, length);
def inf = 1 / 0;
def Hi = HighestAll(if formation then price else -inf);
def Lo = LowestAll(if formation then price else inf);
def a = (Hi - Lo) / Power(length - 1, 10);
plot Cup = if formation then Min(Hi, a * Power(t, 10) + 0.98 * Lo) else Double.NaN;
Cup.SetDefaultColor(GetColor(2));
- Select OK.
- Select OK to apply the studies to the chart.
A sample chart is shown in Figure 3.
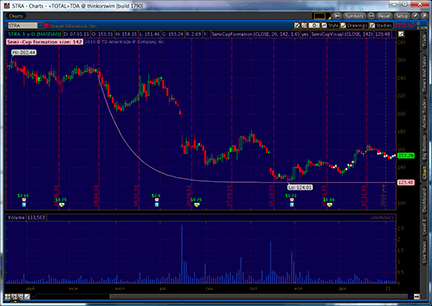
Figure 3: THINKORSWIM, CUP FORMATION IDENTIFICATION

eSIGNAL: IDENTIFYING CUP FORMATIONS EARLY
For this month’s Traders’ Tip, we’ve provided the formulas SemiCup.efs and isSemiCup.efs based on the formula code from the Giorgos Siligardos’ article in this issue, “Identifying Cup Formations Early.”
With eSignal’s new 11.0 application, it is now possible to apply Efs formulas to a Watch List window. This month’s article provides a practical example of how one might use this new feature. The isSemiCup formula has been designed specifically for the Watch List, which highlights from a custom list of symbols those that are currently meeting the criteria for the cup formation (Figure 4). This formula displays the text message “Semicup” or “No cup” for each symbol. This study column can then be manually or automatically sorted to bring the list of symbols to the top to quickly identify the symbols that have formed the cup formation. If the Watch List is linked to a chart, clicking on the symbol will send that symbol to the chart (Figure 5) to view current price action relative to the cup formation, which is being drawn by the SemiCup formula.
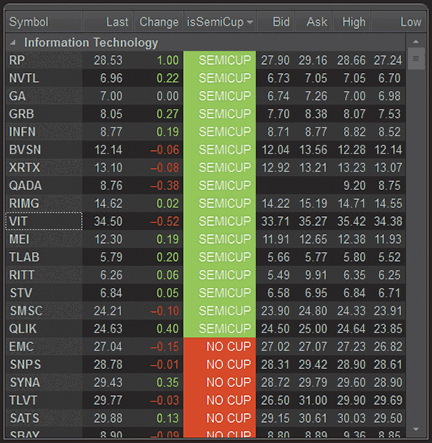
FIGURE 4: eSignal, Watch List window. The isSemiCup formula highlights from a custom list of symbols those that are currently meeting the criteria for the cup formation.
Both studies contain formula parameters to set the colors for identifying a semi-cup or no semi-cup states, which may be configured through the Edit Chart window. The SemiCup study also has an option to hide or show the grid. The SemiCup study may also be used with eSignal 10.6.
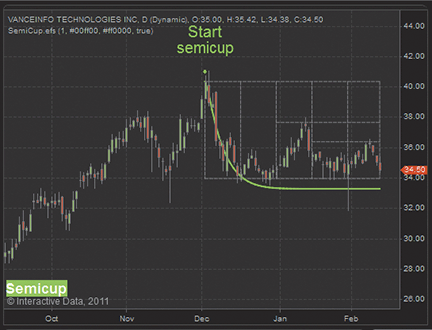
Figure 5: eSIGNAL, semi-cup study. Clicking on a symbol in the Watch List will send that symbol to the chart, if the Watch List is linked to a chart. The SemiCup formula draws the semi-cup indicator on the chart so the user can view current price action relative to the cup formation.
To discuss this study or download complete copies of the formula code, please visit the Efs Library Discussion Board forum under the Forums link from the Support menu www.esignal.com or visit our Efs KnowledgeBase at https://www.esignal.com/support/kb/efs/. The eSignal formula scripts (Efs) are also available for copying and pasting from below.
SemiCup.efs
/*********************************
Provided By:
    Interactive Data Corporation (Copyright © 2010)
    All rights reserved. This sample eSignal Formula Script (EFS)
    is for educational purposes only. Interactive Data Corporation
    reserves the right to modify and overwrite this EFS file with
    each new release.

Description:
    Identifying Cup Formation Early

Version:            1.0  11/02/2011

Formula Parameters:                     Default:
    Parameter                              1

Notes:
    The related article is copyrighted material. If you are not
    a subscriber of Stocks & Commodities, please visit www.traders.com.
**********************************/

var fpArray = new Array();
var bVersion = null;
function preMain()
{
    setPriceStudy(true);
    setShowCursorLabel(false);


    var x=0;
    fpArray[x] = new FunctionParameter("gParam", FunctionParameter.NUMBER);
    with(fpArray[x++])
    {
	setName("Parameter");
	setLowerLimit(1);
        setUpperLimit(100);
        setDefault(1);
    }
    fpArray[x] = new FunctionParameter("gColorSC", FunctionParameter.COLOR);
    with(fpArray[x++])
    {
	setName("Semicup Color");
        setDefault(Color.lime);
    }
    fpArray[x] = new FunctionParameter("gColorNC", FunctionParameter.COLOR);
    with(fpArray[x++])
    {
	setName("No Cup Color");
        setDefault(Color.red);
    }
    fpArray[x] = new FunctionParameter("gGrid", FunctionParameter.BOOLEAN);
    with(fpArray[x++])
    {
	setName("Show Grid");
        setDefault(true);
    }

}

var bInit = false;
var xCls = null;
var xFilC = null;
var eps = 0.0000000001;
var vCls = 0;
var nCupPeriod = 0;

var pTop = 0;
var pBot = 0;
var b0 = 0;
var b1 = 0;
var b2 = 0;
var b3 = 0;
var b4 = 0;
var b5 = 0;
var L2 = 0;
var L3 = 0;

var L1 = 0;
var L4 = 0;

var DSX1 = 0;
var DSX2 = 0;
var bIsSemiCup = false;

function main(gParam, gColorSC, gColorNC, gGrid)
{
    if (bVersion == null) bVersion = verify();
    if (bVersion == false) return;
    if (gParam == null) gParam = 1;

    if (!bInit)
    {
            xCls = close();
            xFilC = efsInternal("calcFilC", xCls);
            bInit = true;
    }

    if( getCurrentBarIndex() < 0 ) return;
    var nBarState = getBarState();
    if ( nBarState == BARSTATE_NEWBAR || isReplayMode())
    {

        var nBarCount = getCurrentBarCount();

        //potential semicup period calculation
        var vLast = gParam*xCls.getValue(0);
        var curBar = 1 ;
        var curMax = vLast;
        while (curBar < nBarCount)
        {
            vCloseCur = xCls.getValue(-curBar);
            if ( vCloseCur >= vLast && vCloseCur >= curMax )
            {
                nCupPeriod = curBar;
                curMax = vCloseCur;
            }
            curBar++;
        }

        //calculation of grid parameters
        pTop = xFilC.getValue(0);
        pBot = xFilC.getValue(0);
        iBot = 0;
        iTop = 0;
        for (i = -nCupPeriod; i<0; i++)
        {
            if ( pTop < xFilC.getValue(i) ) pTop = xFilC.getValue(i);
            if ( pBot > xFilC.getValue(i) ) pBot = xFilC.getValue(i);
        }
        bHeight = Math.abs((pTop - pBot)/5);
        bLength = Math.max(Math.round(nCupPeriod/5),1);
        b0 = -nCupPeriod;
        b5 = 0;
        b1 = Math.min(b0 + bLength, b5);
        b2 = Math.min(b1 + bLength, b5);
        b3 = Math.min(b2 + bLength, b5);
        b4 = Math.min(b3 + bLength, b5);
        L2 = pBot + 2*bHeight;
        L3 = pBot + 3*bHeight;

        //calculation of directional strength 1
        var DSX1P = 0;
        var DSX1N = 0;
        for (i = b0; i < b2; i++ )
        {
            DSX1P += Math.max(xFilC.getValue(i+1)-xFilC.getValue(i),0);
            DSX1N += Math.max(xFilC.getValue(i)-xFilC.getValue(i+1),0);
        }
        DSX1 = 100 * Math.abs(DSX1P - DSX1N)/( eps + DSX1P + DSX1N );

        //calculation  directional strength 2
        var DSX2P = 0;
        var DSX2N = 0;
        var bInside1 = false;
        var bInside2 = false;
        for (i = b2; i < b5; i++ )
        {
            DSX2P += Math.max(xFilC.getValue(i+1)-xFilC.getValue(i),0);
            DSX2N += Math.max(xFilC.getValue(i)-xFilC.getValue(i+1),0);
            if ( xFilC.getValue(i)>L3 ) bInside1=true;
            if ( i >= b3 && xFilC.getValue(i)>L2 ) bInside2=true;
        }
        DSX2 = 100 * Math.abs(DSX2P - DSX2N)/( eps + DSX2P + DSX2N );

        //checking condition of cup existing
        bIsSemiCup = (nCupPeriod >=20 && DSX1 > 25 && DSX2 < 25 && !bInside1 && !bInside2 )  ;
        //plotting grid
        if (gGrid)
        {
            drawLineRelative(b0, Math.exp(pTop),b0, Math.exp(pBot), PS_DASH, 1, Color.grey, "b0");
            drawLineRelative(b1, Math.exp(pTop),b1, Math.exp(pBot), PS_DASH, 1, Color.grey, "b1");
            drawLineRelative(b2, Math.exp(pTop),b2, Math.exp(pBot), PS_DASH, 1, Color.grey, "b2");
            drawLineRelative(b3, Math.exp(pTop),b3, Math.exp(pBot), PS_DASH, 1, Color.grey, "b3");
            drawLineRelative(b4, Math.exp(pTop),b4, Math.exp(pBot), PS_DASH, 1, Color.grey, "b4");
            drawLineRelative(b5, Math.exp(pTop),b5, Math.exp(pBot), PS_DASH, 1, Color.grey, "b5");
            drawLineRelative(b0, Math.exp(pTop),b5, Math.exp(pTop), PS_DASH, 1, Color.grey, "l0");
            drawLineRelative(b0, Math.exp(pBot),b5, Math.exp(pBot), PS_DASH, 1, Color.grey, "l5");
            drawLineRelative(b2, Math.exp(L3),b5, Math.exp(L3), PS_DASH, 1, Color.grey, "l3");
            drawLineRelative(b3, Math.exp(L2),b5, Math.exp(L2), PS_DASH, 1, Color.grey, "l2");

        }
    }// if (nBarState == BARSTATE_NEWBAR)....

    //correction of conditions on real time ticks
    var bRTCond = true;
    if (nBarState == BARSTATE_CURRENTBAR) bRTCond = ( xFilC.getValue(0) < L2 );

    //options of result output
    var strSemiCup = "No Cup";
    var retCol = gColorNC;
    if ( bIsSemiCup && bRTCond )
    {
            strSemiCup = "Semicup";
            retCol = gColorSC;
    }

    //marking the position of potentional starting of semicup
    drawTextRelative(-nCupPeriod, AboveBar3, "Start", retCol, null, Text.PRESET|Text.CENTER, "Arial", 12, "beg1");
    drawTextRelative(-nCupPeriod, AboveBar2, "semicup", retCol, null, Text.PRESET|Text.CENTER, "Arial", 12, "beg2");
    drawShapeRelative(-nCupPeriod, AboveBar1, Shape.DOWNARROW, null, retCol, Shape.PRESET|Shape.CENTER, "beg3" );

    //plotting graph
    P1 = (Math.exp(pTop)-Math.exp(pBot))/Math.pow(nCupPeriod,10);
    P2 = 0.98 * Math.exp(pBot);
    prevY = close(-nCupPeriod);
    for (i=0; i<nCupPeriod; i++)
    {
        curY = P1 * Math.pow(nCupPeriod-i,10)+P2;
        drawLineRelative(i-nCupPeriod, prevY, i-nCupPeriod+1, curY, PS_SOLID, 2, retCol, i);
        prevY = curY;
    }

    drawTextAbsolute(0, 15, strSemiCup, Color.white, retCol, Text.BOLD|Text.RELATIVETOBOTTOM|
    Text.RELATIVETOLEFT, "Arial", 11, "txt");
    return null;
}

var bFilCInit = false;
function calcFilC(xSrc)
{
        var vSrc = xSrc.getValue(0);
        vSrc = Math.log(vSrc);
        return vSrc;
}

function verify() {
    var b = false;
    if (getBuildNumber() < 779) {
        drawTextAbsolute(5, 35, "This study requires version 8.0 or later.",
            Color.white, Color.blue, Text.RELATIVETOBOTTOM|Text.RELATIVETOLEFT|Text.BOLD|Text.LEFT,
            null, 13, "error");
        drawTextAbsolute(5, 20, "Click HERE to upgrade.@URL=https://www.esignal.com/download/default.asp",
            Color.white, Color.blue, Text.RELATIVETOBOTTOM|Text.RELATIVETOLEFT|Text.BOLD|Text.LEFT,
            null, 13, "upgrade");
        return b;
    } else {
        b = true;
    }
    return b;
}


isSemiCup.efs

/*********************************
Provided By:
    Interactive Data Corporation (Copyright © 2010)
    All rights reserved. This sample eSignal Formula Script (EFS)
    is for educational purposes only. Interactive Data Corporation
    reserves the right to modify and overwrite this EFS file with
    each new release.

Description:
    Identifying Cup Formation Early For Grid Window

Version:            1.0  11/02/2011

Formula Parameters:                     Default:
    Parameter                              1

Notes:
    The related article is copyrighted material. If you are not
    a subscriber of Stocks & Commodities, please visit www.traders.com.

**********************************/
var fpArray = new Array();
var bVersion = null;
function preMain()
{
    setPriceStudy(true);
    setCursorLabelName("isSemiCup",0);

    var x=0;
    fpArray[x] = new FunctionParameter("gParam", FunctionParameter.INTEGER);
    with(fpArray[x++])
    {
	setName("Parameter");
	setLowerLimit(1);
        setUpperLimit(100);
        setDefault(1);
    }
    fpArray[x] = new FunctionParameter("gColorSC", FunctionParameter.COLOR);
    with(fpArray[x++])
    {
	setName("Semicup Color");
        setDefault(Color.lime);
    }
    fpArray[x] = new FunctionParameter("gColorNC", FunctionParameter.COLOR);
    with(fpArray[x++])
    {
	setName("No Cup Color");
        setDefault(Color.red);
    }
}

var bInit = false;
var xCls = null;
var xFilC = null;
var eps = 0.0000000001;
var vCls = 0;
var nCupPeriod = 0;

var pTop = 0;
var pBot = 0;
var b0 = 0;
var b1 = 0;
var b2 = 0;
var b3 = 0;
var b4 = 0;
var b5 = 0;
var L2 = 0;
var L3 = 0;

var DSX1 = 0;
var DSX2 = 0;
var bIsSemiCup = false;

function main(gParam, gColorSC, gColorNC)
{
    if (bVersion == null) bVersion = verify();
    if (bVersion == false) return;
    if (gParam == null) gParam = 1;

    if (!bInit)
    {
            xCls = close();
            xFilC = efsInternal("calcFilC", xCls);
            bInit = true;
    }

    if( getCurrentBarIndex() < 0 ) return;

    var nBarState = getBarState();
    if ( nBarState == BARSTATE_NEWBAR )
    {
        var nBarCount = getCurrentBarCount();

        //potential semicup period calculation
        var vLast = gParam*xCls.getValue(0);
        var curBar = 1 ;
        var curMax = vLast;
        while (curBar < nBarCount)
        {
            var vCloseCur = xCls.getValue(-curBar);
            if ( vCloseCur >= vLast && vCloseCur >= curMax )
            {
                nCupPeriod = curBar;
                curMax = vCloseCur;
            }
            curBar++;
        }

        //calculation of grid parameters
        pTop = xFilC.getValue(0);
        pBot = xFilC.getValue(0);
        for (i = -nCupPeriod; i<0; i++)
        {
            if ( pTop < xFilC.getValue(i) ) pTop = xFilC.getValue(i);
            if ( pBot > xFilC.getValue(i) ) pBot = xFilC.getValue(i);
        }
        var bHeight = Math.abs((pTop - pBot)/5);
        var bLength = Math.max(Math.round(nCupPeriod/5),1);
        b0 = -nCupPeriod;
        b5 = 0;
        b1 = Math.min(b0 + bLength, b5);
        b2 = Math.min(b1 + bLength, b5);
        b3 = Math.min(b2 + bLength, b5);
        b4 = Math.min(b3 + bLength, b5);
        L2 = pBot + 2*bHeight;
        L3 = pBot + 3*bHeight;

        //calculation of directional strength 1
        var DSX1P = 0;
        var DSX1N = 0;
        for (i = b0; i < b2; i++ )
        {
            DSX1P += Math.max(xFilC.getValue(i+1)-xFilC.getValue(i),0);
            DSX1N += Math.max(xFilC.getValue(i)-xFilC.getValue(i+1),0);
        }
        DSX1 = 100 * Math.abs(DSX1P - DSX1N)/( eps + DSX1P + DSX1N );

        //calculation of define directional strength 2
        var DSX2P = 0;
        var DSX2N = 0;
        var bInside1 = false;
        var bInside2 = false;
        for (i = b2; i < b5; i++ )
        {
            DSX2P += Math.max(xFilC.getValue(i+1)-xFilC.getValue(i),0);
            DSX2N += Math.max(xFilC.getValue(i)-xFilC.getValue(i+1),0);
            if ( xFilC.getValue(i)>L3 ) bInside1=true;
            if ( i >= b3 && xFilC.getValue(i)>L2 ) bInside2=true;
        }
        DSX2 = 100 * Math.abs(DSX2P - DSX2N)/( eps + DSX2P + DSX2N );

        //checking conditions of cup existing
        bIsSemiCup = (nCupPeriod >=20 && DSX1 > 25 && DSX2 < 25 && !bInside1 && !bInside2 )  ;
    }

    if (nBarState == BARSTATE_CURRENTBAR) bIsSemiCup = ( bIsSemiCup && xFilC.getValue(0) < L3 );

    //output options
    var strSemiCup = "NO CUP";
    var retColor = gColorNC;
    if ( bIsSemiCup )
    {
            strSemiCup = "SEMICUP";
            retColor = gColorSC;
    }

    setBarBgColor(retColor,0);
    setBarFgColor(Color.white,0);

    return strSemiCup;

}

var bFilCInit = false;
function calcFilC(xSrc)
{
        var vSrc = xSrc.getValue(0);
        vSrc = Math.log(vSrc);
        return vSrc;
}

function verify() {
    var b = false;
    if (getBuildNumber() < 779) {
        drawTextAbsolute(5, 35, "This study requires version 8.0 or later.",
            Color.white, Color.blue, Text.RELATIVETOBOTTOM|Text.RELATIVETOLEFT|Text.BOLD|Text.LEFT,
            null, 13, "error");
        drawTextAbsolute(5, 20, "Click HERE to upgrade.@URL=https://www.esignal.com/download/default.asp",
            Color.white, Color.blue, Text.RELATIVETOBOTTOM|Text.RELATIVETOLEFT|Text.BOLD|Text.LEFT,
            null, 13, "upgrade");
        return b;
    } else {
        b = true;
    }
    return b;
}

WEALTH-LAB: IDENTIFYING CUP FORMATIONS EARLY
This Traders’ Tip is based on “Identifying Cup Formations Early” by Giorgos Siligardos in this issue.
Unsatisfied with scanning only for current semi-cups, we modified Siligardos’ excellent algorithm to be more apt for backtesting by identifying and drawing every semi-cup detected in a chart. By keying off of minor peaks and assuming that a semi-cup forms after each one, the amount of processing is greatly reduced and simultaneously eliminates the need to look back to an arbitrary level above the current price. To reduce the number of second peaks that form the same semi-cup, we added an extra grid constraint, making the second column in the top row a “yellow box,” as described in Siligardos’ article.
Once a semi-cup is detected, only two possible outcomes exist: it fails by making a new low or it starts turning up. New low failures are recorded for each semi-cup and the peak pattern reenters “search mode” on the following bar, at which time the grid is recalculated based on the new L0 low. Most often, a new semi-cup is detected immediately. On the other hand, if price turns up and exceeds the L2 level, this is judged as a success and the semi-cup is frozen. In either case, the outcome is important to evaluate at every bar when backtesting, and these are indicated visually by red and blue arrows. Using the information in our semi-cup objects, we can even display the reference grid (Figure 6).
At the time of this writing (mid-February), an S&P 500 scan for semi-cups with a minimum of 30 weekly bars returned the following stock symbols: Aee, Aye, Erts, Etfc, Exc, FE, Gme, Hrb, Key, Lll, Lly, MO, Pbi, Ppl, Sai, Vlo, and Wfr.
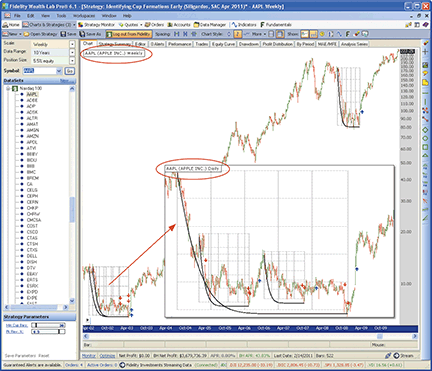
Figure 6: WEALTH-LAB, CUP FORMATION IDENTIFICATION INDICATOR. After a few semi-cup failures (red arrows), AAPL formed the mother of all cup and handles in early 2003. Note that in the daily chart (inset), the mother cup spawned two “nested” semi-cups.
Wealth-Lab code:

C# Code:  (Abriged version)

using System;
using System.Collections.Generic;
using System.Text;
using System.Drawing;
using WealthLab;
using WealthLab.Indicators;

namespace WealthLab.Strategies
{
   public enum CupStatus {Search, SemiCupDetected, LevelExceeded, Failure, FormingCup}

   public class TASCSemiCups : WealthScript
   {
      StrategyParameter _minCupBars;
      StrategyParameter _reversalPct;

      public TASCSemiCups ()
      {
         _minCupBars = CreateParameter("Min Cup Bars", 20, 20, 100, 10);
         _reversalPct = CreateParameter("Peak Reverse %", 5, 0.5, 8, 0.5);
      }

      // SemiCups is the SemiCup class container
      class SemiCups
      {
         /* Implementation removed for space */
      }

      // SemiCup defines the "grid" and holds the Status of each cup
      class SemiCup
      {
         /* Implementation removed for space */
      }

      protected override void Execute()
      {
         DataSeries peakBars = PeakBar.Series(Close, _reversalPct.Value, PeakTroughMode.Percent);
         SemiCups semiCups = new SemiCups(this, _minCupBars.ValueInt, peakBars);
         semiCups.ProcessSemiCups();
         semiCups.Draw();

         // Scan for current pattern
         foreach (KeyValuePair<int, SemiCup> kvp in semiCups.Cups)
         {
            SemiCup sc = kvp.Value;
            if (sc.Active && sc.Status == CupStatus.SemiCupDetected)
               BuyAtMarket(Bars.Count);
         }
      }
   }
}


C# Code:  (Verbose  version)

using System;
using System.Collections.Generic;
using System.Text;
using System.Drawing;
using WealthLab;
using WealthLab.Indicators;

namespace WealthLab.Strategies
{
   public enum CupStatus {Search, SemiCupDetected, LevelExceeded, Failure, FormingCup}

   public class TASCSemiCups : WealthScript
   {
      StrategyParameter _minCupBars;
      StrategyParameter _reversalPct;

      public TASCSemiCups ()
      {
         _minCupBars = CreateParameter("Min Cup Bars", 20, 20, 100, 10);
         _reversalPct = CreateParameter("Peak Reverse %", 5, 0.5, 8, 0.5);
      }

      // SemiCups is the SemiCup class container
      class SemiCups
      {
         Font font = new Font("Wingdings", 8, FontStyle.Bold);
         string dnArrow = Convert.ToChar(0x00EA).ToString();
         string upArrow = Convert.ToChar(0x00E9).ToString();

         private WealthScript ws;
         private int minBars;

         public Dictionary<int, SemiCup> Cups = new Dictionary<int, SemiCup>();
         public DataSeries PkBarSer;
         public DataSeries LnC;
         public DataSeries closeMo;

         public SemiCups(WealthScript ws, int minBars, DataSeries pkBarSer)
         {
            this.ws = ws;
            this.minBars = minBars;
            LnC = new DataSeries(ws.Bars, "Log(Close)");
            for(int bar = 0; bar < ws.Bars.Count; bar++)
               LnC[bar] = Math.Log(ws.Bars.Close[bar]);
            closeMo = LnC - (LnC >> 1);

            int lastPkBar = -1;
            for (int bar = minBars; bar < LnC.Count - minBars; bar++)
            {
               int pkBar = (int)pkBarSer[bar];   // Init semicups at peaks
               if (pkBar != lastPkBar)
               {
                  Cups.Add(pkBar, new SemiCup(pkBar, Math.Max(pkBar + minBars, bar), LnC, closeMo));
                  lastPkBar = pkBar;
               }
            }
         }

         public void ProcessSemiCups()
         {
            foreach (KeyValuePair<int, SemiCup> kvp in Cups)
            {
               SemiCup sc = kvp.Value;
               for (int bar = kvp.Key; bar < LnC.Count; bar++)
                  sc.UpdateCup(bar);
            }
         }

         public void Draw()
         {
            Color gridColor = Color.FromArgb(60, Color.Gray);
            foreach (KeyValuePair<int, SemiCup> kvp in Cups)
            {
               SemiCup sc = kvp.Value;
               int scCount = sc.SemiCupBars.Count;
               if (scCount < 1) continue;

               if (sc.Status == CupStatus.Search || sc.Status == CupStatus.LevelExceeded) continue;
               Color clr = Color.Black;
               if (sc.Status == CupStatus.Failure) clr = Color.Red;

               double Ptop = sc.L[5];
               double Pbot = sc.L[0];
               double a = ( Math.Exp(Ptop) - Math.Exp(Pbot) ) / Math.Pow(sc.B[0] - sc.B[5], 10);

               double ePtop = Math.Exp(Ptop);
               double ePbot98 = 0.98 * Math.Exp(Pbot);
               double last = -1;

               for(int bar = sc.B[0]; bar <= sc.B[5]; bar++)
               {
                  double f = a * Math.Pow(bar - sc.B[5], 10) + ePbot98;
                  double line = Math.Min(ePtop, f);
                  if (last > -1)
                     ws.DrawLine(ws.PricePane, bar - 1, last, bar, line, clr, LineStyle.Solid, 2);
                  last = line;
               }

               // DrawGrid at first semicup detection
               int firstDetected = sc.SemiCupBars[0];
               ws.PrintDebug(sc.B[0] + " - Semi Cup Bars: " + sc.SemiCupBars.Count);
               double[] L = new double[6];   // L[0] = Pbot; L[5] = Ptop
               L[5] = LnC[sc.B[0]];         // Ptop
               L[0] = Lowest.Value(firstDetected, LnC, firstDetected - sc.B[0]);
               double d = (L[5] - L[0]) / 5d;
               for (int n = 1; n < 5; n++)
                  L[n] = L[n-1] + d;

               for (int n = 0; n <= 5; n++)
               {
                  double val = Math.Exp(sc.L[n]);
                  ws.DrawLine(ws.PricePane, sc.B[0], val, sc.B[5], val, gridColor,
                   LineStyle.Dashed, 2);
                  ws.DrawLine(ws.PricePane, sc.B[n], Math.Exp(Ptop), sc.B[n], Math.Exp(Pbot),
                   Color.Gray,
                   LineStyle.Dashed, 1);
               }

               // Show failures with red down arrows
               for (int n = 0; n < sc.FailureBars.Count; n++)
                  ws.AnnotateBar(dnArrow, sc.FailureBars[n], true, Color.Red, Color.Transparent, font);

               // Show successes with blue up arrows
               if (sc.Status == CupStatus.FormingCup)
                  ws.AnnotateBar(upArrow, sc.SemiCupBars[scCount - 1], false, Color.Blue, Color.Transparent, font);
            }
         }
      }

      // SemiCup defines the "grid" and holds the Status of each cup
      class SemiCup
      {
         public CupStatus Status = CupStatus.Search;
         private DataSeries _lnC;
         private DataSeries _mo;
         public bool Active = true;      // set to false after failure or determined to form a cup.
         public int BarInactive = -1;
         public int BoxLength;

         public List<int> SemiCupBars = new List<int>();
         public List<int> FailureBars = new List<int>();
         public int[] B = new int[6];
         public double[] L = new double[6];   // L[5] is Ptop

         public SemiCup(int B0, int B5, DataSeries lnClose, DataSeries momentum)
         {
            _lnC = lnClose;
            _mo = momentum;
            B[0] = B0;  B[5] = B5;
            UpdateGrid(B5);
            UpdateCup(B5);
         }

         private void UpdateGrid(int bar)
         {
            B[5] = bar;
            BoxLength = (B[5] - B[0]) / 5;
            for (int n = 1; n < 5; n++)
               B[n] = B[n-1] + BoxLength;

            L[5] = _lnC[B[0]];  // Ptop
            L[0] = Lowest.Value(bar, _lnC, bar - B[0]);
            double d = (L[5] - L[0]) / 5d;
            for (int n = 1; n <= 5; n++)
               L[n] = L[n-1] + d;
         }

         internal void UpdateCup(int bar)
         {
            if (!Active || bar < B[5]) return;
            switch (Status)
            {
               case CupStatus.Search:
                  if (_lnC[bar] > L[4])
                  {
                     Active = false;
                     BarInactive = bar;
                     Status = CupStatus.LevelExceeded;
                  }
                  else // update the grid and test for semicup
                  {
                     UpdateGrid(bar);

                     // Min cup bar rule already passed if it gets to here
                     bool isSemiCup = this.dX(2) > 25 && this.dX(3) < 25
                        && Highest.Value(B[3], _lnC, B[3] - B[2] + 1) < L[3]
                        && Highest.Value(B[5], _lnC, B[5] - B[3] + 1) < L[2]
                        && Highest.Value(B[2], _lnC, B[2] - B[1] + 1) < L[4];

                     if (isSemiCup) Status = CupStatus.SemiCupDetected;
                  }
                  break;

               case CupStatus.SemiCupDetected:
                  if (_lnC[bar] > L[2])
                  {
                     Active = false;
                     BarInactive = bar;
                     Status = CupStatus.FormingCup;
                     SemiCupBars.Add(bar);
                  }
                  else if (_lnC[bar] < L[0] )
                  {
                     Status = CupStatus.Search;
                     FailureBars.Add(bar);
                  }
                  break;

               default:
                  return;
                  break;
            }
            if (Status == CupStatus.SemiCupDetected)
               SemiCupBars.Add(bar);
         }

         // pass 2 or 3 to boxLengthMultiple for B2 or B3, respectively
         public double dX(int boxLengthMultiple)
         {
            int start = this.B[0];
            int end = this.B[2];
            if (boxLengthMultiple == 3)
            {
               start = this.B[2];
               end = this.B[5];
            }
            int period = end - start;
            double dXPlus = 0;
            double dXMinus = 0;
            for (int bar = start + 1; bar <= end; bar++)
            {
               if (_mo[bar] > 0)
                  dXPlus += _mo[bar];
               else
                  dXMinus += Math.Abs(_mo[bar]);
            }
            dXPlus /= period;
            dXMinus /= period;
            return 100 * Math.Abs(dXPlus - dXMinus)/(dXPlus + dXMinus);
         }
      }

      protected override void Execute()
      {
         DataSeries peakBars = PeakBar.Series(Close, _reversalPct.Value, PeakTroughMode.Percent);
         SemiCups semiCups = new SemiCups(this, _minCupBars.ValueInt, peakBars);
         semiCups.ProcessSemiCups();
         semiCups.Draw();

         // Scan for current pattern
         foreach (KeyValuePair<int, SemiCup> kvp in semiCups.Cups)
         {
            SemiCup sc = kvp.Value;
            if (sc.Active && sc.Status == CupStatus.SemiCupDetected)
               BuyAtMarket(Bars.Count);
         }
      }
   }
}

AMIBROKER: IDENTIFYING CUP FORMATIONS EARLY
In “Identifying Cup Formations Early” in this issue, author Giorgos Siligardos presents a pattern-detection formula for cup formations.
Our AmiBroker Formula Language implementation is based on the algorithm given in Siligardos’ article; however, it operates not only on the last bar but also on user-selected bars. We have prepared a ready-to-use AmiBroker formula, which can be viewed below as well as at www.amibroker.com. To use the formula, enter the code set in the Afl Editor, then press “Insert Indicator” or the “Send to Automatic Analysis” button. In the indicator mode, you can move the vertical selection line to check for the cup formation on any date (not only the last bar). In the exploration mode, you simply run the exploration and it will list detected cup formations if any are present for the date selected as the end of the exploration range.
A sample chart is shown in Figure 7.
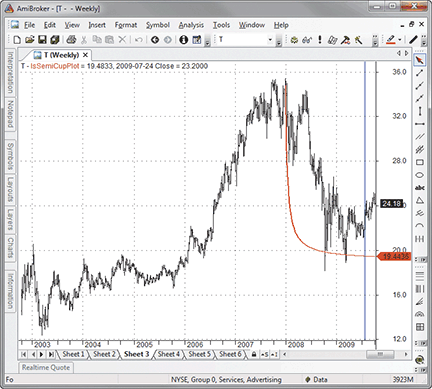
Figure 7: AMIBROKER, CUP FORMATION IDENTIFICATION INDICATOR. This sample weekly chart of AT&T shows detected semi-cup formations (red line). Parameter=1.5, selected date = 07/24/2009
AmiBroker code
Parameter = Param( "parameter", 1.5, 1, 10, 0.1 );

FilC = ( log( C ) );

eps = 0.0000000001;
// basic Definitions
semicupperiod = SelectedValue( Max( BarsSince( C >= SelectedValue( C * parameter ) ), 1 ) ) + 1;

Ptop = SelectedValue( HHV( FilC, Semicupperiod ) );
Pbot = SelectedValue( LLV( FilC, Semicupperiod ) );
boxheight = SelectedValue( abs( Ptop - Pbot ) / 5 );
boxlength = SelectedValue( Max( int( semicupperiod / 5 ), 1 ) );

//   Grid Nodes
bar = Cum( 1 );
b0 = SelectedValue( bar - semicupperiod + 1 );
b5 = SelectedValue( bar );
b1 = SelectedValue( Min( b0 + boxlength, b5 ) );
b2 = SelectedValue( Min( b1 + boxlength, b5 ) );
b3 = SelectedValue( Min( b2 + boxlength, b5 ) );
b4 = SelectedValue( Min( b3 + boxlength, b5 ) );
L2 = Pbot + 2 * boxheight;
L3 = Pbot + 3 * boxheight;

// Directional Strength
Diff = FilC - Ref( FilC, -1 );
UpSum2 = Sum( Max( Diff, 0 ), 2 * boxlength );
DnSum2 = Sum( Max( -Diff, 0 ), 2 * boxlength );
DSX1 = abs( UpSum2 - DnSum2 ) / ( eps + UpSum2 + DnSum2 ) * 100;
UpSum3 = Sum( Max( Diff, 0 ), 3 * boxlength );
DnSum3 = Sum( Max( -Diff, 0 ), 3 * boxlength );
DSX2 = abs( UpSum3 - DnSum3 ) / ( eps + UpSum3 + DnSum3 ) * 100;

// Coditions
isSemicup = ( semicupperiod >= 20 ) AND
            ( Ref( DSX1, -( b5 - b2 ) ) > 25 ) AND
            ( DSX2 < 25 ) AND
            ( Cum( IIf( bar >= b2, FilC > L3, 0 ) ) == 0 ) AND
            ( Cum( IIf( bar >= b4, FilC > L2, 0 ) ) == 0 );

LIS = SelectedValue( isSemicup );
Lastbar = SelectedValue( Cum( bar ) );


Line = LIS * ( ValueWhen( LIS * bar == b0, 1 ) *
       ( ( exp( Ptop ) - exp( Pbot ) ) /
         ( bar - b0 + 2 ) * 2 + 0.98 * exp( Pbot ) ) );

if( LIS ) Plot( Line , "IsSemiCupPlot", colorRed, styleThick );
Plot( C, Date() + " Close", ParamColor("Color", colorBlack ), styleBar );

Filter = isSemicup;
AddColumn( semicupperiod, "Semicup period", 1.0 );

NEUROSHELL TRADER: IDENTIFYING CUP FORMATIONS EARLY
The indicator used in “Identifying Cup Formations Early” by Giorgos Siligardos in this issue can be implemented in NeuroShell Trader using NeuroShell Trader’s ability to call external programs. The programs may be written in C, C++, Power Basic, or Delphi.
After moving the MetaStock code given in Siligardos’ article to your preferred compiler and creating a Dll, you can insert the resulting SemiCup and SemiCupPlot indicators as follows:
- Select “New Indicator…” from the Insert menu.
- Choose the External Program & Library Calls category.
- Select the appropriate External Dll Call indicator.
- Set up the parameters to match your Dll.
- Select the Finished button.
Users of NeuroShell Trader can go to the Stocks & Commodities section of the NeuroShell Trader free technical support website to download a copy of any of this or any past Traders’ Tips.
A sample chart is shown in Figure 8.
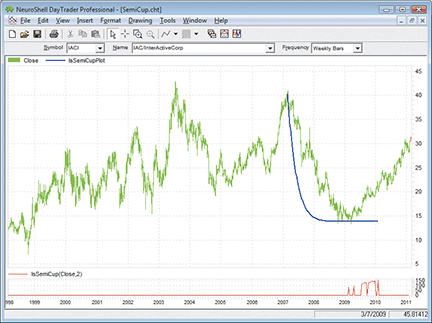
Figure 8: NEUROSHELL TRADER, CUP FORMATION IDENTIFICATION INDICATORS. This sample NeuroShell Trader chart demonstrates the SemiCupPlot and SemiCup indicators.

AIQ: IDENTIFYING CUP FORMATIONS EARLY
I have prepared the Aiq code based on Giorgos Siligardos’ article in this issue, “Identifying Cup Formations Early.” (The code can be viewed at www.traders.com.) I devised a trading system using the Russell 1000 list of stocks to test the semi-cup formation as an entry technique. The trading rules for the system are as follows:
Entering a long position:
- Using a daily time frame, enter a long position when a semi-cup formation is first detected.
- Enter the next bar at the open using a market order.
Exiting a long position:
- Use a trailing 25% exit, or
- Protect 100% of a 15% or greater profit.
- Exit the next bar at the open using a market order.
Short positions were not tested.
In Figure 9, I show the results of simulated trading on the Russell 1000 stocks, using the following parameters:
- Maximum positions per day = 3
- Maximum total positions allowed = 10
- Choose weakest candidates using 32-bar Aiq relative strength
- Size each position at 10% of total account equity recomputed every day.
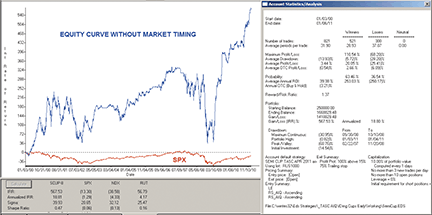
Figure 9: AIQ SYSTEMS, SAMPLE RESULTS FOR semi-cup formation SYSTEM. Here, a sample trading system using 76 actively traded NASDAQ stocks tests the semi-cup formation as an entry technique. For the test period 1/3/2000 to 1/6/2011, the average annual return was 18.8%, with a maximum drawdown of 68.8% on 11/20/2008.
For the test period 1/3/2000 to 1/6/2011, the average annual return was 18.8% with a maximum drawdown of 68.8% on 11/20/2008. Although the return is reasonably good, the maximum drawdown is larger than most could tolerate. With this in mind, I added a very simple market timing technique that added the following rules:
- Longs can only be entered when the S&P 500 is trading above its 200-day simple moving average for two or more consecutive days.
- Exit all positions when the S&P 500 falls below its 200-day simple moving average for two or more consecutive days.
For the test period 1/3/2000 to 1/6/2011, the average annual return was 10.1% with a maximum drawdown of 25.6% on 7/17/09 (see Figure 10). The drawdown was significantly reduced by the addition of the simple market timing technique. Although the average annual return was also reduced, the Sharpe ratio increased from 0.47 to 0.75, indicating a less risky approach.
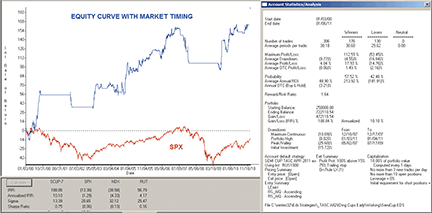
Figure 10: AIQ SYSTEMS, revised results with market timing added. For the refined semi-cup system, over the test period 1/3/2000 to 1/6/2011, the average annual return was 10.1% with a maximum drawdown of 25.6% on 7/17/09.
AIQ code:
! IDENTIFYING CUP FORMATIONS EARLY
! Author: Giorgos E. Siligardos, TASC April 2011
! Coded by: Richard Denning 2/5/11
! www.TradersEdgeSystems.com

! INPUTS:
parameter is 2.0.
semiLen is 20.

! ABBREVIATIONS:
C is [close].
OSD is offSetToDate(month(),day(),year()).
PD is {position days}.

! PATTERN RECOGNITION FUNCTIONS:
FilC is ln(C).
FilC1 is valresult(FilC,1).
SemiCupPeriod is scanany(C > ∧C * parameter,200) then OSD.
Ptop is highresult(FilC,∧semiCupPeriod).
Pbot is lowresult(FilC,∧semiCupPeriod).
boxHeight is Abs(Ptop - Pbot) / 5.
boxLength is floor(∧semiCupPeriod/5).
B0os is ∧semiCupPeriod-1.
B5os is 0.
B1os is 4*boxLength-1.
B2os is 3*boxLength-1.
B3os is 2*boxLength-1.
B4os is boxLength-1.
L2   is Pbot + 2*boxHeight.
L3   is Pbot + 3*boxHeight.

sumDX1plus is sum(max(FilC - FilC1,0),2*boxLength).
sumDX1minus is sum(max(FilC1 - FilC,0),2*boxLength).
DX1  is (abs(sumDX1plus - sumDX1minus)
	/ (sumDX1plus + sumDX1minus + 0.0000000001)) * 100.
DX1_B2os is valresult(DX1,B2os).

sumDX2plus is sum(max(FilC - FilC1,0),3*boxLength).
sumDX2minus is sum(max(FilC1 - FilC,0),3*boxLength).
DX2  is (abs(sumDX2plus - sumDX2minus)
	/ (sumDX2plus + sumDX2minus + 0.0000000001)) * 100.

Yellow1 is iff((countof(FilC > L3,B2os+1,0) = 0),1,0).
Yellow2 is iff((countof(FilC > L2,B4os+1,0) = 0),1,0).

! SYSTEM RULES:
! Note rule LE is the semi-cup identification rule

LE if hasdatafor(220)>=200 and ∧semiCupPeriod >= 20
	and DX1_B2os > 25 and DX2 < 25
	and Yellow1 = 1 and Yellow2 = 1.

! ENTRY RULE WITH MARKET TIMING TREND FILTER:
sma200 is simpleavg(C,200).
LEmkt if LE and TickerRule("SPX",countof(C>sma200,2)=2) .

!EXITS USE BUILT-IN EXITS:
!  TRAILING STOP SET TO 75
!  PROFIT PROTECT SET TO PROTECT 100% OVER 15%

! EXIT FOR "LEmkt" ENTRY RULE (ALSO USE BUILT-IN EXITS ABOVE):
LX1 if TickerRule("SPX",countof(C<sma200,2)=2).
LX if LX1 or PD >= 366.

TRADERSSTUDIO: IDENTIFYING CUP FORMATIONS EARLY
The TradersStudio code based on Giorgos Siligardos’ article in this issue, “Identifying Cup Formations Early,” is shown at www.traders.com. I devised a trading system using 76 actively traded Nasdaq stocks to test the semi-cup formation as an entry technique. The trading rules for the system are as follows:
- Using a daily time frame, enter a long position when a semi-cup formation is first detected.
- Enter the next bar at the open using a market order.
- Exit a long position after holding for 10 bars.
Short positions were not tested.
I used the EquitySizeEvenlyWithFilters trading plan to run a trading simulation. This trading plan comes with the TradersStudio software. I used the following parameters:
Session : parameter = 2, exitBars=10, startDte=0960102 (01/02/1996)
TradePlan: MaxPos=10,PerPeriod=80, FilerType=0,PerPeriod=80
In Figure 11, I show the resulting equity curve, and in Figure 12, I show the resulting underwater equity curve. In the table in Figure 13, I show the year-by-year returns for the system. The total net profit for the period was $1,167,424 with a maximum drawdown of $918,313 (59.5% on 11/20/2008).
The code can be downloaded from the TradersStudio website at www.TradersStudio.com → Traders Resources → FreeCode or www.TradersEdgeSystems.com/traderstips.htm.
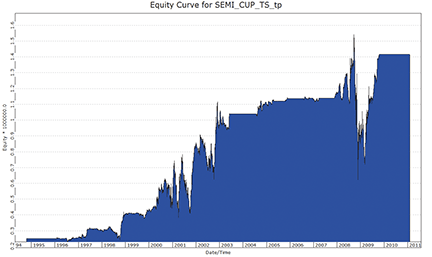
Figure 11: TRADERS-STUDIO, SEMI-CUP SYSTEM. Here is the equity curve for the semi-cup system over the period 1/2/1996 to 2/4/2011 trading a portfolio of 76 actively traded NASDAQ stocks. The system uses detected semi-cup formations as a market entry technique.
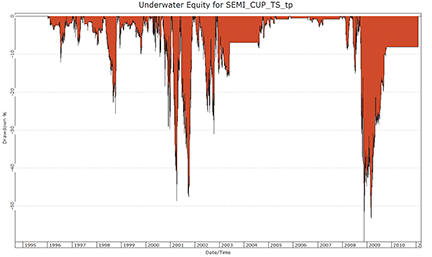
Figure 12: TRADERS-STUDIO, DRAWDOWNS. Here is the underwater equity curve for the same system over the period 1/2/1996 to 2/4/2011.
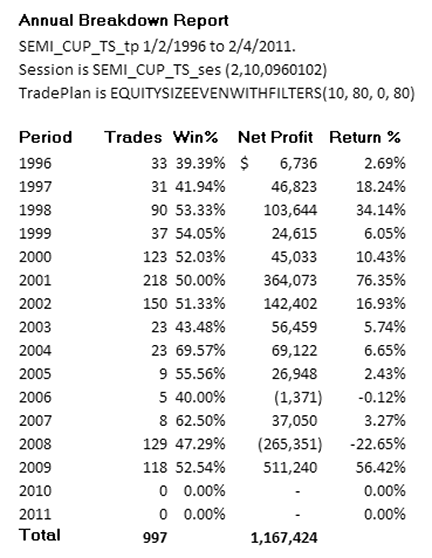
Figure 13: TRADERSSTUDIO, ANNUAL RETURN. This table shows the yearly returns for the sample system, based on starting capital of $250,000.
TradersStudio code
'IDENTIFYING CUP FORMATIONS EARLY
' Author: Giorgos E. Siligardos, TASC April 2011
' Coded by: Richard Denning 2/5/11
' www.TradersEdgeSystems.com

Function isSEMICUP(parameter, minLen)
'parameter = value between 1.5 to 5
Dim FilC As BarArray
Dim semiCupPeriod As BarArray
Dim Ptop As BarArray
Dim Pbot As BarArray
Dim MIN_SEMI_LENGTH As BarArray
Dim boxHeight,boxLength,b0,b1,b2,b3,b4,b5,L2,L3
Dim DX1 As BarArray
Dim DX2 As BarArray
Dim Yellow1, Yellow2

'basic definitions:
FilC=Log(C)
If minLen < 5 Then
    MIN_SEMI_LENGTH = 5
Else
    MIN_SEMI_LENGTH = minLen
End If

'get length of semi-cup period:
semiCupPeriod = SEMICUP_PERIOD(C,parameter)

If semiCupPeriod >= MIN_SEMI_LENGTH Then
    Ptop = Highest(FilC,semiCupPeriod)
    Pbot = Lowest(FilC,semiCupPeriod)
    boxHeight = Abs(Ptop - Pbot) / 5
    boxLength = CInt(semiCupPeriod/5)

    'grid nodes:
    'note:barnumbers are zero based
    b0 = BarNumber - semiCupPeriod + 1
    b5 = BarNumber
    b1 = Min(b0+boxLength,b5)
    b2 = Min(b1+boxLength,b5)
    b3 = Min(b2+boxLength,b5)
    b4 = Min(b3+boxLength,b5)
    L2 = Pbot+2*boxHeight
    L3 = Pbot+3*boxHeight

    'get DX values at b2 and b5
    DX1 = DX(FilC,2*boxLength,b5-b2)
    DX2 = DX(FilC,3*boxLength,0)

    'test that prices are below "yellow" boxes
    Yellow1 = IIF((countof(FilC > L3,b5-b2+1,0) = 0),1,0)
    Yellow2 = IIF((countof(FilC > L2,b5-b4+1,0) = 0),1,0)

    'conditions for semicup to be true
    If DX1>25 And DX2<25 And Yellow1=1 And Yellow2=1 Then
        isSEMICUP = 1
    End If
'if any of above conditions are false then not a semicup
Else isSEMICUP = 0
End If
End Function
'------------------------------------------------------------
Function SEMICUP_PERIOD(price as bararray,parameter)
Dim myTest As BarArray
Dim i,count
i = 0
myTest = 0
count = 0
Do While count < 1 And i < BarSize - 1
    i = i + 1
    myTest[i] = IIF(price[i] > price[0] * parameter,1,0)
    If myTest[i] = 1 Then
        count = count + 1
    End If
Loop
If count = 1 Then
     SEMICUP_PERIOD = i
Else SEMICUP_PERIOD = 0
End If
End Function
'------------------------------------------------------------
'COUNTOF Function
'returns how many times a rule is true in the lookback length
'coded by Richard Denning 01/04/08

Function COUNTOF(rule As BarArray,countLen,offset)
Dim count As Integer
Dim counter As Integer
    For counter = 0 + offset To countLen + offset - 1
        If rule[counter] = 1 Then
            count = count + 1
        End If
    Next
COUNTOF = count
End Function
'-------------------------------------------------------------
'System to test semicup formations:
Sub SEMI_CUP(parameter,exitBars,startDte)
Dim trdDte,stkRANK
'parameter = 2, exitBars = 10, startDte = 0960102
'use Tradestation format for startTradeDate
If sessionVar("tradeStartDate") > 0 Then
    trdDte = sessionVar("tradeStartDate")
Else
    trdDte = startDte
End If
If isSEMICUP(parameter,20) = 1 And Date>=MigrateDate(trdDte) Then
    Buy("LE",1,0,Market,Day)
End If
If BarsSinceEntry>=exitBars Then ExitLong("LX","",1,0,Market,Day)
End Sub","",1,0,Market,Day)
End Sub
'--------------------------------------------------------------

STRATASEARCH: IDENTIFYING CUP FORMATIONS EARLY
In “Identifying Cup Formations Early” in this issue, author Giorgos Siligardos offers a nice premise. If cup formations can be identified early, prices will be relatively low and stop-losses should be easy to set. There are, however, several hoops one must go through to create a working system with such an approach.
Although the semi-cup algorithm cannot be used for backtesting, we ran a rather primitive backtest by identifying semi-cup formations six months prior. Then, after importing current prices, we were able to evaluate how frequently the semi-cup formations led to a significant increase in prices in the following six months. In our tests, more than half of the stocks did have significant price increases after signaling a semi-cup formation. Identifying when to exit those positions was still an issue, since high volatility was often present, and many stocks did not recover significantly during that time. Nevertheless, the early signal proved to be quite effective for those stocks matching the pattern correctly.
StrataSearch users can download a plug-in from the Shared Area of the StrataSearch forum, allowing immediate access to the semi-cup scan and charts (samples shown in Figures 14 and 15). Users may also want to experiment with supportive trading rules that would provide early indications that the semi-cup is indeed turning into a full cup.
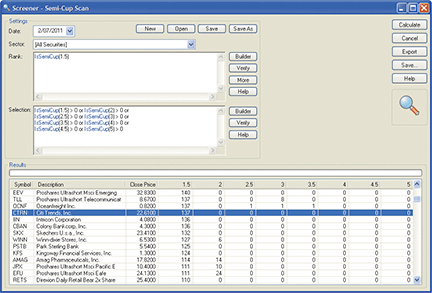
Figure 14: STRATASEARCH, Semi-Cup Scan Results. The IsSemiCup algorithm identified a large number of stocks and ETFs when run against the entire market on February 7, 2011. A chart of CTRN, highlighted above, can be see in Figure 15.
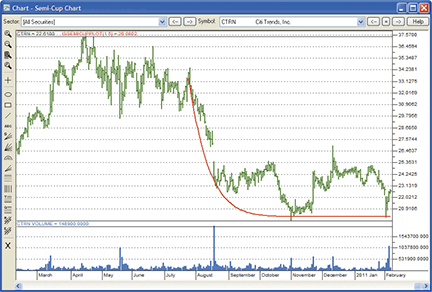
Figure 15: StrataSearch, Semi-Cup Chart. As identified by the curved red line, a cup formation may be in its early stages.
StrataSearch code:
//*********************************************************
// IsSemiCup
//*********************************************************
parm1 = parameter("parm1");

FilC=(Log(C));
eps=0.0000000001;

// basic Definitions
semicupperiod=LastValue(Higher(DaysSince(C>=LastValue(C*parm1)),1))+1;
Ptop=LastValue(High(FilC,Semicupperiod));
Pbot=LastValue(Low(FilC,Semicupperiod));
boxheight=LastValue(Abs(Ptop-Pbot)/5);
boxlength=LastValue(Higher(Int(semicupperiod/5),1));

// Grid Nodes
b0=LastValue(Accum(1)-semicupperiod+1);
b5=LastValue(Accum(1));
b1=LastValue(Lower(b0+boxlength,b5));
b2=LastValue(Lower(b1+boxlength,b5));
b3=LastValue(Lower(b2+boxlength,b5));
b4=LastValue(Lower(b3+boxlength,b5));
L2=Pbot+2*boxheight;
L3=Pbot+3*boxheight;

// DirectionalStrength
boxlen2x = 2 * boxlength;
DSX1=Abs(Sum(Higher(FilC-Ref(FilC,-1),0),boxlen2x)-
Sum(Higher(Ref(FilC,-1)-FilC,0),boxlen2x))/(eps+Sum(Higher(FilC-
Ref(FilC,-1),0),boxlen2x)+Sum(Higher(Ref(FilC,-1)-FilC,0),boxlen2x))*100;

boxlen3x = 3 * boxlength;
DSX2=Abs(Sum(Higher(FilC-Ref(FilC,-1),0),boxlen3x)-
Sum(Higher(Ref(FilC,-1)-FilC,0),boxlen3x))/(eps+Sum(Higher(FilC-
Ref(FilC,-1),0),boxlen3x)+Sum(Higher(Ref(FilC,-1)-FilC,0),boxlen3x))*100;

// Coditions
IsSemicupTemp = if(
/*1*/ (semicupperiod>=20)
AND
/*2*/ (Ref(DSX1,-(b5-b2))>25)
AND
/*3*/ (DSX2<25)
AND
/*4*/ (Accum(If(Accum(1)>=b2, if(FilC>L3, 1, 0),0)) = 0)
AND
/*5*/ (Accum(If(Accum(1)>=b4, if(FilC>L2, 1, 0),0)) = 0), 1, 0);

IsSemiCup = LastValue(IsSemiCupTemp * Semicupperiod);


//*********************************************************
// IsSemiCupPlot
//*********************************************************
parm1 = parameter("parm1");

FilC=(Log(C));
eps=0.0000000001;

// basic Definitions
semicupperiod=LastValue(Higher(DaysSince(C>=LastValue(C*parm1)),1))+1;
Ptop=LastValue(High(FilC,Semicupperiod));
Pbot=LastValue(Low(FilC,Semicupperiod));
boxheight=LastValue(Abs(Ptop-Pbot)/5);
boxlength=LastValue(Higher(Int(semicupperiod/5),1));

// Grid Nodes
b0=LastValue(Accum(1)-semicupperiod+1);
b5=LastValue(Accum(1));
b1=LastValue(Lower(b0+boxlength,b5));
b2=LastValue(Lower(b1+boxlength,b5));
b3=LastValue(Lower(b2+boxlength,b5));
b4=LastValue(Lower(b3+boxlength,b5));
L2=Pbot+2*boxheight;
L3=Pbot+3*boxheight;

// DirectionalStrength
boxlen2x = 2 * boxlength;
DSX1=Abs(Sum(Higher(FilC-Ref(FilC,-1),0),boxlen2x)-
Sum(Higher(Ref(FilC,-1)-FilC,0),boxlen2x))/(eps+Sum(Higher(FilC-
Ref(FilC,-1),0),boxlen2x)+Sum(Higher(Ref(FilC,-1)-FilC,0),boxlen2x))*100;

boxlen3x = 3 * boxlength;
DSX2=Abs(Sum(Higher(FilC-Ref(FilC,-1),0),boxlen3x)-
Sum(Higher(Ref(FilC,-1)-FilC,0),boxlen3x))/(eps+Sum(Higher(FilC-
Ref(FilC,-1),0),boxlen3x)+Sum(Higher(Ref(FilC,-1)-FilC,0),boxlen3x))*100;

// Coditions
IsSemicupTemp = if(
/*1*/ (semicupperiod>=20)
AND
/*2*/ (Ref(DSX1,-(b5-b2))>25)
AND
/*3*/ (DSX2<25)
AND
/*4*/ (Accum(If(Accum(1)>=b2, if(FilC>L3, 1, 0),0)) = 0)
AND
/*5*/ (Accum(If(Accum(1)>=b4, if(FilC>L2, 1, 0),0)) = 0), 1, 0);

// plot
IsSemiCupPlot = LastValue(IsSemiCupTemp)*(ValueWhen(LastValue(IsSemiCupTemp)*Accum(1)=b0,1)*
((Exp(Ptop)-Exp(Pbot))/ Power(abs(b0-LastValue(Accum(1))),10)*Power(abs(Accum(1)-
LastValue(Accum(1))),10)+0.98*Exp(Pbot)));

NINJATRADER: IDENTIFYING CUP FORMATIONS EARLY
The semi-cup indicators discussed in “Identifying Cup Formations Early” by Giorgos Siligardos in this issue have now been implemented as two indicators available for download at www.ninjatrader.com/SC/April2011SC.zip.
Once the two indicators have been downloaded, from within the NinjaTrader Control Center window, select the menu File → Utilities → Import NinjaScript and select the downloaded file. These indicators are for NinjaTrader version 7 or greater.
You can review the indicator source code by selecting the menu Tools → Edit NinjaScript → Strategy from within the NinjaTrader Control Center window and selecting “SemiCup” and “SemiCupInternal.”
A sample chart implementing the two indicators is shown in Figure 16.
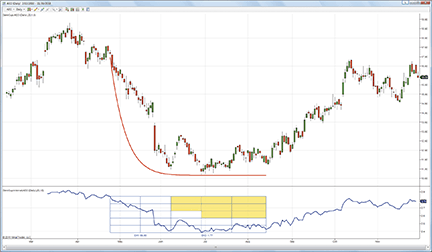
Figure 16: NINJATRADER, CUP FORMATION IDENTIFICATION INDICATORS. This screenshot shows the SemiCup and SemiCupInternal indicators applied to a daily chart of American Eagle Outfitters (AEO).

UPDATA: IDENTIFYING CUP FORMATIONS EARLY
In “Identifying Cup Formations Early” in this issue, author Giorgos Siligardos proposes a method for the mechanical recognition of possible cup formation patterns in time series data. His indicator seeks to preempt a rally from the low point by finding the left side and base in a precursor to a full cup pattern.
The Updata code for this indicator has now been added to the Updata Indicator Library and may be downloaded by clicking the Custom menu and then “Indicator Library.” Those who cannot access the library due to a firewall may paste following the code into the Updata Custom editor and save it.
A sample chart is shown in Figure 17.
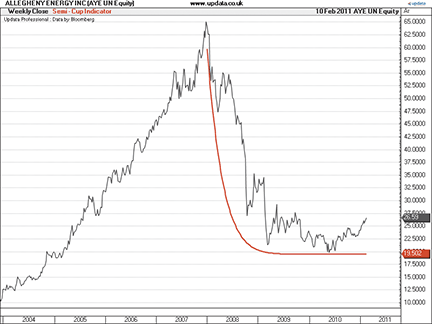
FIGURE 17: UPDATA, CUP FORMATION IDENTIFICATION INDICATOR. This chart shows the semi-cup formation detected in the S&P 500 stock Allegheny Energy Inc.
Updata code:
PARAMETER "Price Multiple" @Multiple=2
PARAMETER "LookBack Period" #PERIOD=600
NAME "Semi-Cup Indicator" ""
DISPLAYSTYLE LINE
INDICATORTYPE TOOL
PLOTSTYLE THICK2 RGB(255,0,0)

@FilC=0
@eps=0.0000000001
@Ptop=0
@Pbot=0
@boxheight=0
#boxlength=0
#b0=0
#b5=0
#b1=0
#b2=0
#b3=0
#b4=0
@L2=0
@L3=0
@DSX1=0
@DSX2=0
@LastClose=0
#SemiCupPeriod=0
#Count=0
#IsSemiCup=0
@CupPlot=0
@a=0
#i=0

'1st Loop Back : Find Semi-Cup Period
FOR #CURDATE=#LASTDATE TO #LASTDATE-#PERIOD Step-1

 If #CURDATE=#LASTDATE
 @LastClose=CLOSE
 EndIf

 If CLOSE>@Multiple*@LastClose AND #Count=0
 #SemiCupPeriod=#LASTDATE-#CURDATE
 #Count=1
 EndIf

NEXT

'2nd Loop : Find Semi-Cup Range
FOR #CURDATE=#SemiCupPeriod-1 TO #LASTDATE

 @FilC=LN(CLOSE)

 'Definitions at LastDate
 If #CURDATE=#LASTDATE

 @Ptop=PHIGH(@FilC,#SemiCupPeriod)
 @Pbot=PLOW(@FilC,#SemiCupPeriod)
 @boxheight=Abs(@Ptop-@Pbot)/5
 #boxlength=Max(Int(#SemiCupPeriod/5),1)

 'Grid Nodes
 #b0=#CURDATE-#SemiCupPeriod
 #b5=#CURDATE
 #b1=Min(#b0+#boxlength,#b5)
 #b2=Min(#b1+#boxlength,#b5)
 #b3=Min(#b2+#boxlength,#b5)
 #b4=Min(#b3+#boxlength,#b5)
 @L2=@Pbot+2*@boxheight
 @L3=@Pbot+3*@boxheight

 'Boolean Semi-Cup condition
 If #SemiCupPeriod >= 20 AND @FilC>@L3 AND
  @FilC>@L2 AND Hist(@DSX1,(#b5-#b2))>25 AND @DSX2<25
 #IsSemiCup=1
 EndIf

 EndIf

NEXT

'3rd Loop : Draw Semi-Cup
FOR #CURDATE=#LASTDATE-#SemiCupPeriod TO #LASTDATE

 'Directional Strength
 @DSX1=Abs(2*#boxlength*Sgnl(Max(@FilC-Hist(@FilC,1),0),2*#boxlength,M)
 -2*#boxlength*Sgnl(Max(Hist(@FilC,1)-@FilC,0),2*#boxlength,M))/
 (@eps+2*#boxlength*Sgnl(Max(@FilC-Hist(@FilC,1),0),2*#boxlength,M)
 +2*#boxlength*Sgnl(Max(Hist(@FilC,1)-@FilC,0),2*#boxlength,M))*100

 @DSX2=Abs(3*#boxlength*Sgnl(Max(@FilC-Hist(@FilC,1),0),3*#boxlength,M)
 -3*#boxlength*Sgnl(Max(Hist(@FilC,1)-@FilC,0),3*#boxlength,M))/
 (@eps+3*#boxlength*Sgnl(Max(@FilC-Hist(@FilC,1),0),3*#boxlength,M)
 +3*#boxlength*Sgnl(Max(Hist(@FilC,1)-@FilC,0),3*#boxlength,M))*100

 #i=#i+1
 @a=(Exp(@Ptop)-Exp(@Pbot))/ExpBase(#SemiCupPeriod,10)
 @CupPlot=0.98*Exp(@Pbot)+@a*(ExpBase(#SemiCupPeriod-#i,10))

 If #IsSemiCup
 @Plot=@CupPlot
 EndIf

NEXT
MICROSOFT EXCEL: IDENTIFYING CUP FORMATIONS EARLY
In “Identifying Cup Formations Early” in this issue, author Giorgos Siligardos includes a sidebar with an algorithm coded for MetaStock that implements his technique for identifying cup formations before they have fully formed.
The “Basic code” section of that MetaStock example allows for a straightforward translation into a Microsoft Excel worksheet. Thus, I was able to take the time to also provide a couple of usability features.
Without an Excel-accessible price history database to scan, this Traders’ Tip is a static solution. The user must capture historical price data for a given stock or other tradable of interest from sources like Yahoo! Finance, then massage the data as appropriate for the “adjusted closes,” and place the result into the workbook.
In my previous Traders’ Tips for Excel, adding or changing data was a problem because the solution formulas were coded on the same sheet and in the same rows as the input data. Thus, the solution formulas were inextricably tied to the location of input data cells and to each other, and inserting a new data row unavoidably screwed up these relationships without necessarily producing any outward sign that something was broken.
In this month’s worksheet that I created, you may safely alter the input data because the calculations have been isolated from the input data using an input data sheet and a separate calculations sheet. You may freely add data rows to the InputPriceData worksheet at the top, bottom, or middle of the data detail section. Or you may completely replace the data detail rows. Just observe the following caveats: 1) Make a backup copy first. 2) Be sure you don’t disturb the location of the headings in row 10 of the input sheet or the computations in input sheet cells B7:C7. That is to say, do not insert or delete rows of the input sheet between rows 1 and 10, inclusive. 3) Do update the symbol and company name in input sheet cell B2 if you change securities (see the Notes tab for additional details).
The SemiCupCalcAndChart worksheet obtains its data from the input worksheet using Offset references relative to the headings in row 10 of the input sheet. For example, any cell on the calculations sheet that uses an Offset reference to the input sheet of cell “B10+1 row” will always retrieve the current contents of cell B11 (even if you just inserted three rows above what was the previous row 11). Likewise, any formula using Offset reference cell “B10+4 rows” will now retrieve the data that was in B11 before the rows were inserted. The data moved, but the Offset formula references did not.
This leads me to the second feature I was able to add. By using separate input and calculations worksheets, combined with the Offset technique, I was able to add a very simple “data windowing” capability on the calculations and chart worksheet. For additional details, see the Notes tab for the sections, “Calculation and chart worksheet usage” and “Play with it.”
Click on “IdentifyingCupFormationsEarly.xls” to begin your download.
A sample chart output is shown in Figure 18.
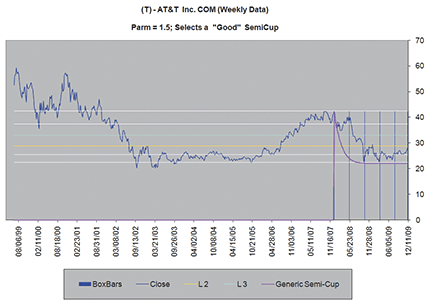
Figure 18: EXCEL, CUP FORMATION. This chart shows an example of a “good” semi-cup as identified by the Excel program.

VT TRADER: COMBINING RSI WITH RSI
Our Traders’ Tip this month is based on Peter Konner’s article in the January 2011 issue of S&C, “Combining Rsi with Rsi.”
In the article, Konner describes a trading system using fast/slow Rsi indicators and fast/slow moving averages for identifying potential longer-term trading opportunities with the prevailing trend as well as potential shorter-term trading opportunities against the prevailing trend. Konner only discusses countertrend trading against prevailing downtrends; however, we have added an additional set of “quick buy/sell” rules for countertrend trading against prevailing uptrends as well. A sample chart is shown in Figure 19.
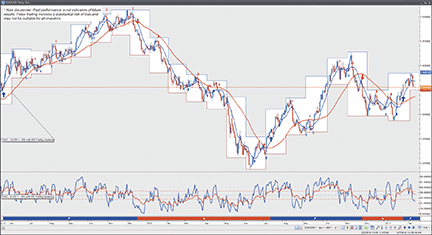
Figure 19: VT TRADER, RSI WITH RSI SYSTEM. Here is a trading system on a daily candle chart of the EUR/USD based on Peter Konner’s RSI with RSI system described in his January 2011 article in S&C.
We’ll be offering our modified version of Konner’s Rsi with Rsi trading system for download in our VT client forums at https://forum.vtsystems.com along with hundreds of other precoded and free trading systems. The specific trading rules used by the trading system are explained in its Notes section. The VT Trader instructions for creating the trading system are shown here.
To learn more about VT Trader, visit www.vtsystems.com.
- Ribbon→Technical Analysis menu→Trading Systems group→Trading Systems Builder command→[New] button
- In the General tab, type the following text for each field:
Name: TASC - 01/2011 - RSI with RSI Trading System
Function Name Alias: tasc_RsiWithRsiSytem
Label Mask: TASC - 01/2011 - RSI with RSI Trading System
- In the Input Variable(s) tab, create the following variables:
[New] button...
Name: FastMaPeriods
Display Name: Fast MA Periods
Type: integer
Default: 10

[New] button...
Name: SlowMaPeriods
Display Name: Slow MA Periods
Type: integer
Default: 40

[New] button...
Name: FastRsiPeriods
Display Name: Fast RSI Periods
Type: integer
Default: 5

[New] button...
Name: SlowRsiPeriods
Display Name: Slow RSI Periods
Type: integer
Default: 17
- In the Output Variable(s) tab, create the following variables:
[New] button...
Var Name: FastMA
Name: Fast MA
* Checkmark: Indicator Output
Select Indicator Output Tab
Line Color: blue
Line Width: 2
Ling Style: solid
Placement: Price Frame
[OK] button...

[New] button...
Var Name: SlowMA
Name: Slow MA
* Checkmark: Indicator Output
Select Indicator Output Tab
Line Color: red
Line Width: 2
Ling Style: solid
Placement: Price Frame
[OK] button...

[New] button...
Var Name: FastRSIndex
Name: Fast RSI
* Checkmark: Indicator Output
Select Indicator Output Tab
Line Color: blue
Line Width: 2
Ling Style: solid
Placement: Additional Frame 1
[OK] button...

[New] button...
Var Name: SlowRSIndex
Name: Slow RSI
* Checkmark: Indicator Output
Select Indicator Output Tab
Line Color: red
Line Width: 2
Ling Style: solid
Placement: Additional Frame 1
[OK] button...

[New] button...
Var Name: RSIMidLvl
Name: RSI Mid-Level
* Checkmark: Indicator Output
Select Indicator Output Tab
Line Color: gray
Line Width: 1
Ling Style: dashed
Placement: Additional Frame 1
[OK] button...

[New] button...
Var Name: RSIUpTrendLvl
Name: RSI UpTrend Level
* Checkmark: Indicator Output
Select Indicator Output Tab
Line Color: red
Line Width: 1
Ling Style: dashed
Placement: Additional Frame 1
[OK] button...

[New] button...
Var Name: RSIDownTrendLvl
Name: RSI DownTrend Level
* Checkmark: Indicator Output
Select Indicator Output Tab
Line Color: red
Line Width: 1
Ling Style: dashed
Placement: Additional Frame 1
[OK] button...

[New] button...
Var Name: slowBuy
Name: Slow Buy Signal
* Checkmark: Graphic Enabled
* Checkmark: Alerts Enabled
Select Graphic Tab
Font [...]: Up Arrow
Size: Medium
Color: Blue
Symbol Position: Below price plot
	Select Alerts Tab
		Alert Message: Slow Buy Signal
		Alert Sound: ringin.wav
[OK] button...

[New] button...
Var Name: slowSell
Name: Slow Sell Signal
* Checkmark: Graphic Enabled
* Checkmark: Alerts Enabled
Select Graphic Tab
Font [...]: Down Arrow
Size: Medium
Color: Red
Symbol Position: Above price plot
	Select Alerts Tab
		Alert Message: Slow Sell Signal
		Alert Sound: ringin.wav
[OK] button...


[New] button...
Var Name: InDownTrend
Name: In DownTrend
* Checkmark: Trends Enabled
Select Trends Tab
	Display Vertical Lines: Disabled
Background: Red
Pattern: Solid
Symbol: Angled Down Arrow
Symbol Color: White
	[OK] button...

[New] button...
Var Name: InUpTrend
Name: In UpTrend
* Checkmark: Trends Enabled
Select Trends Tab
	Display Vertical Lines: Disabled
Background: Blue
Pattern: Solid
Symbol: Angled Up Arrow
Symbol Color: White
	[OK] button...

[New] button...
Var Name: DownTrendQuickBuy
Name: DownTrend Quick Buy Signal
* Checkmark: Graphic Enabled
* Checkmark: Alerts Enabled
Select Graphic Tab
Font [...]: Up Arrow
Size: Small
Color: Blue
Symbol Position: Below price plot
	Select Alerts Tab
		Alert Message: DownTrend Quick Buy Signal
		Alert Sound: ringin.wav
[OK] button...

[New] button...
Var Name: DownTrendQuickSell
Name: DownTrend Quick Sell Signal
* Checkmark: Graphic Enabled
* Checkmark: Alerts Enabled
Select Graphic Tab
Font [...]: Down Arrow
Size: Small
Color: Red
Symbol Position: Above price plot
	Select Alerts Tab
		Alert Message: DownTrend Quick Sell Signal
		Alert Sound: ringin.wav
[OK] button...

[New] button...
Var Name: UpTrendQuickBuy
Name: UpTrend Quick Buy Signal
* Checkmark: Graphic Enabled
* Checkmark: Alerts Enabled
Select Graphic Tab
Font [...]: Up Arrow
Size: Small
Color: Light Blue
Symbol Position: Below price plot
	Select Alerts Tab
		Alert Message: UpTrend Quick Buy Signal
		Alert Sound: ringin.wav
[OK] button...

[New] button...
Var Name: UpTrendQuickSell
Name: UpTrend Quick Sell Signal
* Checkmark: Graphic Enabled
* Checkmark: Alerts Enabled
Select Graphic Tab
Font [...]: Down Arrow
Size: Small
Color: Light Red
Symbol Position: Above price plot
	Select Alerts Tab
		Alert Message: UpTrend Quick Sell Signal
		Alert Sound: ringin.wav
[OK] button...

[New] button...
Var Name: OpenBuy
Name: Open Buy
* Checkmark: Trading Enabled
Select Trading Tab
Trading Action: BUY
[OK] button...

[New] button...
Var Name: CloseBuy
Name: Close Buy
* Checkmark: Trading Enabled
Select Trading Tab
Trading Action: SELL
[OK] button...

[New] button...
Var Name: OpenSell
Name: Open Sell
* Checkmark: Trading Enabled
Select Trading Tab
Trading Action: SELL
[OK] button...

[New] button...
Var Name: CloseSell
Name: Close Sell
* Checkmark: Trading Enabled
Select Trading Tab
Trading Action: BUY
[OK] button...
- In the Formula tab, copy and paste the following formula:
{Provided By: Capital Market Services, LLC & Visual Trading Systems, LLC} {Copyright: 2011} {Description: TASC, January 2011 - "Combining RSI with RSI" by Peter Konner} {File: tasc_RsiWithRsiSytem.vttrs - Version 1.0} {Fast/Slow Moving Averages} FastMA:= mov(C,FastMaPeriods,S); SlowMA:= mov(C,SlowMaPeriods,S); {Fast/Slow RSIs} FastRSIndex:= RSI(FastRsiPeriods); SlowRSIndex:= RSI(SlowRsiPeriods); RSIMidLvl:= 50; RSIUpTrendLvl:= 60; RSIDownTrendLvl:= 40; {Buy/Sell Conditions} slowBuyConditions:= Cross(SlowRSIndex,RSIUpTrendLvl) AND C>SlowMA; slowSellConditions:= Cross(RSIDownTrendLvl,SlowRSIndex) AND C<SlowMA; slowBuy:= SignalRemove(slowBuyConditions,slowSellConditions); slowSell:= SignalRemove(slowSellConditions,slowBuyConditions); {Define Trend using Buy/Sell Conditions} InDownTrend:= SignalFlag(slowSell,slowBuy); InUpTrend:= SignalFlag(slowBuy,slowSell); {DownTrend Quick Buy/Sell Conditions} DownTrendQuickBuyConditions:= InDownTrend=1 AND Cross(FastRSIndex,RSIUpTrendLvl) AND C>FastMA; DownTrendQuickSellConditions:= InDownTrend=1 AND Cross(RSIDownTrendLvl,FastRSIndex) AND C<FastMA; DownTrendQuickBuy:= SignalRemove(DownTrendQuickBuyConditions,DownTrendQuickSellConditions); DownTrendQuickSell:= BarsSince(DownTrendQuickBuy=1)<BarsSince(slowSell=1) AND SignalRemove (DownTrendQuickSellConditions,DownTrendQuickBuyConditions); {UpTrend Quick Buy/Sell Conditions} UpTrendQuickBuyConditions:= InUpTrend=1 AND Cross(FastRSIndex,RSIUpTrendLvl) AND C>FastMA; UpTrendQuickSellConditions:= InUpTrend=1 AND Cross(RSIDownTrendLvl,FastRSIndex) AND C<FastMA; UpTrendQuickBuy:= BarsSince(UpTrendQuickSell=1)<BarsSince(slowBuy=1) AND SignalRemove(UpTrendquickBuyConditions ,UpTrendquickSellConditions); UpTrendQuickSell:= SignalRemove(UpTrendQuickSellConditions,UpTrendQuickBuyConditions); {Create Auto-Trading Functionality; Only used in Auto-Trade Mode} OpenBuy:= (slowBuy=1 OR DownTrendQuickBuy=1 OR UpTrendQuickBuy=1) AND BuyPositionCount()=0; CloseBuy:= (slowSell=1 OR DownTrendQuickSell=1 OR UpTrendQuickSell=1) AND BuyPositionCount()>0; OpenSell:= (slowSell=1 OR DownTrendQuickSell=1 OR UpTrendQuickSell=1) AND SellPositionCount()=0; CloseSell:= (slowBuy=1 OR DownTrendQuickBuy=1 OR UpTrendQuickBuy=1) AND SellPositionCount()>0; - Click the “Save” icon to finish building the trading system.
To attach the trading system to a chart, select the “Add Trading System” option from the chart’s contextual menu, select “TASC - 01/2011 - RSI with RSI Trading System ” from the trading systems list, and click the [Add] button.
IDENTIFYING CUP FORMATIONS EARLY — SILIGARDOS
ARTICLE CODE
SEMI-CUP ALGORITHM FOR METASTOCK
Open the MetaStock Indicator Builder and create two new indicators named “S&C - IsSemiCup” and “S&C - IsSemiCup-plot.” The formulas for these indicators are given here. To apply the “S&C - IsSemiCup” indicator in a chart, you must first insert the parameter. The S&C - IsSemiCup then returns a constant number. If this number is zero, then no semi-cup formation is identified. If the number is greater than zero, then a semi-cup formation is identified and this number shows the duration (in trading bars) of the formation. Once the formation is identified, you can then apply the S&C - IsSemiCup-plot indicator with the same parameter to visualize it. The results of these indicators always refer to the last semi-cup formation of the chart. These indicators cannot be used for backtesting the algorithm or show historical formations.
--------------------------------------------
BASIC CODE
--------------------------------------------
FilC:=(Log(C));
eps:=0.0000000001;

{Basic Definitions}
semicupperiod:=LastValue(Max(BarsSince(C>=LastValue(C*parameter)),1))+1;
Ptop:=LastValue(HHV(FilC,Semicupperiod));
Pbot:=LastValue(LLV(FilC,Semicupperiod));
boxheight:=LastValue(Abs(Ptop-Pbot)/5);
boxlength:=LastValue(Max(Int(semicupperiod/5),1));

{Grid Nodes}
b0:=LastValue(Cum(1)-semicupperiod+1);
b5:=LastValue(Cum(1));
b1:=LastValue(Min(b0+boxlength,b5));
b2:=LastValue(Min(b1+boxlength,b5));
b3:=LastValue(Min(b2+boxlength,b5));
b4:=LastValue(Min(b3+boxlength,b5));
L2:=Pbot+2*boxheight;
L3:=Pbot+3*boxheight;

{Directional Strength}
DSX1:=Abs(Sum(Max(FilC-Ref(FilC,-1),0),2*boxlength)-Sum(Max(Ref(FilC,-1)-FilC,0),
2*boxlength))/(eps+Sum(Max(FilC-Ref(FilC,-1),0),2*boxlength)+Sum(Max(Ref(FilC,-1)
    -FilC,0),2*boxlength))*100;
DSX2:=Abs(Sum(Max(FilC-Ref(FilC,-1),0),3*boxlength)-Sum(Max(Ref(FilC,-1)-FilC,0),
3*boxlength))/(eps+Sum(Max(FilC-Ref(FilC,-1),0),3*boxlength)+Sum(Max(Ref(FilC,-1)
    -FilC,0),3*boxlength))*100;

{Conditions}
isSemicup:=
{1}(semicupperiod>=20)
   AND
{2} (Ref(DSX1,-(b5-b2))>25)
   AND
{3} (DSX2<25)
   AND
{4}(Cum(If(Cum(1)>=b2, FilC>L3,0))= 0)
   AND
{5}(Cum(If(Cum(1)>=b4, FilC>L2,0))= 0) ;

--------------------------------------------
S&C - IsSemiCup
--------------------------------------------
{Giorgos E. Siligardos, 2009}
{Basic Semi-Cup Identification Algorithm}

{parameter}
parameter:=Input("parameter", 1, 100,2);
<insert BASIC CODE here>
LastValue(isSemicup*semicupperiod);

--------------------------------------------
S&C - IsSemiCup-plot
--------------------------------------------
{Giorgos E. Siligardos, 2009}
{semi-cup curve}

{parameter}
parameter:=Input("parameter", 1, 100,2);
<insert BASIC CODE here>
{plot}
LastValue(issemicup)*(ValueWhen(1,LastValue(isSemicup)*Cum(1)=b0,1)*((Exp(Ptop)
-Exp(Pbot))/Power(b0-LastValue(Cum(1)),10)*Power(Cum(1)-LastValue(Cum(1)),10)
    +0.98*Exp(Pbot)));
METASTOCK EXPLORATION FOR SEMI-CUP FORMATION
Open The Explorer and create a new exploration named “S&C - SemiCup Exploration” using the formulas shown here. The exploration reports all securities who have at least one semi-cup formation under way for parameters from 1.5 to 5 with a 0.5 step. Be sure that many price data are taken into account for each exploration (to be sure, go to Exploration Options and instruct MetaStock to always load 30,000 records).
Name: S&C - SemiCup Exploration

Notes:  {Giorgos E. Siligardos , 2009}
                {Basic Semi-Cup Exploration}

Filter:    ((colA>0) OR (colB>0) OR (colC>0) OR (colD>0) OR
	          (colE>0) OR (colF>0) OR (colG>0) OR (colH>0)) AND (Lowest(L)>0)

A:
	Col. Name:  1.5
      Formula:
{parameter}
 parameter:=1.5;
 		<insert BASIC CODE here>
B:
	Col. Name:  2.0
      Formula:
{parameter}
 parameter:=2.0;
 		<insert BASIC CODE here>
		LastValue(isSemicup*semicupperiod);

C:
	Col. Name:  2.5
      Formula:
{parameter}
 parameter:=2.5;
 		<insert BASIC CODE here>
		LastValue(isSemicup*semicupperiod);

D:
	Col. Name:  3.0
      Formula:
{parameter}
 parameter:=3.0;
 		<insert BASIC CODE here>
		LastValue(isSemicup*semicupperiod);

E:
	Col. Name:  3.5
      Formula:
{parameter}
 parameter:=3.5;
 		<insert BASIC CODE here>
		LastValue(isSemicup*semicupperiod);

F:
	Col. Name:  4.0
      Formula:
{parameter}
 parameter:=4.0;
 		<insert BASIC CODE here>
		LastValue(isSemicup*semicupperiod);

G:
	Col. Name:  4.5.0
      Formula:
{parameter}
 parameter:=4.5;
 		<insert BASIC CODE here>
		LastValue(isSemicup*semicupperiod);

H:
	Col. Name:  5.0
      Formula:
{parameter}
 parameter:=5.0;
 		<insert BASIC CODE here>
		LastValue(isSemicup*semicupperiod);