INDICATORs
The Closing Price Is All
Entering The Price Zone 
In this second part of the series, we introduce the price zone oscillator (Pzo), a complementary indicator to the volume zone oscillator (Vzo).
In our last article, we introduced a new oscillator that provides better guidance to buying and selling levels for securities: the volume zone oscillator (Vzo). This time, we introduce a similar, complementary indicator: the price zone oscillator (Pzo). See sidebar, “Price Zone Oscillator,” on page 29.
The formula for Pzo depends on only one condition: If today’s closing price is higher than yesterday’s closing price, then the closing price will have a positive value (bullish); otherwise it will have a negative value (bearish).
Price zone oscillator = 100 x (CP/TC)
where:
CP (Closing position) = X-days Ema (± close)
and
TC (Total close) = X-days Ema (close)
The price zone oscillator
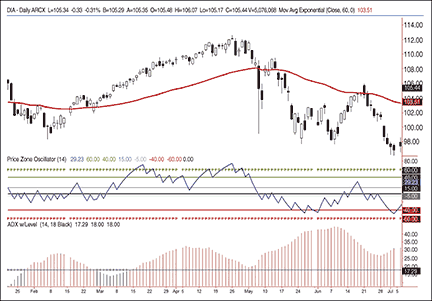
Like Vzo, Pzo has overbought and oversold levels. It is useful for identifying at which zone (bullish or bearish) price is positioned. Pzo is useful in uptrends, downtrends, or sideways market conditions. Please review the daily chart in Figure 1 of Dia, the Dow Jones Industrial Average Spdr, with Pzo.

Figure 1: price zone oscillator. The components of the PZO are a 60-day exponential moving average (EMA), 14-period ADX, and seven oscillator zones at +60, +40, 0. -5, -40 and -60.
Just like with Vzo, the price crossing the 60-day exponential moving average (Ema) is the determinant between bullish (above the Ema) and bearish (below the Ema) conditions. When the 14-day average directional movement index (Adx) is below 18, the action is considered to be sideways regardless of whether price is above or below the Ema.