TRADERS’ TIPS
June 2011
Here is this month’s selection of Traders’ Tips, contributed by various developers of technical analysis software to help readers more easily implement some of the strategies presented in this and other issues.
Other code appearing in articles in this issue is posted in the Subscriber Area of our website at https://technical.traders.com/sub/sublogin.asp. Login requires your last name and subscription number (from mailing label). Once logged in, scroll down to beneath the “Optimized trading systems” area until you see “Code from articles.” From there, code can be copied and pasted into the appropriate technical analysis program so that no retyping of code is required for subscribers.
You can copy these formulas and programs for easy use in your spreadsheet or analysis software. Simply “select” the desired text by highlighting as you would in any word processing program, then use your standard key command for copy or choose “copy” from the browser menu. The copied text can then be “pasted” into any open spreadsheet or other software by selecting an insertion point and executing a paste command. By toggling back and forth between an application window and the open web page, data can be transferred with ease.
This month’s tips include formulas and programs for:
- TRADESTATION: PRICE ZONE OSCILLATOR
- BLOOMBERG: PRICE ZONE OSCILLATOR
- METASTOCK: PRICE ZONE OSCILLATOR
- eSIGNAL: PRICE ZONE OSCILLATOR
- WEALTH-LAB: PRICE ZONE OSCILLATOR
- AMIBROKER: PRICE ZONE OSCILLATOR
- WORDEN BROTHERS TC2000: PRICE ZONE OSCILLATOR
- NEUROSHELL TRADER: PRICE ZONE OSCILLATOR
- AIQ: PRICE ZONE OSCILLATOR
- TRADERSSTUDIO: PRICE ZONE OSCILLATOR
- STRATASEARCH: PRICE ZONE OSCILLATOR
- TRADECISION: PRICE ZONE OSCILLATOR
- NINJATRADER: PRICE ZONE OSCILLATOR
- TRADE NAVIGATOR: PRICE ZONE OSCILLATOR
- UPDATA: PRICE ZONE OSCILLATOR
- SHARESCOPE: PRICE ZONE OSCILLATOR
- TRADESIGNAL: PRICE ZONE OSCILLATOR
- VT TRADER: PRICE ZONE OSCILLATOR
- MICROSOFT EXCEL: PRICE ZONE OSCILLATOR
- PRICE ZONE OSCILLATOR — KHALIL & STECKLER ARTICLE CODE
- THINKORSWIM.COM: PRICE ZONE OSCILLATOR

TRADESTATION: PRICE ZONE OSCILLATOR
In “Entering The Price Zone” in this issue, authors Walid Khalil and David Steckler present the price zone oscillator (Pzo). The authors intend for this indicator to complement the indicator they introduced last month, the volume zone oscillator (Vzo).
Shown below is some EasyLanguage code for a function (“Pzo”), an indicator (“Pzo oscillator”), and a strategy (“Pzo strategy”). The code for the strategy is based on the code for an EasyLanguage strategy already provided in the article by the authors.
To download the EasyLanguage code, go to the TradeStation Platform and EasyLanguage Support forum (https://www.tradestation.com/Discussions/forum.aspx?Forum_ID=213) and search for the file “Pzo.Eld.”
A sample chart is shown in Figure 1.
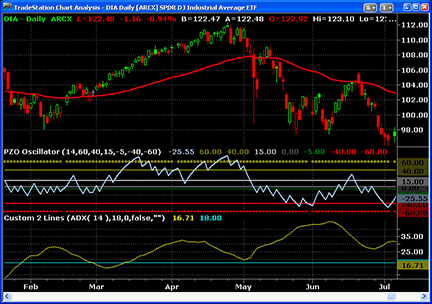
Figure 1: TRADESTATION, PRICE ZONE OSCILLATOR. Here is a TradeStation daily chart of the DIA with the PZO oscillator, 60-bar EMA, and Custom 2 Lines indicators applied. The Custom 2 Lines indicator is being used here to plot ADX(14) and a horizontal line at 18.
PZO (Function)

{ TASC Article, June, 2011, "Entering the Price Zone"
  Price Zone Oscillator Function }

inputs:
	int Period( numericsimple ) ;

variables:
	double R( 0 ),
	double CP( 0 ),
	double TC( 0 ) ;

R = Sign( Close - Close[1] ) * Close ;
CP = XAverage( R, Period ) ;
TC = XAverage( Close, Period ) ;

if TC <> 0 then
	PZO = 100 * CP / TC ;


PZO Oscillator (Indicator)

{ TASC Article, June, 2011, "Entering the Price Zone" }
{ Price Zone Oscillator Indicator }

inputs:
	int PZOPeriod( 14 ), { PZO calculation length, in
	 bars }
	double ExtremeOverbot( 60 ),
	double Overbought( 40 ),
	double MidPlus( 15 ),
	double MidMinus( -5 ),
	double Oversold( -40 ),
	double ExtremeOversold( -60 ) ;

variables:
	double PZOValue( 0 ) ;

PZOValue = PZO( PZOPeriod ) ;

Plot1( PZOValue, "PZO" ) ;
Plot2( ExtremeOverbot, "ExOBot" ) ;
Plot3( Overbought, "OBot" ) ;
Plot4( MidPlus, "MidPlus" ) ;
Plot5( 0, "Zero" ) ;
Plot6( MidMinus, "MidMinus" ) ;
Plot7( Oversold, "OSold" ) ;
Plot8( ExtremeOversold, "ExOSold" ) ;

if PZOValue crosses over Overbought then
	Alert( "PZO overbought!" ) ;

if PZOValue crosses under Oversold then
	Alert( "PZO oversold!" ) ;


PZO Strategy (Strategy)

{
Based on code provided in TASC Article, "Entering The Price Zone," June, 2011, by Walid Khalil and David Steckler.
}

[IntrabarOrderGeneration = false]

inputs:
	int PZOPeriod( 14 ), { Price Zone Oscillator
	 length }
	int ADXLength( 14 ), { ADX length, in bars }
	double EMAPrice( Close ), { exponential moving
	 average price }
	int EMALength( 60 ), { exponential moving average
	 length }
	bool UsePZO( true ), { set to true to use PZO value
	 as Max and Min, set false otherwise }
	double ADXTrendAmt( 18 ), { ADX value for trend }
	double ExtremeOverbot( 60 ), { PZO extremely
	 overbought level }
	double Overbought( 40 ), { PZO overbought level }
	double MidPlus( 15 ), { positive PZO trigger level,
	 less than overbought }
	double MidMinus( -5 ), { negative PZO trigger
	 level, above oversold }
	double Oversold( -40 ), { PZO oversold level }
	double ExtremeOversold( -60 ) ; { PZO extremely
	 oversold level }

variables:
	int MP( 0 ),
	double PZOValue( 0 ),
	double ADXValue( 0 ),
	double EMAValue( 0 ),
	double VZOValue( 0 ),
	double Max( 0 ),
	double Min( 0 ),
	bool B2_SU( false ),
	bool S2_SU( false ) ;

MP = MarketPosition ;
PZOValue = PZO( PZOPeriod ) ;
ADXValue = ADX( ADXLength ) ;
EMAValue = XAverage( EMAPrice, EMALength ) ;

if UsePZO then
	begin
	Max = PZOValue ;
	Min = PZOValue ;
	end ;

if ADXValue > ADXTrendAmt then
	begin

	if MP <= 0 and EMAPrice > EMAValue then
		begin
		if Max crosses over Oversold then
			Buy ( "CrossOS" ) next bar market ;
		if Min crosses over 0 then
			B2_SU = true ;
		if B2_SU and Max crosses over MidPlus then
			Buy ( "CrossMid+" ) next bar market ;
		end ;

	if MP > 0 then
		begin
		if Max[1] > ExtremeOverbot and Max < Max[1]
		 then
			Sell ( "OscDecr" ) next bar at market ;
		if EMAPrice < EMAValue and Min < 0 then
			Sell ( "EMASell" ) next bar at market ;
		end ;

	if MP >= 0 and EMAPrice < EMAValue then
		begin
		if Min crosses under Overbought then
			Sell short ( "CrossOB" ) next bar at
			 market ;
		if Max crosses under 0 then
			S2_SU = true ;
		if S2_SU and Min crosses under MidMinus then
			SellShort( "CrossMid-" ) next bar at
			 market ;
		end ;

	if MP < 0 then
		begin
		if Min[1] < ExtremeOversold and Min > Min[1]
		 then
			Buy to cover ( "OscIncr" ) next bar
			 market ;
		if EMAPrice > EMAValue and Max > 0 then
			Buy to cover ( "EMACover" ) next bar
			 market ;
		end ;
	end
else { ADX value < ADXTrendAmt cases }
	begin

	if MP <= 0 then
		begin
		if Max crosses over Oversold then
			Buy( "CrossOS2" ) next bar market ;
		if Max crosses over MidPlus then
			Buy ( "CrossMid+2" ) next bar market ;
		end ;

	if MP > 0 then
		begin
		if Max > Overbought then
			begin
			if Max[1] > ExtremeOverbot and Max <
			 Max[1] then
				Sell ( "OscDecr2" ) next bar at
				 market ;
			if EMAPrice < EMAValue and Min < 0 then
				Sell ( "EMASell2" ) next bar at
				 market ;
			end
		else if Min < MidMinus then
			Sell ( "OscUndMid-" ) next bar at market ;
		end ;

	if MP >= 0 then
		begin
		if Min crosses under Overbought then
			Sell short ( "CrossOB2" ) next bar at
			 market ;
		if Min crosses under MidMinus then
			Sell short ( "CrossMid-2" ) next bar at
			 market ;
		end ;

	if MP < 0 then
		begin
		if Min < Oversold then
			begin
			if Min[1] < ExtremeOversold and Min >
			 Min[1] then
				Buy to cover ( "OscIncr2" ) next bar
				 market ;
			if EMAPrice > EMAValue and Max > 0 then
				Buy to cover ( "EMACover2" ) next bar
				 market ;
			end
		else if Max > MidPlus then
			Buy to cover ( "OscOverMid+" ) next bar
			 market ;
		end ;
	end ;

if Min crosses under MidPlus then
	B2_SU = false ;

if Max crosses over MidMinus then
	S2_SU = false ;
This article is for informational purposes. No type of trading or investment recommendation, advice, or strategy is being made, given, or in any manner provided by TradeStation Securities or its affiliates.

BLOOMBERG: PRICE ZONE OSCILLATOR
The chart in Figure 2 shows the price zone oscillator (Pzo), which is described in “Entering The Price Zone” in this issue by Walid Khalil and David Steckler as a followup to their article last month, “In The Volume Zone,” which presented their volume zone oscillator (Vzo).
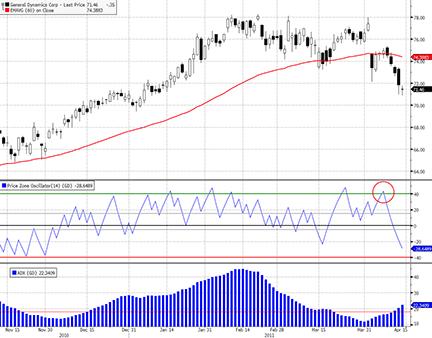
Figure 2: BLOOMBERG, PRICE ZONE OSCILLATOR. This chart shows General Dynamics (GD) from November 2010, when an uptrend began, through mid-April 2011, when the stock appears to have rolled over and may be beginning a new trend lower.
Last month in Traders’ Tips, we presented a sample chart of the Vzo with a bullish signal. This month, we show the Pzo in what looks like a bearish setup (Figure 2).
In their article, the authors lay out the “downtrend system rules” that, when applied to General Dynamics (GD), show a setup for a possible continuation of lower prices in the stock. On April 8, the Pzo crossed from above 40 to below 40 (red circle). The price of GD moved below the 60-day Ema, and the Pzo proceeded to break below zero and continued under -20, which would, according to the authors, help reduce possible whipsaws in the market on the short side. Time will tell whether this particular signal results in a profitable trade, and that result should be revealed by the time you read this.
Using the CS.Net framework within the Stdy<GO> function on the Bloomberg Terminal, C# or Visual Basic code can be written to display the price zone oscillator. The C# code for this indicator is shown below.
All Bloomberg code appearing in Traders’ Tips can also be found in the sample files provided with regular Sdk updates. The studies will also be included in the Bloomberg global study list.
using System;
using System.Collections.Generic;
using System.Text;
using System.Drawing;
using Bloomberg.Study.API;
using Bloomberg.Study.CoreAPI;
using Bloomberg.Study.Util;
using Bloomberg.Study.TA;
using Bloomberg.Math;

namespace Price_Zone_Oscillator
{

    public partial class PriceZoneOscillator
    {
        //Create the user defineable input 'Period' to use in the EMA's
        public StudyIntegerProperty Period = new StudyIntegerProperty(14);

        private void Initialize()
        {
            //Create a Study Panel beneath the price chart panel
            Panels.Add("PZOPanel", new StudyPanel());

            //Create the Price Zone Oscillator Line
            Output.Add("PZO", new TimeSeries());
            StudyLine PZOLine = new StudyLine("PZO", Color.Blue);
            Panels["PZOPanel"].Visuals.Add("PZO", PZOLine);
            PZOLine.DisplayName = "Price Zone Oscillator";
            //Display user defined period on PZO legend
            PZOLine.SetDisplayNameSuffix(Period);

            //Add horizontal to show the oscillator levels referenced within the Trader's Tips column
            Output.Add("Level1", new TimeSeries());
            StudyHorizontalLine Level1 = new StudyHorizontalLine(60, Color.Green, VisualLineStyle.Solid);
            Level1.Style = VisualLineStyle.Dot;
            Level1.Width = 4;
            Panels["PZOPanel"].Visuals.Add("Level1", Level1);

            Output.Add("Level2", new TimeSeries());
            StudyHorizontalLine Level2 = new StudyHorizontalLine(40, Color.Green, VisualLineStyle.Solid);
            Level2.Width = 2;
            Panels["PZOPanel"].Visuals.Add("Level2", Level2);

            Output.Add("Level3", new TimeSeries());
            StudyHorizontalLine Level3 = new StudyHorizontalLine(15, Color.DarkGray, VisualLineStyle.Solid);
            Level3.Width = 2;
            Panels["PZOPanel"].Visuals.Add("Level3", Level3);

            Output.Add("ZeroLine", new TimeSeries());
            StudyHorizontalLine zeroline = new StudyHorizontalLine(0, Color.Black, VisualLineStyle.Solid);
            zeroline.Width = 2;
            Panels["PZOPanel"].Visuals.Add("ZeroLine", zeroline);

            Output.Add("Level4", new TimeSeries());
            StudyHorizontalLine Level4 = new StudyHorizontalLine(-5, Color.DarkGray, VisualLineStyle.Solid);
            Level4.Width = 2;
            Panels["PZOPanel"].Visuals.Add("Level4", Level4);

            Output.Add("Level5", new TimeSeries());
            StudyHorizontalLine Level5 = new StudyHorizontalLine(-40, Color.Red, VisualLineStyle.Solid);
            Level5.Width = 2;
            Panels["PZOPanel"].Visuals.Add("Level5", Level5);

            Output.Add("Level6", new TimeSeries());
            StudyHorizontalLine Level6 = new StudyHorizontalLine(-60, Color.Red, VisualLineStyle.Solid);
            Level6.Style = VisualLineStyle.Dot;
            Level6.Width = 4;
            Panels["PZOPanel"].Visuals.Add("Level6", Level6);
        }

        public override void Calculate()
        {
            TimeSeries close = Input.Close;
            TimeSeries R = new TimeSeries(close.Count);

            for (int ii = 1; ii < close.Count; ii++)
            {
                if (close[ii] < close[ii - 1])
                {
                    R[ii] = close[ii] * -1;
                }
                else
                {
                    R[ii] = close[ii];
                }
            }
            TimeSeries CP = Indicator.EMAvg(R, Period.Value);
            TimeSeries TC = Indicator.EMAvg(close, Period.Value);
            TimeSeries PZO = 100 * (CP / TC);

            Output.Update("PZO", PZO);
        }
    }
}

METASTOCK: PRICE ZONE OSCILLATOR
Walid Khalil and David Steckler’s article, “Entering The Price Zone,” offers a new indicator and suggests some rules for trading it. Shown here is the code for a system test based on those rules and the steps for entering the code into MetaStock.
To create a system test:
- Select Tools → the Enhanced System Tester
- Click New
- Enter a name
- Select the Buy Order tab and enter the following formula:
R := If( C > Ref( C, -1 ), C, -C );
CP := Mov(R, 14, E );
TC := Mov(C, 14, E );
PZO := 100 * ( CP / TC );

retrace := If( Cross( 40, PZO), 1,
If( PREV = 1 AND Cross( PZO, 0), 2, PREV ) );

C > Mov(C, 60, E) AND ADX( 14 ) > 18 AND
( Cross( PZO, -40 ) OR
(retrace = 2 AND Cross( PZO, 20 ) ) )
- Select the Sell Order tab and enter the following formula.
R := If( C > Ref( C, -1 ), C, -C );
CP := Mov(R, 14, E );
TC := Mov(C, 14, E );
PZO := 100 * ( CP / TC );

( PZO < 0 AND C < Mov( C, 60, E ) ) OR
( Ref( PZO > 60, -1 ) AND PZO < Ref( PZO, -1 ) )
- Select the Sell Short Order tab and enter the following formula:
R := If( C > Ref( C, -1 ), C, -C );
CP := Mov(R, 14, E );
TC := Mov(C, 14, E );
PZO := 100 * ( CP / TC );

retrace := If( Cross( PZO, -40 ), 1,
If( PREV = 1 AND Cross( 0, PZO ), 2, PREV ) );

C < Mov(C, 60, E) AND ADX( 14 ) > 18 AND
( Cross( 40, PZO ) OR
(retrace = 2 AND Cross( -20, PZO ) ) )
- Select the Buy to Cover Order tab and enter the following formula:
R := If( C > Ref( C, -1 ), C, -C );
CP := Mov(R, 14, E );
TC := Mov(C, 14, E );
PZO := 100 * ( CP / TC );

( PZO > 0 AND C > Mov( C, 60, E ) ) OR
( Ref( PZO < -60, -1 ) AND PZO > Ref( PZO, -1 ) )
- Click OK to close the system editor.

eSIGNAL: PRICE ZONE OSCILLATOR
For this month’s Traders’ Tip, we’ve provided two formulas, PriceZoneOsc.efs and PriceZoneOscWL.efs, based on the formula code given in Walid Khalil and David Steckler’s article in this issue, “Entering The Price Zone.”
The code from these Efs files is shown below.
Both studies contain a formula parameter to set the number of periods, which may be configured through the Edit Chart window. The PriceZoneOsc.efs code set is designed for the chart, which displays the oscillator (Figure 3). The PriceZoneOscWL.efs formula is designed for the watchlist (Figure 4), which outputs the state of the oscillator (supersold, oversold, negative, flat, positive, overbought, superbought). The watchlist study also contains additional parameters to set the type of output, font color, and custom colors for each of the oscillator states.
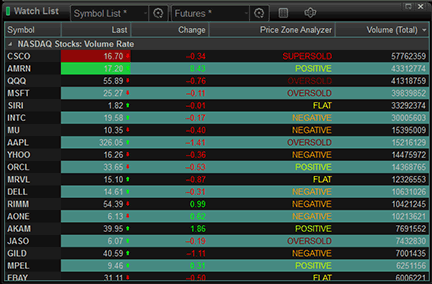
Figure 3: eSIGNAL, WATCHLIST. The formula code for the watchlist (“Price-ZoneOscWL.efs”) outputs the state of the oscillator (supersold, oversold, negative, flat, positive, overbought, superbought).
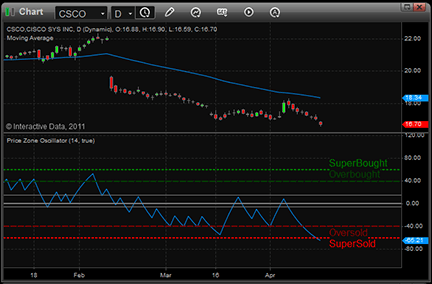
Figure 4: eSIGNAL, PRICE ZONE OSCILLATOR
To discuss these studies or download complete copies of the formula code, please visit the Efs Library Discussion Board forum under the Forums link from the Support menu at www.esignal.com or visit our Efs KnowledgeBase at https://www.esignal.com/support/kb/efs/.
eSignal code from “eSignal_PriceZoneOsc.efs” file
/*********************************
Provided By:
    Interactive Data Corporation (Copyright © 2010)
    All rights reserved. This sample eSignal Formula Script (EFS) is for educational purposes only. Interactive Data Corporation reserves the right to modify and overwrite this EFS file with each new release.

Description:
    The Price Zone Oscillator

Version:            1.0  15/04/2011

Formula Parameters:                     Default:
    Period                                14


Notes:
    The related article is copyrighted material. If you are not
    a subscriber of Stocks & Commodities, please visit www.traders.com.

**********************************/


var fpArray = new Array();

var bVersion = null;

function preMain()

{

    setStudyMin(-100);

    setStudyMax(100);

    setStudyTitle("Price Zone Oscillator");

    setCursorLabelName("Price Zone Osc", 0);


    var x=0;
    fpArray[x] = new FunctionParameter("gPeriod", FunctionParameter.NUMBER);
    with(fpArray[x++])
    {
	setName("Period");
	setLowerLimit(1);
        setDefault(14);
    }


    fpArray[x] = new FunctionParameter("gLevels", FunctionParameter.BOOLEAN);
    with(fpArray[x++])
    {
	setName("Show Levels");
        setDefault(true);
    }

}


var bInit = false;

var xCls = null;

var xR = null;

var xCP = null;

var xTC = null;

function main(gPeriod, gLevels)

{


    if (bVersion == null) bVersion = verify();

    if (bVersion == false) return;


    if (getBarState() == BARSTATE_ALLBARS)

    {

        if ( gLevels )

        {

                addBand(60, PS_DOT, 2, Color.green, "lev60");

                addBand(40, PS_DASH, 2, Color.darkgreen, "lev40");

                addBand(15, PS_SOLID, 1, Color.grey, "lev15");

                addBand(0, PS_SOLID, 2, Color.grey, "lev0");

                addBand(-5, PS_SOLID, 1, Color.grey, "lev5n");

                addBand(-40, PS_DASH, 2, Color.maroon, "lev40n");

                addBand(-60, PS_DOT, 2, Color.red, "lev60n");

                drawTextAbsolute(2, 61, "SuperBought", Color.green, null, Text.ONTOP | Text.BOTTOM, 'Arial', 10, "lT60");

                drawTextAbsolute(2, 41, "Overbought", Color.darkgreen, null, Text.ONTOP | Text.BOTTOM, 'Arial', 10, "lT40");

                drawTextAbsolute(2, -41, "Oversold", Color.maroon, null, Text.ONTOP | Text.TOP, 'Arial', 10, "lTN40");

                drawTextAbsolute(2, -61, "SuperSold", Color.red, null, Text.ONTOP | Text.TOP, 'Arial', 10, "lTN60");


        }

    }


    if (!bInit)

    {

        xCls = close();

        xR = efsInternal("calcSignedPrice", xCls);

        xCP = ema(gPeriod, xR);

        xTC = ema(gPeriod, xCls);

        bInit = true;

    }

    var vCP = xCP.getValue(0);

    var vTC = xTC.getValue(0);

    if ( vCP == null ) return null;

    var vPZO = 100;

    if ( vTC != 0 ) vPZO = 100 * vCP / vTC;


    return vPZO;


}


function calcSignedPrice(xCls)

{

        var vCls = xCls.getValue(0);

        var vCls1 = xCls.getValue(-1);

        if ( vCls1 == null ) return null;

        vCls = (vCls1 < vCls)? vCls : -vCls;

        return vCls;

}


function verify() {

    var b = false;

    if (getBuildNumber() < 779) {

        drawTextAbsolute(5, 35, "This study requires version 8.0 or later.",

            Color.white, Color.blue, Text.RELATIVETOBOTTOM|Text.RELATIVETOLEFT|Text.BOLD|Text.LEFT,

            null, 13, "error");

        drawTextAbsolute(5, 20, "Click HERE to upgrade.@URL=https://www.esignal.com/download/default.asp",

            Color.white, Color.blue, Text.RELATIVETOBOTTOM|Text.RELATIVETOLEFT|Text.BOLD|Text.LEFT,

            null, 13, "upgrade");

        return b;

    } else {

        b = true;

    }

    return b;

}
eSignal code from “eSignal_PriceZoneOscWatchList.efs” file
/*********************************
Provided By:
    Interactive Data Corporation (Copyright © 2010)
    All rights reserved. This sample eSignal Formula Script (EFS)
    is for educational purposes only. Interactive Data Corporation
    reserves the right to modify and overwrite this EFS file with
    each new release.

Description:
    The Price Zone Oscillator for Watch List

Version:            1.0  15/04/2011

Formula Parameters:                     Default:
    Period                                14
    View Type                             Text
    Coloring Type                         Font
    Super Overbought Color                Color.green
    Overbought Color                      Color.lime
    Positive Movement Color               Color.RGB(200,255,0)
    Flat Color                            Color.yellow
    Negative Movement Color               Color.RGB(255,155,0)
    Oversold Color                        Color.maroon
    Super Oversold Color                  Color.red

Notes:
    The related article is copyrighted material. If you are not
    a subscriber of Stocks & Commodities, please visit www.traders.com.

**********************************/

var fpArray = new Array();
var bVersion = null;
function preMain()
{
    setCursorLabelName("Price Zone Analyzer", 0);

    var x=0;
    fpArray[x] = new FunctionParameter("gPeriod", FunctionParameter.NUMBER);
    with(fpArray[x++])
    {
	setName("Period");
	setLowerLimit(1);
        setDefault(14);
    }

    fpArray[x] = new FunctionParameter("gViewOption", FunctionParameter.STRING);
    with(fpArray[x++])
    {
        setName("View Type");
        addOption("Value");
        addOption("Text");
        addOption("Sign");
        addOption("Nothing");
        setDefault("Text");
    }
    fpArray[x] = new FunctionParameter("gColoringOption", FunctionParameter.STRING);
    with(fpArray[x++])
    {
        setName("Coloring Type");
        addOption("Font");
        addOption("Background");
        addOption("No coloring");
        setDefault("Font");
    }
    fpArray[x] = new FunctionParameter("gSOBColor", FunctionParameter.COLOR);
    with(fpArray[x++])
    {
        setName("Super Overbought Color");
        setDefault(Color.green);
    }
    fpArray[x] = new FunctionParameter("gOBColor", FunctionParameter.COLOR);
    with(fpArray[x++])
    {
        setName("Overbought Color");
        setDefault(Color.lime);
    }
    fpArray[x] = new FunctionParameter("gPosColor", FunctionParameter.COLOR);
    with(fpArray[x++])
    {
        setName("Positive Movement Color");
        setDefault(Color.RGB(200,255,0));
    }

    fpArray[x] = new FunctionParameter("gFlatColor", FunctionParameter.COLOR);
    with(fpArray[x++])
    {
        setName("Flat Color");
        setDefault(Color.yellow);
    }

    fpArray[x] = new FunctionParameter("gNegColor", FunctionParameter.COLOR);
    with(fpArray[x++])
    {
        setName("Negative Movement Color");
        setDefault(Color.RGB(255,155,0));
    }

    fpArray[x] = new FunctionParameter("gOSColor", FunctionParameter.COLOR);
    with(fpArray[x++])
    {
        setName("Oversold Color");
        setDefault(Color.maroon);
    }
    fpArray[x] = new FunctionParameter("gSOSColor", FunctionParameter.COLOR);
    with(fpArray[x++])
    {
        setName("Super Oversold Color");
        setDefault(Color.red);
    }

}

var bInit = false;
var xCls = null;
var xR = null;
var xCP = null;
var xTC = null;

var servTable = new Array();
var outVal = null;

function main(gPeriod, gViewOption, gColoringOption, gSOBColor, gOBColor, gPosColor, gFlatColor, gNegColor, gOSColor, gSOSColor)
{

    if (bVersion == null) bVersion = verify();
    if (bVersion == false) return;

    if (!bInit)
    {
        xCls = close();
        xR = efsInternal("calcSignedPrice", xCls);
        xCP = ema(gPeriod, xR);
        xTC = ema(gPeriod, xCls);

        servTable[0] = new Array (gSOSColor, gOSColor, gNegColor, gFlatColor, gPosColor, gOBColor, gSOBColor);
        if (gViewOption == "Text") servTable[1] = new Array("SUPERSOLD", "OVERSOLD", "NEGATIVE", "FLAT", "POSITIVE", "OVERBOUGHT", "SUPERBOUGHT");
        if (gViewOption == "Sign") servTable[1] = new Array("- - -", " - - ", "-", "+ / -", "+" ," + + ", "+ + +");

        bInit = true;
    }
    var vCP = xCP.getValue(0);
    var vTC = xTC.getValue(0);
    if ( vCP == null ) return null;
    var vPZO = 100;
    if ( vTC != 0 ) vPZO = 100 * vCP / vTC;

    var cond = 0;
    if ( vPZO >= 15 ) cond = 1 ;
    if ( vPZO >= 40 ) cond = 2 ;
    if ( vPZO >= 60 ) cond = 3 ;
    if ( vPZO <=-5  ) cond = -1 ;
    if ( vPZO <=-40 ) cond = -2 ;
    if ( vPZO <=-60 ) cond = -3 ;

    if ( gColoringOption == "Background" ) setBarBgColor(servTable[0][cond + 3]);
    if ( gColoringOption == "Font" ) setBarFgColor(servTable[0][cond+3]);
    if ( gViewOption == "Value" ) outVal = vPZO;
    if ( gViewOption == "Text" || gViewOption == "Sign" ) outVal = servTable[1][cond + 3];

    return outVal;

}

function calcSignedPrice(xCls)
{
        var vCls = xCls.getValue(0);
        var vCls1 = xCls.getValue(-1);
        if ( vCls1 == null ) return null;
        vCls = (vCls1 < vCls)? vCls : -vCls;
        return vCls;
}

function verify() {
    var b = false;
    if (getBuildNumber() < 779) {
        drawTextAbsolute(5, 35, "This study requires version 8.0 or later.",
            Color.white, Color.blue, Text.RELATIVETOBOTTOM|Text.RELATIVETOLEFT|Text.BOLD|Text.LEFT,
            null, 13, "error");
        drawTextAbsolute(5, 20, "Click HERE to upgrade.@URL=https://www.esignal.com/download/default.asp",
            Color.white, Color.blue, Text.RELATIVETOBOTTOM|Text.RELATIVETOLEFT|Text.BOLD|Text.LEFT,
            null, 13, "upgrade");
        return b;
    } else {
        b = true;
    }
    return b;
}

WEALTH-LAB: PRICE ZONE OSCILLATOR
The price zone oscillator system, as presented in Walid Khalil and David Steckler’s article in this issue, “Entering The Price Zone,” has now been made available as a free download to Wealth-Lab users. To start exploring the potential of this oscillator to switch gears and trade in both trending and range-bound markets, simply click the download button in Wealth-Lab’s “open strategy” dialog.
Although implementation of this new oscillator, which was developed by the authors as a complement to their volume zone oscillator (Vzo) that they presented last issue, is fairly straightforward, the accompanying system rules have to function in different market regimes and cover such events as positive and negative price/oscillator divergences. The complexity of their implementation is hidden in an additional library named “Community components,” available for download to Wealth-Lab customers from our site, www.wealth-lab.com (see the “Extensions” section).
In Figure 5, users can see the divergence lines drawn on the chart (the traditional way) and as a “binary wave” to be used by mechanical trading systems.
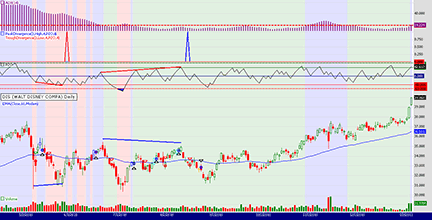
Figure 5: WEALTH-LAB, PRICE ZONE OSCILLATOR. This sample Wealth-Lab Developer 6.2 chart shows the price zone oscillator strategy applied to a daily chart of Walt Disney Co. (DIS).
C# code for Wealth-Lab:

using System;
using System.Collections.Generic;
using System.Text;
using System.Drawing;
using WealthLab;
using WealthLab.Indicators;
using Community.Components; // Divergence Between Two DataSeries (Detect, Plot)

namespace WealthLab.Strategies
{
	public class PZOStrategy : WealthScript
	{
		private StrategyParameter paramPeriod;

		public PZOStrategy()
		{
			paramPeriod = CreateParameter("PZO Period", 14, 2, 252, 2);
		}

		protected override void Execute()
		{
			int period = paramPeriod.ValueInt;
			DataSeries R = new DataSeries( Bars, "R" );
			DataSeries TV = EMA.Series( Close, period, EMACalculation.Modern );
			DataSeries PZO = new DataSeries( Bars, "PZO" );
			ADX adx = ADX.Series( Bars,14 );
			EMA ema = EMA.Series( Close, 60, EMACalculation.Modern );

			for(int bar = period; bar < Bars.Count; bar++) {
				R[bar] = Math.Sign( Close[bar] - Close[bar-1] ) * Close[bar];
			}
			DataSeries VP = EMA.Series( R, period, EMACalculation.Modern );

			for(int bar = period; bar < Bars.Count; bar++) {
				if( TV[bar] != 0 )
					PZO[bar] = 100 * VP[bar] / TV[bar];
			}

			ChartPane pzoPane = CreatePane( 30, true, true );
			PlotSeriesOscillator( pzoPane, PZO, 60, -60, Color.Red, Color.Blue, Color.Black, LineStyle.Solid, 1 );
			DrawHorzLine( pzoPane, 60, Color.DarkGreen, LineStyle.Dotted, 2 );
			DrawHorzLine( pzoPane, -60, Color.Red, LineStyle.Dotted, 2 );
			DrawHorzLine( pzoPane, 40, Color.DarkGreen, LineStyle.Solid, 1 );
			DrawHorzLine( pzoPane, -40, Color.Red, LineStyle.Solid, 1 );
			DrawHorzLine( pzoPane, 0, Color.DarkBlue, LineStyle.Solid, 1 );

			ChartPane divPane = CreatePane( 30, true, true );
			SeriesHelper sh = new SeriesHelper(this);
			DataSeries pd = sh.PlotPeakDivergence(3, PricePane, High, 4d, pzoPane, PZO, 4d);
			PlotSeries(divPane, pd, Color.Blue, LineStyle.Solid, 2);
			DataSeries td = sh.PlotTroughDivergence(3, PricePane, Low, 4d, pzoPane, PZO, 4d);
			PlotSeries(divPane, td, Color.Red, LineStyle.Solid, 2);

			ChartPane adxPane = CreatePane( 30, true, true );
			PlotSeries(adxPane, adx, Color.Purple, LineStyle.Histogram, 2);
			DrawHorzLine(adxPane, 18, Color.Red, LineStyle.Dashed, 2 );
			PlotSeries(PricePane, ema, Color.Blue, LineStyle.Solid, 1);

			int start = Math.Max(adx.FirstValidValue,period);
			start = Math.Max( start, ema.FirstValidValue );

			for(int bar = start; bar < Bars.Count; bar++)
			{
				bool bull = adx[bar] > 18 && Close[bar] > ema[bar];
				bool bear = adx[bar] > 18 && Close[bar] < ema[bar];
				bool osc = adx[bar] < 18;

				if( bull ) SetBackgroundColor( bar, Color.FromArgb( 30, Color.Blue ) );
				if( bear ) SetBackgroundColor( bar, Color.FromArgb( 30, Color.Red ) );
				if( osc ) SetBackgroundColor( bar, Color.FromArgb( 30, Color.Green ) );

				if (IsLastPositionActive)
				{
					Position p = LastPosition;
					if( p.PositionType == PositionType.Long ) {
						if( p.EntrySignal.ToLower().Contains("uptrend") ) {
							if( PZO[bar] > 60 && TurnDown( bar, PZO ) ||
								( Close[bar] < ema[bar] && PZO[bar] < 0 ) ||
								(pd[bar] <= -1.0 && PZO[bar] < 40.0) )
								SellAtMarket( bar+1, p, "trend sell" );
						}
						else if( p.EntrySignal.ToLower().Contains("buy nontrend") ) {
							if( PZO[bar] > 40.0 ) {
								if( adx[bar] > 18 )
									SellAtMarket( bar+1, p, "nontrend sell rule #1" );
							}
							else {
								if( PZO[bar] < -5 )
									SellAtMarket( bar+1, p, "nontrend sell rule #2" );
							}
						}
					}
					else {
						if( p.EntrySignal.ToLower().Contains("downtrend") ) {
							if( PZO[bar] < -60 && TurnUp( bar, PZO ) ||
								( Close[bar] > ema[bar] && PZO[bar] > 0 ) ||
								(td[bar] <= -1.0 && PZO[bar] > -40.0) )
								CoverAtMarket( bar+1, p, "trend cover" );
						}
						else if( p.EntrySignal.ToLower().Contains("short nontrend") ) {
							if( PZO[bar] < -40.0 ) {
								if( adx[bar] > 18 )
									CoverAtMarket( bar+1, p, "nontrend cover rule #1" );
							}
							else {
								if( PZO[bar] < -5 && CrossOver( bar, PZO, 15 ) )
									CoverAtMarket( bar+1, p, "nontrend cover rule #2" );
							}
						}
					}
				}
				else
				{
					bool buy = bull && ( CrossOver( bar, PZO, -40 ) || CrossOver( bar, PZO, 0 ) );
					bool shrt = bear && ( CrossUnder( bar, PZO, 40 ) || CrossUnder( bar, PZO, 0 ) );
					bool nt_buy = osc && (CrossOver( bar, PZO, -40 ) || CrossOver( bar, PZO, 15 ));
					bool nt_shrt = osc && (CrossUnder( bar, PZO, 40 ) || CrossUnder( bar, PZO, -5 ));

					if( buy ) {
						SetBarColor( bar, Color.Blue );
						BuyAtMarket( bar+1, "buy uptrend" );
					}
					else if( shrt ) {
						SetBarColor( bar, Color.Red );
						ShortAtMarket( bar+1, "short downtrend" );
					}
					else if( nt_buy ) {
						SetBarColor( bar, Color.Cyan );
						BuyAtMarket( bar+1, "buy nontrend" );
					}
					else if( nt_shrt ) {
						SetBarColor( bar, Color.Orange );
						ShortAtMarket( bar+1, "short nontrend" );
					}
				}
			}
		}
	}
}

AMIBROKER: PRICE ZONE OSCILLATOR
In “Entering The Price Zone” in this issue, authors Walid Khalil and David Steckler introduce the price zone oscillator (Pzo), which is very similar to the volume zone oscillator (Vzo) that they introduced in their article in the May 2011 issue, “In The Volume Zone.”
Pzo can be easily implemented using AmiBroker Formula Language. A ready-to-use formula for this indicator is shown here. To use it, enter the formula in the Afl Editor, then press “Insert indicator.” To modify the averaging period of the price zone oscillator, click on the chart with the right mouse button and select “parameters” from the context menu. The code also includes system rules that can be tested in the Automatic Analysis window.
AmiBroker code:

// PZO indicator
function PZOsc( Period )
{
 R = sign( Close - Ref( Close, -1 ) ) * Close;
 VP = EMA( R, Period );
 TV = EMA( Close, Period );
 return Nz( 100 * VP / TV );
}

Period = Param( "PZO period", 14, 2 , 200 );
PZO = PZOsc( Period );
Plot( PZO, "PZO" + _PARAM_VALUES(), colorBlue, styleThick );

// grid lines
PlotGrid( 60 );
Plot( 40, "", colorDarkGreen );
PlotGrid( 15 );
Plot( 0, "", colorBlack );
PlotGrid( -5 );
Plot( -40, "", colorBrown );
PlotGrid( -60 );

// system rules
Buy = ADX(14) < 18 AND ( Cross( PZO, -40 ) OR Cross( PZO, 15 ) );
Sell = ( Cross( PZO, 40 ) AND ADX( 14 ) > 18 ) OR Cross( -5, PZO );

Short = ADX(14) < 18 AND ( Cross( 40, PZO ) OR Cross( -5, PZO ) );
Cover = ( Cross( -40, PZO ) AND ADX( 14 ) > 18 ) OR Cross( PZO, 15 );
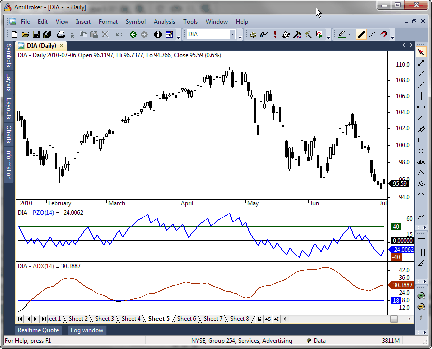
Figure 6: AMIBROKER, PRICE ZONE OSCILLATOR. Here is a daily price chart of the DIA (upper pane) with 14-period price zone oscillator (middle pane).

WORDEN BROTHERS TC2000: PRICE ZONE OSCILLATOR
The price zone oscillator (Pzo) presented by Walid Khalil and David Steckler in their article in this issue, “Entering The Price Zone,” has now been made available in the TC2000 indicator library. To add the indicator to your chart, just click the “Add indicator” button and select it from the list.
In the chart in Figure 7, we’ve plotted the 60-period exponential moving average of price plus the Adx with the period and smoothing set to 14. These additional indicators are used to evaluate the system rules explained in the article.
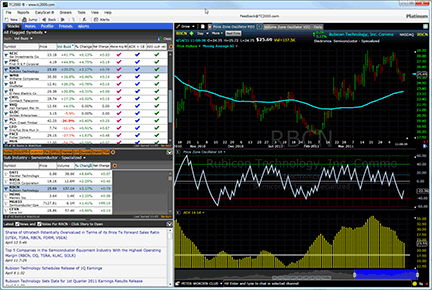
Figure 7: TC2000, PRICE ZONE OSCILLATOR. Here is a daily chart of Rubicon Technology (RBCN) with the 60-period exponential moving average of price; the PZO with oscillator zones; and the ADX. The watchlist also shows columns for “Price above the 60-day EMA,” “ADX above 18,” and “PZO crossing up through -40.”
The oscillator zones on the Pzo are marked using plot guides on the Pzo. To add/edit the plot guides on an indicator, click on the name of the indicator and select “Edit plot guides.” You can add and customize plot guides on any indicator in the system to mark significant levels. Once you’ve set up the plot guides the way you want them, click on the indicator and select “save.” You now have your own customized version of the indicator available to you in the indicator library.
Using the QuickSort/Add Column feature, you can find stocks meeting the various Pzo system rules. In Figure 7, we’ve added columns to find stocks that pass the uptrend buy rules. The stocks with three checkmarks next to them met the following criteria: price is above the 60-day exponential moving average; Adx is above 18; and the Pzo has just crossed up through the -40 level. This evaluation all happens in real time in TC2000.
For more information or to start a free trial, visit www.TC2000.com. Users can access their watchlists, scans, and chart templates while away from their computer using the new TC2000 Mobile app (see www.TC2000.com/Mobile).

NEUROSHELL TRADER: PRICE ZONE OSCILLATOR
The price zone oscillator (Pzo) described by Walid Khalil and David Steckler in their article in this issue can be easily implemented with a few of NeuroShell Trader’s 800+ indicators. Simply select “New indicator” from the Insert menu and use the Indicator Wizard to create the following indicator:
Multiply2( 100, Divide( ExpAvg( Multiply2( NumPosNegMom(Close,1,1), Close), 14), ExpAvg(Close, 14) ) )
To set up a trading system based on the Pzo, select “New trading strategy” from the Insert menu and enter the following in the appropriate locations of the Trading Strategy Wizard:
Generate a buy long market order if ONE of the following is true:
AND3( A>B(Close, ExpAvg(Close, 60) ), A>B(ADX(High, Low, Close, 14, 14), 18 ), OR2( CrossAbove(PZO, -40), CrossAbove(PZO,0) ) )
AND2( A<B(ADX(High, Low, Close, 14, 14), 18 ), OR2( CrossAbove(PZO, -40), CrossAbove(PZO,15) ) )

Generate a sell long market order if ONE of the following is true:
AND2( A>B(PZO, 60), A<B(Momentum(PZO,1), 0 )
CrossBelow(PZO, 40)
AND2( A<B(Close, ExpAvg(Close, 60), A<B(PZO, 0) )
AND2( A<B(ValueEntryActivated(ADX(High, Low, Close, 14, 14)), 18), A<B(PZO, -5))

Generate a sell short market order if ONE of the following is true:
AND3( A<B(Close, ExpAvg(Close, 60) ), A>B(ADX(High, Low, Close, 14, 14), 18 ), OR2( CrossBelow(PZO, 40), CrossBelow(PZO,0) ) )
AND2( A<B(ADX(High, Low, Close, 14, 14), 18 ), OR2( CrossBelow(PZO, 40), CrossBelow(PZO,-5) ) )

Generate a cover short market order if ONE of the following is true:
AND2( A<B(PZO, -60), A>B(Momentum(PZO,1), 0 )
CrossAbove(PZO, -40)
AND2( A>B(Close, ExpAvg(Close, 60), A>B(PZO, 0) )
AND2( A<B(ValueEntryActivated(ADX(High, Low, Close, 14, 14)), 18), A>B(PZO, 15))
If you have NeuroShell Trader Professional, you can also choose whether the parameters should be optimized. After backtesting the trading strategy, use the “Detailed analysis” button to view the backtest and trade-by-trade statistics for the strategy.
Users of NeuroShell Trader can go to the Stocks & Commodities section of the NeuroShell Trader free technical support website to download a copy of this or any previous Traders’ Tips.
A sample chart is shown in Figure 8.
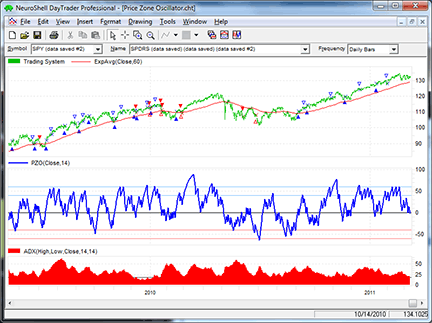
Figure 8: NEUROSHELL TRADER, PRICE ZONE OSCILLATOR. This NeuroShell Trader chart shows the price zone oscillator and corresponding trading system.

AIQ: PRICE ZONE OSCILLATOR
I coded both the price zone oscillator (Pzo) and volume zone oscillator (Vzo) from Walid Khalil and David Steckler’s article in this issue (“Entering The Price Zone”) and their article in the May 2011 issue (“In The Volume Zone”). I also coded the system that uses the Pzo or Vzo indicator. The code for both is shown below.
At the top of the code is an input called “usePzo.” When this input is set to equal “1,” then the indicator and system use the Pzo. If set to any other value, then the indicator and system use the Vzo oscillator. I had to use my own interpretation of what the divergence sell/cover rules of the authors’ system mean since the exact code for this part of the system is not given in the article. Also note that the nontrending case is provided with this code, but tests of the rule “BuyNoTrnd” showed that trading only when the market is trending was the better choice. As a result, my tests shown here were only of the trending portion of the system, as I had done in last month’s tests.
I ran a backtest using the Portfolio Manager module from 1/1/1998 to 4/8/2011 using the Nasdaq 100 list of stocks. In Figure 9, I show the test results of simulated trading on the Nasdaq 100 list of stocks, using the following parameters for capitalization:
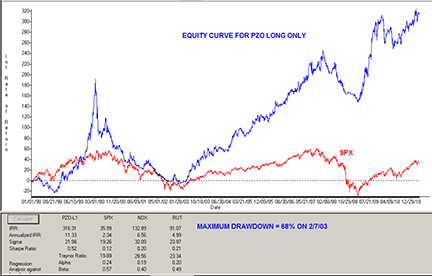
Figure 9: AIQ SYSTEMS, PRICE ZONE OSCILLATOR. Here is a sample PZO system equity curve trading longs only using the NASDAQ 100 list of stocks compared to the SPX index for the test period 1/1/1998 to 4/8/2011.
- Maximum positions per day = 3
- Maximum total positions allowed = 10
- Choose candidates using Adx values in descending order
- Size each position at 10% of total account equity recomputed every day.
For the test period, the average annual return was 11.3% with a maximum drawdown of 67.7% on 2/7/2003.
In the May 2011 Traders’ Tips column, I ran a similar test using the Vzo indicator and the results were slightly better than using the Pzo indicator with this system. The short-side test was unsuccessful, as the system lost all its capital during the early years of the test. Those results are not shown. I tried adding an index trend filter, but this did not save the short side from total loss.
The code and Eds file can be downloaded from www.TradersEdgeSystems.com/traderstips.htm. It is also shown below.
AIQ code

! ENTERING THE PRICE ZONE
! Authors: Walid Khalil and David Steckler TASC June 2011
! Coded by: Richard Denning 4/16/11
! www.TradersEdgeSystems.com

! INPUTS:
pLen is  14. !INPUT IS USED FOR PZO
vLen is  14. !INPUT IS USED FOR VZO
wLen is  14. !INPUT USED FOR DMI, ATR, ADX, ADX RATE
eLen is  60. !INPUT USED FOR EMA FOR TREND DETERMINATION
oLen is  21. !INPUT USED FOR LOOKBACK FOR VZO OVERBOT/OVERSOLD
usePZO is 1. !INPUT DETERMINES WHICH INDICATOR IS USED PZO=1 FOR PZO
useVZO is iff(usePZO=1,0,1).

!CODING ABREVIATIONS:
H is [high].
L is [low].
C is [close].
C1 is valresult(C,1).
H1 is valresult(H,1).
L1 is valresult(L,1).
V is [volume].
Pdays is {position days}.

!PZO INDICATOR FORMULAS:
CP is expavg(iff(C>C1,C,-C),pLen).
TC is expavg(C,pLen).
!PLOT PZO as custom indicator with +60 -60 support lines:
	PZO is CP / TC * 100.

!VZO INDICATOR FORMULAS:
R is iff(C > C1,V,-V).
VP is expavg(R,vLen).
TV is expavg(V,vLen).
!PLOT VZO as custom indicator with +60 -60 support lines:
	VZO is (VP / TV) * 100.

!DMI & ADX indicators as defined by Wells Wilder.
! NOTE: Wilder to expontential averaging the formula is:
!	Wilder length * 2 -1 = exponential averaging length
avgLen is wLen * 2 - 1.

!AVERAGE TRUE RANGE:
TR  is Max(H-L,max(abs(C1-L),abs(C1-H))).
ATR  is expAvg(TR,avgLen).

!+DM -DM CODE:
rhigh is (H-H1).
rlow is (L1-L).
DMplus is iff(rhigh > 0 and rhigh > rlow, rhigh, 0).
DMminus is iff(rlow > 0 and rlow >= rhigh, rlow, 0).
AvgPlusDM is expAvg(DMplus,avgLen).
AvgMinusDM is expavg(DMminus,avgLen).
PlusDMI is (AvgPlusDM/ATR)*100.	!PLOT AS INDICATOR
MinusDMI is AvgMinusDM/ATR*100.	!PLOT AS INDICATOR

!ADX INDICATOR
DIdiff is PlusDMI-MinusDMI.
ZERO if PlusDMI = 0 and MinusDMI = 0.
DIsum is PlusDMI+MinusDMI.
DX is iff(ZERO,100,abs(DIdiff)/DIsum*100).
!PLOT ADX as single line indicator with support at 24 is same as ADX (AIQ):
	ADX is ExpAvg(DX,avgLen).

!TRADING SYSTEM RULES:
EMA is expavg(C,eLen).
ZO is iff(usePZO = 1,PZO,iff(useVZO = 1,VZO,[RSI Wilder])).

UpTrend if ADX > 18 and C > EMA.
ZObuy1 if ZO > -40 and valrule(ZO < -40,1).
ZObuy2 if countof(ZO > 40,oLen) >=1 and ZO > 0 and valrule(ZO < 0,1).
ZObuy3 if ZO > 15 and valrule(ZO < 15,1).
Buy if UpTrend and (ZObuy1 or ZObuy2) and NOT Sell.
BuyNoTrnd if ADX < 18 and (ZObuy1 or ZObuy3).

ZOsell1 if countof(ZO > 60,2,1) >= 1 and ZO < valresult(VZO,1).
ZOsell2 if slope2(C,vLen/2) > 0 and slope2(ZO,vLen/2) < 0 and ZO < 40.
ZOsell3 if C < EMA and ZO < 0.
ZOsell4 if countof(ZO > 40,Pdays) >=1 and (ZOsell1 or ZOsell2 or ZOsell3).
ZOsell5 if countof(ZO > 40,Pdays) = 0 and ZO < -5 and valresult(ZO,1) > -5.
Sell if ZOsell1 or ZOsell2 or ZOsell3.
SellNoTrnd if ZOsell4 or ZOsell5.

DnTrend if ADX > 18 and C < EMA.
ZOshort1 if ZO < 40 and valrule(ZO > 40,1).
ZOshort2 if countof(ZO < -40,oLen) >=1 and ZO < 0 and valrule(ZO > 0,1).
ZOshort3 if ZO < -5 and valrule(ZO > -5,1).
Short if DnTrend and (ZOshort1 or ZOshort2) and NOT Cover.
ShortNoTrnd if ADX < 18 and (ZOshort1 or ZOshort3).

ZOcover1 if countof(ZO < -60,2,1) >= 1 and ZO > valresult(VZO,1).
ZOcover2 if slope2(C,vLen/2) < 0 and slope2(ZO,vLen/2) > 0 and ZO > -40.
ZOcover3 if C > EMA and ZO > 0.
ZOcover4 if countof(ZO < -40,Pdays) >=1 and (ZOcover1 or ZOcover2 or ZOcover3).
ZOcover5 if countof(ZO < -40,Pdays) = 0 and ZO > 15 and valresult(ZO,1) < 15.
Cover if ZOcover1 or ZOcover2 or ZOcover3.
CoverNoTrnd if ZOcover4 or ZOcover5.

TRADERSSTUDIO: PRICE ZONE OSCILLATOR
Shown here is the TradersStudio code for the Pzo and Vzo indicators and related systems from Walid Khalil and David Steckler’s articles, “Entering The Price Zone” in this issue and “In The Volume Zone” from the May 2011 issue. One of the inputs to the Pzo system is called “usePzo.”
When this input is set to equal “1,” then the indicator and system use the Pzo. If set to any other value, then the indicator and system use the Vzo. Since my tests showed that trading the short side of the system resulted in net losses, I have also provided an input called “allowShorts” that will disable shorting if set to anything other than “1.” In the tests I ran, I set “allowShorts” = 0 so that shorting was disabled. The system code provided here for TraderStudio is based on the TradeStation code provided in the article and, as noted in the article, the divergence exit is not coded.
I ran a backtest using the Tradeplan module from 1/1/1992 to 4/15/2011 using a “Nasdaq 100–like” list of stocks, which contained 74 stocks. I used a Tradeplan that divided the capital into 74 equal pieces so that all signals could be taken. In Figure 10, I show the Tradeplan equity curve and in Figure 11, I show the Tradeplan underwater equity curve. For the test period, the compound annual return was 5.04% with a maximum drawdown of 24.52% on 3/11/2003.
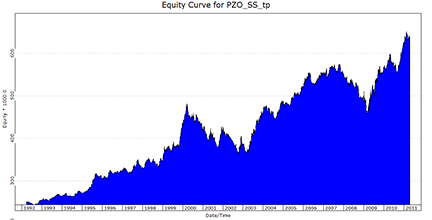
Figure 10: TRADERSSTUDIO, PRICE ZONE OSCILLATOR/ VOLUME ZONE OSCILLATOR SYSTEM. Here is the equity curve from the Tradeplan module that resulted from a backtest of the PZO/VZO system using equal equity sizing, trading all signals from a list of 74 stocks similar to the NASDAQ 100.
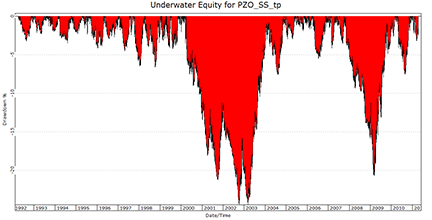
Figure 11: TRADERSSTUDIO, SYSTEM DRAWDOWNS. This shows the underwater equity curve from the Tradeplan module that resulted from a backtest of the PZO/VZO system using equal equity sizing, trading all signals from a list of 74 stocks similar to the NASDAQ 100.
The code can be downloaded from the TradersStudio website at www.TradersStudio.com→Traders Resources→FreeCode or www.TradersEdgeSystems.com/traderstips.htm. The code is also shown below.
TradersStudio code

' ENTERING THE PRICE ZONE
' Authors: Walid Khalil and David Steckler,
'          TASC June 2011
' Coded by: Richard Denning 04/16/2011
' www.TradersEdgeSystems.com

Function PZO(pLen)
' Default:
'pLen is  14.
Dim R As BarArray
Dim CP As BarArray
Dim TC As BarArray
R = IFF(C > C[1],C,-C)
CP = XAverage(R,pLen)
TC = XAverage(C,pLen)
PZO = (CP / TC) * 100
End Function
'----------------------------------------------
'PZO INDICATOR:

Sub PZO_IND(pLen)
plot1(PZO(PLen))
plot2(60)
plot3(40)
plot4(0)
Plot5(-40)
Plot6(-60)
End Sub
'----------------------------------------------
'PZO OR VZO SYSTEM:
Sub PZO_SYS(pLen,emaLen,usePZO,allowShorts)
' pLen = 14
'allowShorts = 1 trade both long and short else only trade long
Dim xADX As BarArray
Dim xEMA As BarArray
Dim xVZO As BarArray
Dim xPZO As BarArray
Dim xMax As BarArray
Dim xMin As BarArray
Dim B2_SU As BarArray
Dim S2_SU As BarArray
Dim MP As BarArray

MP = marketpos(0)
xPZO = PZO(pLen)
xVZO = VZO(pLen)
xADX = ADX(pLen,0)
xEMA = XAverage(C,emaLen)
If BarNumber = FirstBar Then
    xMax = 0
    xMin = 0
    B2_SU = 0
    S2_SU = 0
End If

If usePZO = 1 Then
    xMax = xPZO
    xMin = xPZO
Else
    xMax = xVZO
    xMin = xVZO
End If

If CrossesOver(xMin,0) Then B2_SU = 1 Else B2_SU = B2_SU[1]
If CrossesUnder(xMax,0)Then S2_SU = 1 Else S2_SU = S2_SU[1]

If xADX > 18 Then
    'ADX > 18 cases
    If MP <= 0 And C > xEMA Then
        If CrossesOver(xMax,-40) Then Buy("LE1",1,0,Market,Day)
        If B2_SU = 1 And CrossesOver(xMax,15) Then Buy("LE2",1,0,Market,Day)
    End If
    If MP > 0 Then
        If xMax[1] > 60 And xMax < xMax[1] Then ExitLong("LX1","",1,0,Market,Day)
        If C < xEMA And xMin < 0 Then ExitLong("LX2","",1,0,Market,Day)
    End If
    If MP >= 0 And C < xEMA And allowShorts = 1 Then
        If CrossesUnder(xMin,40) Then Sell("SE1",1,0,Market,Day)
        If S2_SU = 1 And CrossesUnder(xMin,-5) Then Sell("SE2",1,0,Market,Day)
    End If
    If MP < 0 Then
        If xMin[1] < -60 And xMin > xMin[1] Then ExitShort("SX1","",1,0,Market,Day)
        If C > xEMA And xMax > 0 Then ExitShort("SX2","",1,0,Market,Day)
    End If

Else
    'ADX <= 18 cases
    If MP <= 0 Then
        If CrossesOver(xMax,-40) Then Buy("LE3",1,0,Market,Day)
        If CrossesOver(xMax,15) Then Buy("LE4",1,0,Market,Day)
    End If
    If MP > 0 Then
        If xMax > 40 Then
            If xMax[1] > 60 And xMax < xMax[1] Then ExitLong("LX3","",1,0,Market,Day)
        Else
            If C < xEMA And xMin < 0 Then ExitLong("LX4","",1,0,Market,Day)
            If xMin < -5 Then ExitLong("LX5","",1,0,Market,Day)
        End If
    End If
    If MP >= 0 And allowShorts = 1 Then
        If CrossesUnder(xMin,40) Then Sell("SE3",1,0,Market,Day)
        If CrossesUnder(xMin,-5) Then Sell("SE4",1,0,Market,Day)
    End If

    If MP < 0 Then
        If xMin < -40 Then
            If xMin[1] < -60 And xMin > xMin[1] Then ExitShort("SX3","",1,0,Market,Day)
        Else
            If C > xEMA And xMax > 0 Then ExitShort("SX4","",1,0,Market,Day)
            If xMax > 15 Then ExitShort("SX5","",1,0,Market,Day)
        End If
    End If
End If

If CrossesUnder(xMin,15) Then B2_SU = 0 Else B2_SU = B2_SU[1]
If CrossesOver(xMax,-5) Then S2_SU = 0 Else S2_SU = S2_SU[1]

End Sub
End Sub

STRATASEARCH: PRICE ZONE OSCILLATOR
The price zone oscillator, as described by authors Walid Khalil and David Steckler in their article in this issue, “Entering The Price Zone,” proved to be a very nice indicator in our tests.
Using the authors’ uptrend system rules against the S&P 500 stocks from 2003 to present, the system generated an annual return of roughly twice the S&P 500 index. Drawdowns were significantly lower as well, meaning the system had both higher rewards and lower risk than the index.
However, one noticeable issue was that the percentage of profitable trades was only about 32%. Similarly, the maximum consecutive losses was 26, a value that most traders would have trouble accepting.
In our second test, we took the base Pzo indicator and ran it through a search for supporting trading rules. In just a few hours, we were able to find combinations of supporting trading rules that raised the percentage of profitable trades over 70%. Annual returns increased even further, and drawdowns were held at a minimum. In the end, our conclusion is that the Pzo can be a very helpful indicator, but it becomes significantly more powerful when paired with the proper supporting rules.
StrataSearch users can import a plugin for the price zone oscillator from the Shared Area of the StrataSearch user forum. The plugin contains a chart, strategy setup, and all the settings needed to run the Pzo in an automated search for supporting trading rules.
//*********************************************************
// Price Zone Oscillator
//*********************************************************
period = parameter("Period");

R = if(C > ref(C, -1), C, -C);
CP = mov(R, period, E);
TC = mov(C, period, E);

PZO = 100 * (CP / TC);
A sample chart is shown in Figure 12.
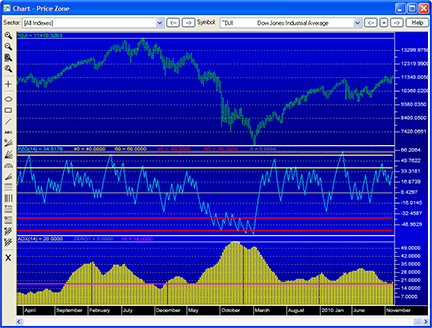
Figure 12: STRATASEARCH, Price Zone Oscillator. An oversold reversal can be seen in the center panel, when the PZO crosses from below -40 to above -40.

TRADECISION: PRICE ZONE OSCILLATOR
In their article “Entering The Price Zone” in this issue, authors Walid Khalil and David Steckler introduce the price zone oscillator (Pzo), a complementary indicator to their volume zone oscillator (Vzo) described in their previous article.
To recreate this indicator in Tradecision, use Tradecision’s Function Builder to set up the Pzo function by using the following code:
function (Period:Numeric=14):Numeric;
var
R:=0;
CP:=0;
TC:=0;
PZO:=0;
end_var

R:=iff(C >Ref(C, -1), C, -C);
CP:=Mov(R, period, E);
TC:=Mov(C, period, E);
PZO:=100 * (CP / TC);

return PZO;

Then one needs to create the PZO strategy using Tradecision's Strategy Builder:

Entry Long:

Vars
Price:= Close;
UsePZO:= true;
xADX:=0;
xEMA:=Price;
xVZO:=0;
xPZO:=0;
xMax:=0;
xMin:=0;
B2_SU:=false;
EntryLong:=false;
End_Var

xPZO := PZO(14);
xADX := ADX(14);
xEMA := EMA(Price, 60);

if HISTORYSIZE < 1 then
 B2_SU := B2_SU\1\;

if UsePZO then
   begin
        xMax:= xPZO;
        xMin:= xPZO;
   end;

if xADX > 18 then
begin { ADX > 18 cases}
   if IsShortPosition or IsInPosition=false and Price > xEMA then
      begin
           if  CrossAbove(xMAX,-40) then
              EntryLong:=true; {BUY1}
           if CrossAbove(xMIN,0) then B2_SU:= TRUE;
           if B2_SU and CrossAbove(xMAX,15) then
              EntryLong:=true; {BUY2}
      end;
end; else

begin  { ADX < 18 cases}

    if IsShortPosition or IsInPosition=false then
    begin
       if CrossAbove(xMax ,-40) then
              EntryLong:= true {BUY3};
       if CrossAbove(xMax,15) then
              EntryLong:= true {BUY4};
    end;

end;
if CrossBelow(xMin,15) then B2_SU:= FALSE;
return EntryLong;

Exit Long:

Vars
Price:= Close;
UsePZO:= true;
xADX:=0;
xEMA:=Price;
xVZO:=0;
xPZO:=0;
xMax:=0;
xMin:=0;
ExitLong:=false;
End_Var

xPZO := PZO(14);
xADX := ADX(14);
xEMA := EMA(Price, 60);

if UsePZO then
   begin
        xMax:= xPZO;
        xMin:= xPZO;
   end;

if xADX > 18 then
begin { ADX > 18 cases}

      if IsLongPosition then
      begin
         if xMax\1\ > 60 and xMax < xMax\1\ then
              ExitLong:=true; {SELL1}
         if Price < xEMA and xMin < 0 then
              ExitLong:=true; {SELL2}
      end;

end; else

begin  { ADX < 18 cases}
    if IsLongPosition then
    begin
       if xMax > 40 then
       begin
          if xMax\1\ > 60 and xMax < xMax\1\ then
              ExitLong:=true; {SELL3};
          if Price < xEMA and xMin < 0 then
              ExitLong:=true; {SELL4};
       end; else
          if xMin < -5 then
              ExitLong:=true; {SELL5};
    end;
end;
return ExitLong;

Entry Short:

Vars
Price:= Close;
UsePZO:= true;
xADX:=0;
xEMA:=Price;
xVZO:=0;
xPZO:=0;
xMax:=0;
xMin:=0;
S2_SU:=false;
EntryShort:=false;
End_Var

xPZO := PZO(14);
xADX := ADX(14);
xEMA := EMA(Price, 60);

if HISTORYSIZE < 1 then
 S2_SU := S2_SU\1\;

if UsePZO then
   begin
        xMax:= xPZO;
        xMin:= xPZO;
   end;

if xADX > 18 then
begin { ADX > 18 cases}

      if IsLongPosition or IsInPosition=false and Price < xEMA then
      begin
      if CrossBelow(xMin,40) then
              EntryShort:= true; {SELL SHORT1}
      if CrossBelow(xMax,0) then S2_SU:= TRUE;
      if S2_SU and CrossBelow(xMin,-5) then
              EntryShort:= true; {SELL SHORT2}
      end;
end; else

begin  { ADX < 18 cases}
    if IsLongPosition or IsInPosition=false then
    begin
       if CrossBelow(xMin,40) then
              EntryShort:= true {SELL SHORT3};
       if CrossBelow(xMin,-5) then
              EntryShort:= true {SELL SHORT4};
    end;
end;
if CrossAbove(xMax,-5) then S2_SU:= FALSE;

return EntryShort;

Exit Short:

Vars
Price:= Close;
UsePZO:= true;
xADX:=0;
xEMA:=Price;
xVZO:=0;
xPZO:=0;
xMax:=0;
xMin:=0;
ExitShort:=false;
End_Var

xPZO := PZO(14);
xADX := ADX(14);
xEMA := EMA(Price, 60);

if UsePZO then
   begin
        xMax:= xPZO;
        xMin:= xPZO;
   end;

if xADX > 18 then
begin { ADX > 18 cases}
      if IsShortPosition then
      begin
         if xMin\1\ < -60 and xMin > xMin\1\ then
              ExitShort:=true; {COVER1}
         if Price > xEMA and xMax > 0 then
              ExitShort:=true; {COVER2}
      end;
end; else

begin  { ADX < 18 cases}
    if IsShortPosition then
    begin
       if xMin < -40 then begin
          if xMin\1\ < -60 and xMin > xMin\1\ then
              ExitShort:=true; {COVER3};
          if Price > xEMA and xMax > 0 then
              ExitShort:=true; {COVER4};
       end; else
          if xMax > 15 then
              ExitShort:=true; {COVER5};
    end;
end;
return ExitShort;
To import the strategy into Tradecision, visit the area “Traders’ Tips from Tasc Magazine” at www.tradecision.com/support/tasc_tips/tasc_traders_tips.htm or copy the code above.
A sample chart is shown in Figure 13.
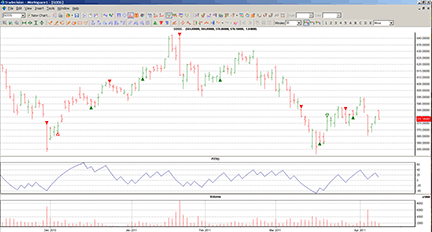
FIGURE 13: TRADECISION, PRICE ZONE OSCILLATOR. Here we see the volume zone oscillator and price zone oscillator plotted on a chart of Google (GOOG) with buy and sell signals generated by the PZO trading strategy.

NINJATRADER: PRICE ZONE OSCILLATOR
The PzoStrategy and the PrizeZoneOscillator, as presented in “Entering The Price Zone” in this issue by Walid Khalil and David Steckler, have now been implemented for NinjaTrader as an automated strategy and indicator available for download at www.ninjatrader.com/SC/June2011SC.zip.
Once downloaded, from within the NinjaTrader Control Center window, select the menu File→Utilities→Import NinjaScript and select the downloaded file. This file is for NinjaTrader version 7 or greater.
You can review the strategy source code by selecting the menu Tools→Edit NinjaScript→Strategy from within the NinjaTrader Control Center window and selecting “PZOStrategy.”
You can review the indicator source code by selecting the menu Tools→Edit NinjaScript→Indicator from within the NinjaTrader Control Center window and selecting “PriceZoneOscillator.”
NinjaScript uses compiled Dlls that run native, not interpreted, to provide the highest possible performance.
A sample chart implementing the strategy is shown in Figure 14.
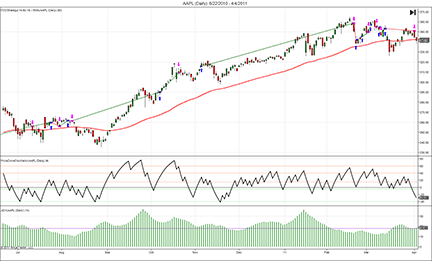
Figure 14: NINJATRADER, PRICE ZONE OSCILLATOR. This NinjaTrader chart shows the PZOStrategy and related indicators applied to a daily chart of Apple Inc. (AAPL).

TRADE NAVIGATOR: PRICE ZONE OSCILLATOR
Trade Navigator offers all the features you need to recreate and test the indicator and strategy presented in “Entering The Price Zone” by Walid Khalil and David Steckler in this issue.
First go to the Strategies tab in the Trader’s Toolbox. Click on the New button. Click the New Rule button.
To create the long entry rule (Long Entry # 1), input the following code:
IF ADX (14 , False) > 18 And Position <= 0 And Close > MovingAvg (Close , 60) And Crosses Above (PZO (14) , -40)
Set the Action to “Long Entry (Buy)” and the Order Type to “Market.”
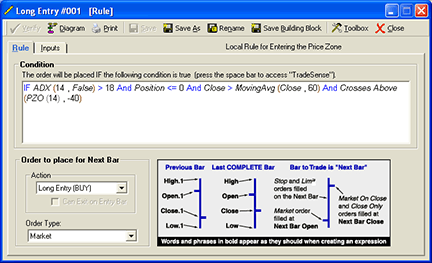
Click on the Save button. Type a name for the rule and then click the OK button.
Repeat these steps for the other 17 rules using the following sets of code:
Long Entry # 2

IF (ADX (14 , False) > 18 And Position <= 0 And Crosses Above (PZO (14) , 0) And Crosses Above (PZO (14) , 15))
Set the Action to “Long Entry (Buy)” and the Order Type to “Market.”
Click on the Save button. Type a name for the rule and then click the OK button.
Long Entry # 3

IF ADX (14 , False) < 18 And Position <= 0 And Crosses Above (PZO (14) , -40)
Set the Action to “Long Entry (Buy)” and the Order Type to “Market.”
Click on the Save button. Type a name for the rule and then click the OK button.
Long Entry # 4

IF ADX (14 , False) < 18 And Position <= 0 And Crosses Above (PZO (14) , 15)
Set the Action to “Long Entry (Buy)” and the Order Type to “Market.”
Click on the Save button. Type a name for the rule and then click the OK button.
Long Exit # 1

IF ADX (14 , False) > 18 And Position > 0 And PZO (14).1 > 60 And PZO (14) < PZO (14).1
Set the Action to “Long Exit (Sell)” and the Order Type to “Market.”
Click on the Save button. Type a name for the rule and then click the OK button.
Long Exit # 2

IF ADX (14 , False) > 18 And Position > 0 And Close > MovingAvgX (Close , 60 , False) And PZO (14) < 0
Set the Action to “Long Exit (Sell)” and the Order Type to “Market.”
Click on the Save button. Type a name for the rule and then click the OK button.
Long Exit # 3

IF ADX (14 , False) < 18 And Position > 0 And PZO (14) > 40 And PZO (14).1 > 60 And PZO (14) < PZO (14).1
Set the Action to “Long Exit (Sell)” and the Order Type to “Market.”
Click on the Save button. Type a name for the rule and then click the OK button.
Long Exit # 4

IF ADX (14 , False) < 18 And Position > 0 And PZO (14) > 40 And Close < MovingAvgX (Close , 60 , False) And PZO (14) < 0
Set the Action to “Long Exit (Sell)” and the Order Type to “Market.”
Click on the Save button. Type a name for the rule and then click the OK button.
Short Entry # 1

IF ADX (14 , False) > 18 And Position >= 0 And Close < MovingAvgX (Close , 60 , False) And PZO (14) And Crosses Below (PZO (14) , 40)
Set the Action to “Short Entry (Sell)” and the Order Type to “Market.”
Click on the Save button. Type a name for the rule and then click the OK button.
Short Entry # 2

IF ADX (14 , False) > 18 And Position >= 0 And Crosses Below (PZO (14) , 0) And Crosses Below (PZO (14) , -5)
Set the Action to “Short Entry (Sell)” and the Order Type to “Market.”
Click on the Save button. Type a name for the rule and then click the OK button.
Short Entry # 3

IF ADX (14 , False) < 18 And Position >= 0 And Crosses Below (PZO (14) , 40)
Set the Action to “Short Entry (Sell)” and the Order Type to “Market.”
Click on the Save button. Type a name for the rule and then click the OK button.
Short Entry # 4

IF ADX (14 , False) < 18 And Position >= 0 And Crosses Below (PZO (14) , -5)
Set the Action to “Short Entry (Sell)” and the Order Type to “Market.”
Click on the Save button. Type a name for the rule and then click the OK button.
Short Entry # 5

IF ADX (14 , False) < 18 And Position > 0 And PZO (14) < 40 And PZO (14) < -5
Set the Action to “Short Entry (Sell)” and the Order Type to “Market.”
Click on the Save button. Type a name for the rule and then click the OK button.
Short Exit # 1

IF ADX (14 , False) > 18 And Position < 0 And PZO (14).1 < -60 And PZO (14) > PZO (14).1
Set the Action to “Short Exit (Buy)” and the Order Type to “Market.”
Click on the Save button. Type a name for the rule and then click the OK button.
Short Exit # 2

IF ADX (14 , False) > 18 And Position < 0 And Close > MovingAvgX (Close , 60 , False) And PZO (14) > 0
Set the Action to “Short Exit (Buy)” and the Order Type to “Market.”
Click on the Save button. Type a name for the rule and then click the OK button.
Short Exit # 3

IF ADX (14 , False) < 18 And Position < 0 And PZO (14) < -40 And PZO (14).1 < -60 And PZO (14) > PZO (14).1
Set the Action to “Short Exit (Buy)” and the Order Type to “Market.”
Click on the Save button. Type a name for the rule and then click the OK button.
Short Exit # 4

IF ADX (14 , False) < 18 And Position < 0 And PZO (14) < -40 And Close > MovingAvgX (Close , 60 , False) And PZO (14) > 0
Set the Action to “Short Exit (Buy)” and the Order Type to “Market.”
Click on the Save button. Type a name for the rule and then click the OK button.
Short Exit # 5

IF ADX (14 , False) < 18 And Position < 0 And PZO (14) > -40 And PZO (14) > 15
Set the Action to “Short Exit (Buy)” and the Order Type to “Market.”
Click on the Save button. Type a name for the rule and then click the OK button.
Settings
After you have all of the entry and exit rules set up, go to the Settings tab in the Strategy editor:
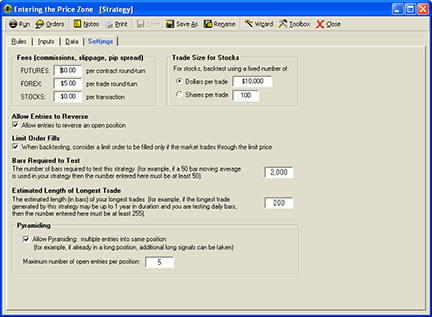
Place a check mark next to “Allow entries to reverse” and another one next to “Allow pyramiding.” Change the Maximum number of open entries per position to 5.
Save the strategy by clicking the Save button, typing a name for the strategy, and then clicking the OK button.
You can test your new strategy by clicking the Run button to see a report or you can apply the strategy to a chart for a visual representation of where the strategy would place trades over the history of the chart.
To set up the indicator, open the Trader’s Toolbox, click on the Functions tab and click the New button. Type in the following code:
&R := IFF (Close > Close.1 , Close , Close * -1)
&CP := MovingAvgX (&R , period , False)
&TC := MovingAvgX (Close , period , False)
&PZO := 100 * &CP / &TC
&PZO
Click the Verify button. When the Add Inputs window comes up, click the Add button. Change the default value to 14.
Click on the Save button, type a name for your new function, and click OK.
To see the indicator on a chart, go to the “Add to chart” window by clicking on the chart and typing “A” on the keyboard.
Click on the Indicators tab, find the PZO indicator in the list, and either doubleclick on it or highlight the name and click the Add button.
Genesis Financial Technologies is providing this strategy as a special downloadable file for Trade Navigator. To access it, click on the blue phone icon in Trade Navigator, select Download Special File, type “SC1106,” and click the Start button. The library name is “Entering The Price Zone,” the strategy name is “Entering The Price Zone,” and the indicator name is Pzo.

UPDATA: PRICE ZONE OSCILLATOR
This tip is based on “Entering The Price Zone” by Walid Khalil and David Steckler in this issue. In their article, the authors present the price zone oscillator (Pzo), which is a companion indicator to the volume zone oscillator (Vzo) that they introduced in their article last month in the May 2011 S&C (“In The Volume Zone”). Their new indicator seeks to place each close-to-close difference in the context of an overall price move in order to deduce bullish or bearish phases.
The Updata code based on this concept in both indicator and system form has now been added to the Updata Library and may be downloaded by clicking the Custom menu and then either Indicator or System Library. Those who cannot access the library due to a firewall may paste the code shown below into the Updata Custom editor and save it.
A sample Updata chart implementing the new indicator is shown in Figure 15.
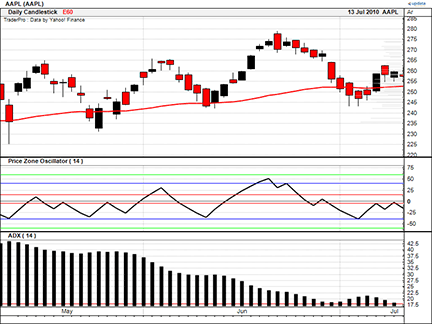
FIGURE 15: UPDATA, PRICE ZONE OSCILLATOR. This sample Updata chart shows the 14-period price zone oscillator as applied to the share price of Apple Inc. (AAPL).
PARAMETER "Period" #Period=14
NAME "Price Zone Oscillator (" #Period ")" ""
PlotStyle Thick2 RGB(0,0,0)
@CloseSign=0
@ClosingPosition=0
@TotalClose=0
@PriceZoneOsc=0

FOR #CURDATE=#Period To #LASTDATE
   @CloseSign=Sign(Close-Close(1))*Close
   @ClosingPosition=Sgnl(@CloseSign,#Period,E)
   @TotalClose=Sgnl(Close,#Period,E)
   @PriceZoneOsc=100*(@ClosingPosition/@TotalClose)
   @Plot=@PriceZoneOsc
   DRAWLEVEL LINE,0,RGB(100,100,100)
   DRAWLEVEL LINE,15,RGB(255,0,0)
   DRAWLEVEL LINE,-5,RGB(255,0,0)
   DRAWLEVEL LINE,40,RGB(0,0,255)
   DRAWLEVEL LINE,-40,RGB(0,0,255)
   DRAWLEVEL LINE,60,RGB(0,255,0)
   DRAWLEVEL LINE,-60,RGB(0,255,0)
NEXT

SHARESCOPE: PRICE ZONE OSCILLATOR
This script for ShareScope replicates the price zone oscillator (Pzo) described by Walid Khalil and David Steckler in their article in this issue, “Entering The Price Zone.” As you can see on the chart in Figure 16, strong signals are given by the oscillator entering and then exiting the +/- 40% levels.
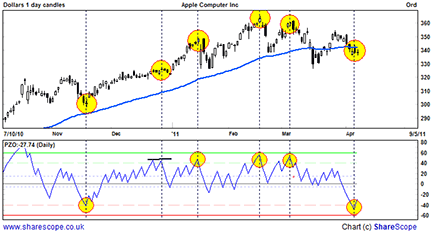
Figure 16: SHARESCOPE, PRICE ZONE OSCILLATOR. Strong signals can be seen given by the oscillator entering and then exiting the +/- 40% levels.
ShareScope code for PZO
//@Name:PZO
//@Description: Draws the Price Zone Oscillator
//Author: Phil Tolhurst, ShareScript Support
// Care has been taken in preparing this code but it is provided without guarantee.
// You are welcome to modify and extend it. Please add your name as a modifier if you distribute it.

function init()
{
	setSeriesColour(0,Colour.Black);
	setSeriesLineStyle(0,0,0);

	setSeriesColour(1, Colour.Blue);
	setSeriesLineStyle(1, 0, 0);

	setSeriesColour(2, Colour.Green);
	setSeriesLineStyle(2, 0, 0);

	setSeriesColour(3, Colour.LightGreen);
	setSeriesLineStyle(3, 1, 0);

	setSeriesColour(4, Colour.LightBlue);
	setSeriesLineStyle(4, 2, 0);

	setSeriesColour(5, Colour.DarkGrey);
	setSeriesLineStyle(5, 0, 0);

	setSeriesColour(6, Colour.LightBlue);
	setSeriesLineStyle(6, 2, 0);

	setSeriesColour(7, Colour.LightRed);
	setSeriesLineStyle(7, 1, 0);

	setSeriesColour(8, Colour.Red);
	setSeriesLineStyle(8, 0, 0);
}

function getGraph(share, data)
{
	var TITLE = []; TITLE[data.length-1] = undefined;  //Sets Title Colour
	var EOB= [60]; // Extremely Overbought
	var OB = [40]; // Overbought
	var POS15 = [15]; //Positive fifteen
	var ZERO = [0]; //Zero Line
	var NEG5 = [-5]; //Negative fiften
	var OS = [-40]; //Oversold
	var EOS = [-60]; //Extremely Overslold

	var CP = []; //Closing Position
	var TC = []; //Total Close
	var PZO = []; //Price Zone Oscillator

	var period = 14;

	var CPmaCalc =  new MA(period,MA.Exponential);
	var TCmaCalc = new MA(period,MA.Exponential);

	for (var i=0;i<data.length;i++)
	{
		if (i==0)
		{
			CP[i] = CPmaCalc.getNext(data[i].close);
			TC[i] = TCmaCalc.getNext(data[i].close);
			continue;
		}
		else
		{
			if (data[i].close<data[i-1].close)
			{
				CP[i] = CPmaCalc.getNext(data[i].close*-1);
			}
			else
			{
				CP[i] = CPmaCalc.getNext(data[i].close);
			}
			TC[i] = TCmaCalc.getNext(data[i].close);
		}
		if (TC[i] == 0)
		{
			PZO[i]=0;
		}
		else
		{
			PZO[i] = (CP[i]/TC[i])*100
		}
		EOB[i]=EOB[i-1];
		OB[i]=OB[i-1];
		POS15[i]=POS15[i-1];
		ZERO[i]=ZERO[i-1];
		NEG5[i]=NEG5[i-1];
		OS[i]=OS[i-1];
		EOS[i]=EOS[i-1];
	}
	setTitle("PZO:"+(PZO[data.length-1].toFixed(2)));
	return[TITLE,PZO,EOB,OB,POS15,ZERO,NEG5,OS,EOS];
}

TRADESIGNAL: PRICE ZONE OSCILLATOR
The price zone oscillator (Pzo) introduced by Walid Khalil and David Steckler in their article in this issue, “Entering The Price Zone,” can easily be used with our online charting tool at www.tradesignalonline.com.
Along with this new indicator, we’re also offering a strategy based on the price zone oscillator. To download it, go to www.tradesignalonline.com and check the “Infopedia” section for the Lexicon. You will then see the indicator and strategy that you can make available for your personal account. Click on it and select “Open script.” The indicator and/or strategy will be available immediately for you to apply to any chart you wish. The script is also shown below. A sample implementation of the oscillator is shown in Figure 17.
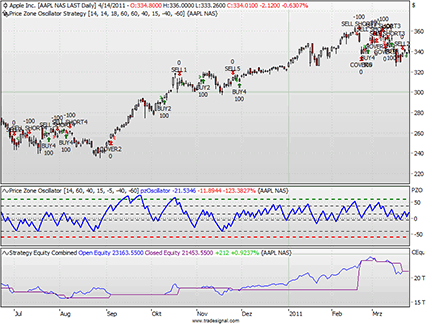
FIGURE 17: TRADESIGNAL, PRICE ZONE OSCILLATOR. Here is the price zone oscillator and strategy on a daily chart of Apple Inc. in Tradesignal Online.
Meta:
	Weblink("https://www.tradesignalonline.com/lexicon/view.aspx?id=16748"),
    Synopsis("Price Zone Oscillator Indicator, based on the article in the 05/2011 issue of Stocks And Commodities. This indicator is useful in uptrends, downtrends or even sideways market conditions. It can be seen as a complement to the Volume Zone Oscillator"),
    ShortCode("PZO"),
    Subchart( True );

Input:
	Period(14),
	Upper_Line_1( 60 , 1 ),
	Upper_Line_2( 40 , 1 ),
	Upper_Line_3( 15 , 1 ),
	Lower_Line_1( -5 , -100 ),
	Lower_Line_2( -40 , -100 ),
	Lower_Line_3( -60 , -100 );

Vars:
	absClose, digitalClose, avgDigitalClose, avgClose, pzOscillator;

absClose = AbsValue(Close);

digitalClose = Sign(Close - Close[1]) * absClose;
avgDigitalClose = XAverage(digitalClose, Period);
avgClose = Xaverage(absClose, Period);

if avgClose <> 0 then
	pzOscillator = 100 * avgDigitalClose / avgClose;

DrawLine( pzOscillator, "pzOscillator", StyleSolid, 2, Blue );
DrawLine( Upper_Line_1, "UL 1", StyleDash, 2, DarkGreen );
DrawLine( Upper_Line_2, "UL 2", StyleDash, 1, Black );
DrawLine( Upper_Line_3, "UL 3", StyleDash, 1, Black );

DrawLine( Lower_Line_1, "LL 1", StyleDash, 1, Black );
DrawLine( Lower_Line_2, "LL 2", StyleDash, 1, Black );
DrawLine( Lower_Line_3, "LL 3", StyleDash, 2, Red );

DrawLine( 0, "Zero", StyleDot, 1, Black );

// *** Copyright tradesignal GmbH ***
// *** www.tradesignal.com ***
Meta:
	Weblink("https://www.tradesignalonline.com/lexicon/view.aspx?id=16748"),
    Synopsis("Price Zone Oscillator Strategy, based on the indicator from the 05/2011 issue of Stocks And Commodities.This strategy is useful in uptrends, downtrends or even sideways market conditions. It can be seen as a complement to the Volume Zone Oscillator."),
    Subchart( False );

Inputs:
	Period_PZO( 14 , 1 ),
	Period_ADX( 14 , 1 ),
	Level_ADX( 18 , 1 ),
	Period_EMA( 60 , 1 ),
	Upper_Line_1( 60 , 1 ),
	Upper_Line_2( 40 , 1 ),
	Upper_Line_3( 15 , 1 ),
	Lower_Line_1( -5 , -100 ),
	Lower_Line_2( -40 , -100 ),
	Lower_Line_3( -60 , -100 );

Vars:
	adxValue, trendFilter, absClose, digitalClose, avgDigitalClose, avgClose,
	pzOscillator, B2_SU(FALSE), S2_SU(FALSE), numMarketPosition;

numMarketPosition = MarketPosition;
absClose = AbsValue(Close);

digitalClose = Sign(Close - Close[1]) * absClose;
avgDigitalClose = XAverage(digitalClose, Period_PZO);
avgClose = Xaverage(absClose, Period_PZO);

if avgClose <> 0 then
	pzOscillator = 100 * avgDigitalClose / avgClose;

adxValue = ADX(Period_ADX);
trendFilter = XAverage(Close, Period_EMA);

if adxValue > Level_ADX then
	begin

		if numMarketPosition <= 0 and Close > trendFilter then
			begin
   				if pzOscillator crosses over Lower_Line_2 then
   					Buy("BUY1")  next bar at market;

   				if pzOscillator crosses over 0 then
   					B2_SU = TRUE;

   				if B2_SU and pzOscillator crosses over Upper_Line_3 then
					Buy("BUY2")  next bar at market;
  			end;

  		if  numMarketPosition > 0 then
  			begin
   				if pzOscillator[1] > Upper_Line_1 and pzOscillator < pzOscillator[1] then
					Sell("SELL1") next bar at market;

   				if Close < trendFilter and pzOscillator < 0 then
					Sell("SELL2") next bar at market;
  			end;

  		if numMarketPosition >= 0 and Close < trendFilter then
  			begin
 				if pzOscillator crosses under Upper_Line_2 then
					Short("SELL SHORT1")  next bar at market;

   				if pzOscillator crosses under 0 then S2_SU = TRUE;

   				if S2_SU and pzOscillator crosses under -5 then
					Short("SELL SHORT2")  next bar at market;
  			end;

  		if  numMarketPosition < 0 then
  			begin
   				if pzOscillator[1] < -60 and pzOscillator > pzOscillator[1] then
					Cover("COVER1") next bar at market;

   				if Close > trendFilter and pzOscillator > 0 then
					Cover("COVER2") next bar at market;
  			end;
	end
else
	begin
		if numMarketPosition <= 0 then
			begin
   				if pzOscillator crosses over Lower_Line_2 then
   					Buy("BUY3")  next bar at market;

   				if pzOscillator crosses over Upper_Line_3 then
   					Buy("BUY4")  next bar at market;
 			 end;

  		if  numMarketPosition > 0 then
  			begin
   				if pzOscillator > Upper_Line_2 then
   					begin
    					if pzOscillator[1] > Upper_Line_1 and pzOscillator < pzOscillator[1] then
    						Sell("SELL3") next bar at market;

    					if Close < trendFilter and pzOscillator < 0 then
							Sell("SELL4") next bar at market;
  					end
  				else If pzOscillator < -5 then
  					Sell("SELL5") next bar at market;
  			end;

  		if numMarketPosition >= 0 then
  			begin
  				if pzOscillator crosses under Upper_Line_2 then
					Short("SELL SHORT3")  next bar at market;

   				if pzOscillator crosses under -5 then
   					Short("SELL SHORT4")  next bar at market;
  			end;

  		if  numMarketPosition < 0 then
  			begin
   				if pzOscillator < -40 then
   					begin
    					if pzOscillator[1] < Lower_Line_3 and pzOscillator > pzOscillator[1] then
    						Cover("COVER3") next bar at market;

    					if Close > trendFilter and pzOscillator > 0 then
							Cover("COVER4") next bar at market;
   					end
   				else if pzOscillator > Upper_Line_3 then
					Cover("COVER5") next bar at market;
  			end;
	end;

if pzOscillator crosses under Upper_Line_3 then
	B2_SU = FALSE;

if pzOscillator crosses over -5 then
	S2_SU = FALSE;

// *** Copyright tradesignal GmbH ***
// *** www.tradesignal.com ***

VT TRADER: PRICE ZONE OSCILLATOR
Our Traders’ Tip this month is based on “Entering The Price Zone” in this issue by Walid Khalil and David Steckler. In this second part of their series, the authors introduce a complementary indicator to their volume zone oscillator (Vzo) called the price zone oscillator (Pzo).
The Pzo uses several overbought and oversold levels (+60, +40, +15, 0, -5, -40, and -60) to help the trader determine whether the price is in a bullish or bearish zone. Khalil and Steckler write that the Pzo is useful in uptrending, downtrending, and even nontrending (ranging/sideways) market conditions and go on to describe four different trading methodologies for utilizing the Pzo in those various market conditions.
The VT Trader instructions for recreating the price zone oscillator are as follows:
- VT Trader’s Ribbon→Technical Analysis menu→Indicators group→Indicators Builder→[New] button
- In the General tab, type the following text into each corresponding text box:
Name: TASC - 06/2011 - Price Zone Oscillator
Function Name Alias: tasc_PZO
Label Mask: TASC - 06/2011 - Price Zone Oscillator (%Periods%) = %PZO%
Placement: New Frame
Data Inspection Alias: Price Zone Osc.
- In the Input Variable(s) tab, create the following variables:
[New] button...
Name: Periods
Display Name: Periods
Type: integer
Default: 14
- In the Output Variable(s) tab, create the following variables:
[New] button...
Var Name: PZO
Name: (PZO)
Line Color: dark blue
Line Width: slightly thicker
Line Type: solid
- In the Horizontal Line tab, create the following horizontal lines:
[New] button...
Value: +60
Line Color: dark red
Line Width: thin
Line Type: dashed

[New] button...
Value: +40
Line Color: red
Line Width: thin
Line Type: dashed

[New] button...
Value: +15
Line Color: red
Line Width: thin
Line Type: dashed

[New] button...
Value: 0
Line Color: black
Line Width: thin
Line Type: dashed

[New] button...
Value: -5
Line Color: red
Line Width: thin
Line Type: dashed

[New] button...
Value: -40
Line Color: red
Line Width: thin
Line Type: dashed

[New] button...
Value: -60
Line Color: dark red
Line Width: thin
Line Type: dashed
- In the Formula tab, copy and paste the following formula:
{Provided By: Capital Market Services, LLC & Visual Trading Systems, LLC} {Copyright: 2011} {Description: TASC, June 2011 - "Entering the Price Zone" by Walid Khalil and David Steckler} {File: tasc_PZO.vtscr - Version 1.0} R:= If(C>Ref(C,-1),C,-C); CP:= Mov(R,Periods,E); TC:= Mov(C,Periods,E); PZO:= 100*(CP/TC); - Click the “Save” icon in the toolbar to finish building the Price Zone Oscillator (PZO).
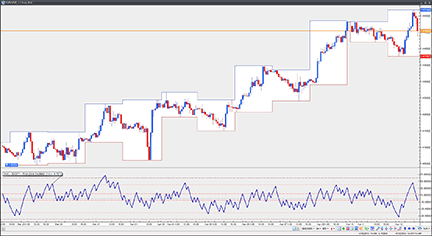
Figure 18: VT TRADER, PRICE ZONE OSCILLATOR. Here is an example of the prize zone oscillator (PZO) on a EUR/USD one-hour candlestick chart.
To attach the indicator to a chart (Figure 18), click the right mouse button within the chart window and then select “Add Indicator”→“TASC — 06/2011 — Price Zone Oscillator” from the indicator list.
We’ll be offering the price zone oscillator (Pzo) for download in our VT client forums at https://forum.vtsystems.com along with hundreds of other precoded and free indicators and trading systems. To learn more about VT Trader, visit www.vtsystems.com.
Risk disclaimer: Forex trading involves a substantial risk of loss and may not be suitable for all investors.
MICROSOFT EXCEL: PRICE ZONE OSCILLATOR
In their article in this issue, “Entering The Price Zone,” authors Walid Khalil and David Steckler extend the concept of the volume zone oscillator (Vzo) that they presented in their May 2011 S&C article, “In The Volume Zone.” With this issue’s article, they extend the concept into the price dimension with a complementary indicator called the price zone oscillator (Pzo).
The Excel spreadsheet I am offering this month is thus built on the foundation of last month’s and allows us to perform visual comparisons of price and indicator action, similar to what is presented in Khalil and Steckler’s article.
I selected the symbol Tlt for this Traders’ Tip so we can approximate the chart that the authors present in Figure 4 of their article in this issue. By comparison, my chart (Figure 19) has a lot more data visible. My chart in Figure 20 is a better approximation of the authors’ Figure 4.
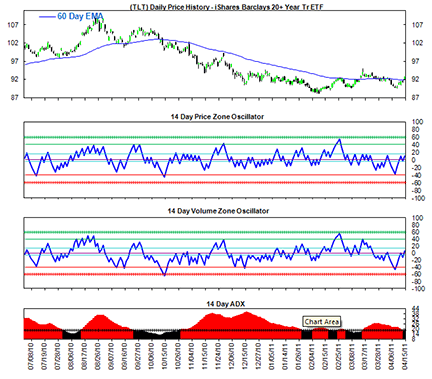
Figure 19: Excel, PRICE ZONE OSCILLATOR. Here is the PZO on a chart of Barclays 20-year Treasury ETF.
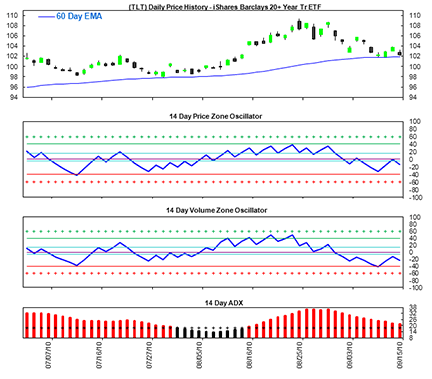
Figure 20: Excel, PRICE ZONE OSCILLATOR. This second attempt is a much better approximation of Walid Khalil and David Steckler’s chart from their article in this issue.
To arrive at a chart similar to Figure 20, set cell A11 to 148 and cell A12 to 53 and click the green button.
For this button to work properly, you will need to enable Vba macro content. You may view the macros after you open the spreadsheet by using Alt-F11 to open the Vba-integrated development environment.
You can download the Excel spreadsheet file here.

PRICE ZONE OSCILLATOR — KHALIL & STECKLER ARTICLE CODE
Price Zone Oscillator

TradeStation:
Input:Period(14);
Vars: MV(0), R(0), VP(0), TV(0), PZO(0);

MV = iff(DataCompression >= 2, AbsValue(Close), Ticks);
R = Sign(Close - Close[1]) * MV;
VP = XAverage(R, Period);
TV = Xaverage(MV, Period);

if TV <> 0 then PZO = 100 * VP / TV;

Plot1(PZO, "PZO");
Plot2(+60, "+60");
Plot3(+40, "+40");
Plot4(+15, "+15");
Plot5(-5, "-5");
Plot6(-40, "-40");
Plot7(-60, "-60");
Plot99(0, "zero");

MetaStock:
Period: =Input("Y" ,2 ,200 ,14 );
R :=If(C>Ref(C,-1),C,-C);
CP :=Mov(R,period ,E);
TC :=Mov(C,period ,E);
PZO :=100*(CP/TC);
PZO
PRICE ZONE OSCILLATOR CODE FOR TRADESTATION
With appreciation to Aapta member Bob Fulks for his invaluable help in coding the Pzo and Vzo strategies for TradeStation.
The articles explain there are three sell (or cover) signals when the Adx is greater than 18. One of these signals is to look for a divergence between price and the Vzo or Pzo. Because determining divergence is part art, part science, this signal was not written into the code.
TradeStation users will see that a buy signal may be followed by a sell short signal, rather than two signals: sell (the buy) and a sell short. Likewise, a sell short signal may be followed by a buy signal, rather than two signals: cover and a buy. TradeStation’s notation system is to show the net position; for example, from -100 shares to +100 shares means cover the 100 shares sold short and then buy 100 shares.
PZO strategy:
Input: PlotMode(1), Price(Close), UsePZO(TRUE);

Vars: xADX(0), xEMA(Price), xVZO(0), xPZO(0), xMax(0), xMin(0),
		B2_SU(FALSE), S2_SU(FALSE), MP(0);

MP = MarketPosition;

xPZO = PZO(14);


xADX = ADX(14);
xEMA = XAverage(Price, 60);

if UsePZO then begin
	xMax = xPZO;
	xMin = xPZO;

end;

if xADX > 18 then begin			// ADX > 18 cases
	if MP <= 0 and Price > xEMA then begin
		if xMax crosses over -40 then Buy("BUY1") next bar at market;
		if xMin crosses over 0 then B2_SU = TRUE;
		if B2_SU and xMax crosses over +15 then Buy("BUY2") next bar at market;
	end;
	if MP > 0 then begin
		if xMax[1] > +60 and xMax < xMax[1] then Sell("SELL1") next bar at market;
		if Price < xEMA and xMin < 0 then Sell("SELL2") next bar at market;
	end;


if MP >= 0 and Price < xEMA then begin
		if xMin crosses under +40 then SellShort("SELL SHORT1") next bar at market;
		if xMax crosses under 0 then S2_SU = TRUE;
		if S2_SU and xMin crosses under -5 then SellShort("SELL SHORT2") next bar at market;
	end;
	if MP < 0 then begin
		if xMin[1] < -60 and xMin > xMin[1] then BuyToCover("COVER1") next bar at market;
		if Price > xEMA and xMax > 0 then BuyToCover("COVER2") next bar at market;
	end;
end else begin						// ADX < 18 cases
	if MP <= 0 then begin
		if xMax crosses over -40 then Buy("BUY3") next bar at market;
		if xMax crosses over +15 then Buy("BUY4") next bar at market;
	end;
	if MP > 0 then begin
		if xMax > +40 then begin
			if xMax[1] > +60 and xMax < xMax[1] then Sell("SELL3") next bar at market;
			if Price < xEMA and xMin < 0 then Sell("SELL4") next bar at market;
		end else
			if xMin < -5 then Sell("SELL5") next bar at market;
	end;
	if MP >= 0 then begin
		if xMin crosses under +40 then SellShort("SELL SHORT3") next bar at market;
		if xMin crosses under -5 then SellShort("SELL SHORT4") next bar at market;
	end;
	if MP < 0 then begin
		if xMin < -40 then begin
			if xMin[1] < -60 and xMin > xMin[1] then BuyToCover("COVER3") next bar at market;
			if Price > xEMA and xMax > 0 then BuyToCover("COVER4") next bar at market;
		end else
			if xMax > +15 then BuyToCover("COVER5") next bar at market;
	end;
end;

if xMin crosses under +15 then B2_SU = FALSE;
if xMax crosses over   -5 then S2_SU = FALSE;

THINKORSWIM.COM: PRICE ZONE OSCILLATOR
“Entering The Price Zone” by Walid Khalil and David Steckler in the June 2011 issue of S&C outlines a new oscillator that investors can use to help identify overbought and oversold levels in a security. The price zone oscillator (Pzo) strategy identifies entry and exit point based on crossovers of major levels along with retracements across those levels.
We have created four strategy files utilizing our proprietary programming language, thinkScript. When applied together, they will provide the signals generated by the authors’ methodology. In addition, we have included a script for the oscillator itself, without generating buy and sell signals on the chart. This script can be used independently of, or alongside, the strategies.
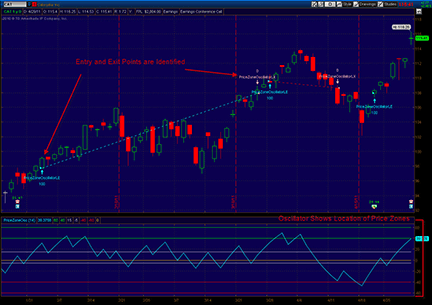
FIGURE 21: THINK OR SWIM PZO sample chart.
The code is shown here along with instructions for applying it.
- From our TOS Charts, Select Studies → Edit Studies
- Select the “Strategies” tab in the upper left-hand corner.
- Select “New” in the lower left-hand corner.
- Name the Long Entry (i.e., PriceZoneOscillatorLE)
- Click in the script editor window, remove “declare LONG_ENTRY” and paste in the following code:
declare LONG_ENTRY;

input length = 14;
input EMALength = 60;

def CP = ExpAverage(Sign(close - close[1]) * close, length);
def TC = ExpAverage(close, length);
def PZO = 100 * CP / TC;

def ADX = ADX(length);
def EMA = ExpAverage(close, EMALength);

def trend = ADX > 18;
def trendUp = trend and close > EMA;
rec below0 = trendUp and (below0[1] or PZO < 0);

addOrder(trendUp and PZO crosses above -40);
addOrder(trendUp and below0 and PZO crosses above 20);
addOrder(!trend and PZO crosses above -40);
addOrder(!trend and PZO crosses above 15);

SetColor(GetColor(1));
- Select OK.
- Select “New” in the lower left-hand corner.
- Name the Short Entry (i.e. PriceZoneOscillatorSE)
- Click in the script editor window, remove “declare LONG_ENTRY” and paste in the following:
declare SHORT_ENTRY;

input length = 14;
input EMALength = 60;

def CP = ExpAverage(Sign(close - close[1]) * close, length);
def TC = ExpAverage(close, length);
def PZO = 100 * CP / TC;

def ADX = ADX(length);
def EMA = ExpAverage(close, EMALength);

def trend = ADX > 18;
def trendDown = trend and close < EMA;
rec above0 = trendDown and (above0[1] or PZO > 0);

addOrder(trendDown and PZO crosses below 40);
addOrder(trendDown and above0 and PZO crosses above -20);
addOrder(!trend and PZO crosses below 40);
addOrder(!trend and PZO crosses below -5);

SetColor(GetColor(2));
- Select OK.
- Select “New” in the lower left-hand corner.
- Name the Long Exit (i.e. PriceZoneOscillatorLX)
- Click in the script editor window, remove “declare LONG_ENTRY” and paste in the following:
declare LONG_EXIT;

input length = 14;
input EMALength = 60;

def CP = ExpAverage(Sign(close - close[1]) * close, length);
def TC = ExpAverage(close, length);
def PZO = 100 * CP / TC;

def ADX = ADX(length);
def EMA = ExpAverage(close, EMALength);

def trend = ADX > 18;
def trendUp = trend and close > EMA;
def sellTrendUp = PZO[1] > 60 and PZO < PZO[1] or
  close < EMA and PZO < 0;
rec above40 = !trend and (above40[1] or PZO > 40);

addOrder(trend and sellTrendUp);
addOrder(!trend and above40 and sellTrendUp);
addOrder(!trend and !above40 and PZO < -5);

SetColor(GetColor(2));
- Select OK.
- Select “New” in the lower left-hand corner.
- Name the Short Exit (i.e., PriceZoneOscillatorSX)
- Click in the script editor window, remove “declare LONG_ENTRY” and paste in the following:
declare SHORT_EXIT;

input length = 14;
input EMALength = 60;

def CP = ExpAverage(Sign(close - close[1]) * close, length);
def TC = ExpAverage(close, length);
def PZO = 100 * CP / TC;

def ADX = ADX(length);
def EMA = ExpAverage(close, EMALength);

def trend = ADX > 18;
def trendDown = trend and close < EMA;
def coverTrendDown = PZO[1] < -60 and PZO > PZO[1] or
  close > EMA and PZO > 0;
rec belowMinus40 = !trend and (belowMinus40[1] or PZO < -40);

addOrder(trend and coverTrendDown);
addOrder(!trend and belowMinus40 and coverTrendDown);
addOrder(!trend and !belowMinus40 and PZO > 15);

SetColor(GetColor(1));
- Select OK.
- (Optional) If you wish to add the oscillator itself, click Studies at the upper-left hand corner of the “Edit Studies and Strategies” window.
- Select “New” in the lower left-hand corner.
- Name the oscillator study (i.e., PriceZoneOsc)
- Click in the script editor window, remove “plot Data = close;” and paste in the following:
declare lower;

input length = 14;

def CP = ExpAverage(Sign(close - close[1]) * close, length); def TC = ExpAverage(close, length);

plot PZO = 100 * CP / TC;
plot "+60" = 60;
plot "+40" = 40;
plot "+15" = 15;
plot "-5" = -5;
plot "-40" = -40;
plot "-60" = -60;
plot ZeroLine = 0;

PZO.SetDefaultColor(GetColor(1));
"+60".SetDefaultColor(GetColor(6));
"+40".SetDefaultColor(GetColor(6));
"+15".SetDefaultColor(GetColor(3));
"-5".SetDefaultColor(GetColor(3));
"-40".SetDefaultColor(GetColor(5));
"-60".SetDefaultColor(GetColor(5));
ZeroLine.SetDefaultColor(GetColor(4));
- Select OK.