TRADING SYSTEMS
Combining Two Indicators
The JK HiLo Index 
No single indicator will accurately forecast or coincide with every market top or bottom. Here, two indicators have been combined to form one indicator that can increase your chances of identifying buy or sell points.
As a student of the market, I have crunched a few numbers over the years. At the same time I have tried, and cautioned others also, to avoid the temptation to divide one number by another or multiply one number by another simply because we can.
Not every calculation involving market indicators enjoys any real purpose. In addition, many indicators react in a manner similar to other indicators. Almost all overbought/oversold indicators tend to get more oversold as the market declines and more overbought as the market rallies. So stringing together more than a handful of similar indicators does not necessarily provide any additional benefit.
Still, when paired together, even similar indicators can be different enough in their construction and interpretation to be useful sometimes. This article details an indicator I have dubbed the “JK HiLo” index (or Jkhl for short).
The starting point: Two high/low indicators
First, I will look at two different indicators that have each proven useful on their own merits and then combine them. For our purposes I will use Nasdaq data rather than Nyse data.

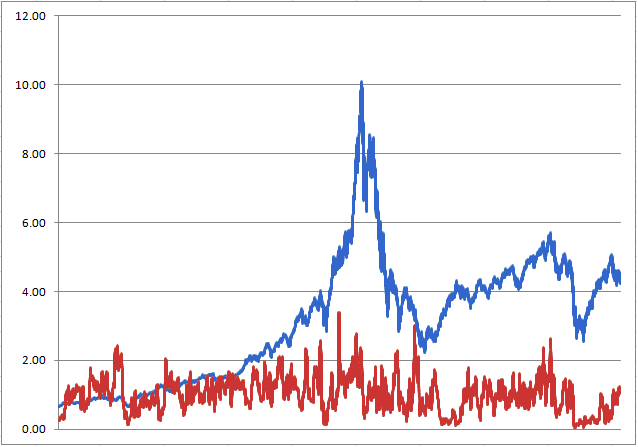
Figure 1: high/low logic index (with nasdaq divided by 500) since 1988. Low high/low logic Index readings tend to coincide with market lows and/or bull markets, while high readings are more indicative of an impending decline.