TRADERS’ TIPS
October 2011
Here is this month’s selection of Traders’ Tips, contributed by various developers of technical analysis software to help readers more easily implement some of the strategies presented in this and other issues.
Other code appearing in articles in this issue is posted in the Subscriber Area of our website at https://technical.traders.com/sub/sublogin.asp. Login requires your last name and subscription number (from mailing label). Once logged in, scroll down to beneath the “Optimized trading systems” area until you see “Code from articles.” From there, code can be copied and pasted into the appropriate technical analysis program so that no retyping of code is required for subscribers.
You can copy these formulas and programs for easy use in your spreadsheet or analysis software. Simply “select” the desired text by highlighting as you would in any word processing program, then use your standard key command for copy or choose “copy” from the browser menu. The copied text can then be “pasted” into any open spreadsheet or other software by selecting an insertion point and executing a paste command. By toggling back and forth between an application window and the open web page, data can be transferred with ease.
This month’s tips include formulas and programs for:
- TRADESTATION: THE JK HILO INDEX
- METASTOCK: THE JK HILO INDEX
- BLOOMBERG: THE JK HILO INDEX
- eSIGNAL: JK HILO INDEX
- WEALTH-LAB: THE JK HILO INDEX
- AMIBROKER: THE JK HILO INDEX
- NEUROSHELL TRADER: THE JK HILO INDEX
- AIQ: THE JK HILO INDEX
- TRADERSSTUDIO: THE JK HILO INDEX
- STRATASEARCH: THE JK HILO INDEX
- OMNITRADER: THE JK HILO INDEX
- NINJATRADER: THE JK HILO INDEX
- UPDATA: THE JK HILO INDEX
- TRADE NAVIGATOR: THE JK HILO INDEX
- WORDEN BROTHERS TC2000: QUICKSORT AND QUICKSCAN
- VT TRADER: MOVING AVERAGE CROSSOVER (MAC) OSCILLATOR
- THE JK HILO INDEX — KAEPPEL ARTICLE CODE

TRADESTATION: THE JK HILO INDEX
In “The JK HiLo Index” in this issue, author Jay Kaeppel suggests the use of the JK HiLo index to help identify overbought and oversold conditions for the Nasdaq market.
The author suggests using the index value along with other confirming indicators or price action to better time market entries. The data used for the index includes the total issues traded on the Nasdaq, the number of new 52-week highs, and the number of new 52-week lows.
Here, we present indicator code for the JK HiLo index. To obtain the numbers required for the calculations, multiple data streams were used in the chart. A workspace is also available for download that has the multiple data streams already set up. If you want to manually set up the chart, Data1 symbol is $Compx, Data2 symbol is $Advq, Data3 symbol is $Declq, Data4 symbol is $Unchq, Data5 symbol is $52Whq, and the Data6 symbol is $52Wlq. After the data streams are inserted, the indicator may be inserted.
To download the EasyLanguage code for the indicators, first navigate to the EasyLanguage Faqs and Reference Posts Topic in the EasyLanguage Support Forum (https://www.tradestation.com/Discussions/Topic.aspx?Topic_ID=47452), scroll down, and click on the link labeled “Traders’ Tips, TASC.” Then select the appropriate link for the month and year. The Eld filename is “_JK HiLo Index.Eld.” Also included is a workspace that includes the chart setup with the multiple data streams and the indicator.
A sample chart is shown in Figure 1.
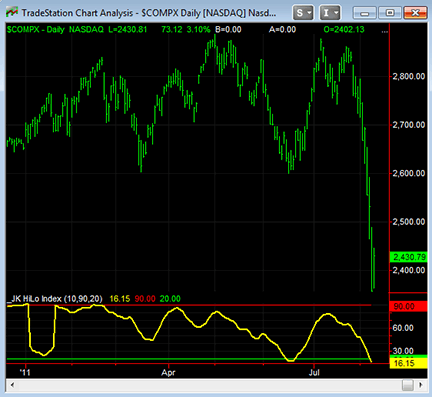
Figure 1: TRADESTATION, the JK HiLo Index. Here is a daily chart of $COMPX (NASDAQ Composite index) with the _JK HiLo index indicator applied. The yellow plot is the index, the red plot is the overbought value, and the green plot is the oversold value.
EasyLanguage code

_JK HiLo Index (Indicator)
{ TASC Article, October, 2011 }
{ The JK HiLo Index by Jay Kaeppel }

inputs:
	AvgLen( 10 ),
         OverBought( 90 ),
	OverSold( 20 ) ;

variables:
	NQTraded( 0 ), { NASDAQ daily total issues traded }
	NQNew52WkH( 0 ), { NASDAQ daily new 52-week highs }
	NQNew52WkL( 0 ), { NASDAQ daily new 52-week lows }
	MinNewHighLow( 0 ), { Lesser of new 52-highs and
	 new 52-week lows }
	MinNewHighLowPct( 0 ),
	HiLoLogicIndex( 0 ), { NASDAQ High/Low Logic
	 Index }
	AdjHiLoLogicIndex( 0 ), { Adjusted High/low Logic
	 Index }
	NewHighPct( 0 ), { New 52-week highs divided by
	 new 52-week highs plus 52-week lows }
	NewHighPctAvg( 0 ), { average of NewHighPct }
	JKHiLoIndex( 0 ) ; { JK HiLo Index }

NQTraded = Close Data2 + Close Data3 + Close Data4 ;
NQNew52WkH = Close Data5 ;
NQNew52WkL = Close Data6 ;

MinNewHighLow = MinList( NQNew52WkH, NQNew52WkL ) ;
MinNewHighLowPct = MinNewHighLow / NQTraded * 100 ;
HiLoLogicIndex = Average( MinNewHighLowPct, AvgLen ) ;

if HiLoLogicIndex >= 2.15
 or HiLoLogicIndex <= 0.40 then
	AdjHiLoLogicIndex = HiLoLogicIndex
else
	AdjHiLoLogicIndex = 1 ;

NewHighPct = NQNew52WkH / ( NQNew52WkH + NQNew52WkL ) ;
NewHighPctAvg = Average( NewHighPct, AvgLen ) ;

JKHiLoIndex = AdjHiLoLogicIndex * NewHighPctAvg * 100 ;

Plot1( JKHiLoIndex, "JKHiLoIndex" ) ;
Plot2( OverBought, "OverBought" ) ;
Plot3( OverSold, "OverSold" ) ;

{ Alerts }
if JKHiLoIndex crosses over OverBought then
	Alert( "JKHiLoIndex cross over " +
	 NumToStr( OverBought, 0 ) ) ;

if JKHiLoIndex crosses under OverSold then
	Alert( "JKHiLoIndex cross under " +
	 NumToStr( OverSold, 0 ) ) ;
This article is for informational purposes. No type of trading or investment recommendation, advice, or strategy is being made, given, or in any manner provided by TradeStation Securities or its affiliates.

METASTOCK: THE JK HILO INDEX
Jay Kaeppel’s article in this issue, “The JK HiLo Index,” explains how to calculate the JK HiLo index (Jkhl). You can add this index to MetaStock using these steps:
- In the Tools menu, select Indicator Builder.
- Click New to open the Indicator Editor for a new indicator.
- Type the name of the indicator.
- Click in the larger window and paste or type in the following formula:
NNH:=Security("C:\MetaStock Data\BM Data\X.NASD-H",C); NNL:=Security("C:\MetaStock Data\BM Data\X.NASD-L",C); ti:= Security("C:\MetaStock Data\BM Data\X.NASD-T",C); r1:= Mov((Min(NNH,NNL)/ti) * 100, 10, S); factor:= If(r1>=2.15 OR r1<=0.40, r1, 1); r2:= Mov(NNH/ti, 10, S); (factor * r2) * 100 - Click OK to close the Indicator Editor.
This formula uses the broad market data installed with MetaStock for Windows. You must be subscribed to the Reuters Datalink index package and have that data current for this indicator to work.
If you wish to use a different data vendor or a different market, you will need to change the first three lines. The security functions point to a specific folder, C:\Metastock Data\ BM Data. They also reference an exact ticker symbol in that folder. You can use any data source that provides new highs, new lows, and total issues traded. Just change the path and ticker symbol information to point to the data you are using.
Some data sources may not have a symbol for total issues traded. In that case, you can add the advancing issues and declining issues to get a good approximation of the total issues traded. It requires adding one more security() function call and changing the definition of the ti variable. This is shown in the following code using the QuoteCenter datafeed. Users of MetaStock Professional will want to use this version of the formula:
ADI:=Security("C:\MetaStock Data\BM Data\us&ADVQ",C);
DCI:=Security("C:\MetaStock Data\BM Data\us&DECQ",C);
NNH:=Security("C:\MetaStock Data\BM Data\us&YHIQ",C);
NNL:=Security("C:\MetaStock Data\BM Data\us&YLOQ",C);
ti:= ADI+DCI;
r1:= Mov((Min(NNH,NNL)/ti) * 100, 10, S);
factor:= If(r1>=2.15 OR r1<=0.40, r1, 1);
r2:= Mov(NNH/ti, 10, S);
(factor * r2) * 100

BLOOMBERG: THE JK HILO INDEX
In his article in this issue, “The JK HiLo Index,” author Jay Kaeppel demonstrates the JK HiLo index (Jkhl) on a weekly Nasdaq Composite Index chart going back to 1988. Meanwhile, the Bloomberg chart in Figure 2 shows the daily Nasdaq Composite Index over the last five years. We chose daily bars and this time period — which covers the bear move from 2007–09 through the present — because of the recent selloff and extreme market volatility that is characterizing the current market environment (as of this writing in early to mid-August).
As you can see in Figure 2, the extreme bear run was preceded by three tops in an extreme overbought range in the JK HiLo index. The first two of these extremes (points 1 and 2) appear to have been early indications of the new highs yet to come, while the third peak (point 3) coincided with the market rally attempting new highs in the last quarter of 2007. Based on the JK HiLo index, the market bottom in November 2008 began a period of extremely oversold conditions that never reached back above oversold until the rally began from the low in March 2009 (point 4). Currently, as of this writing, after some severe selling pressure, the JK HiLo index has reached an oversold level that, while not as extreme as in earlier periods prior to the recent bull run, may be signaling a potential for upward moves in the market (point 5).
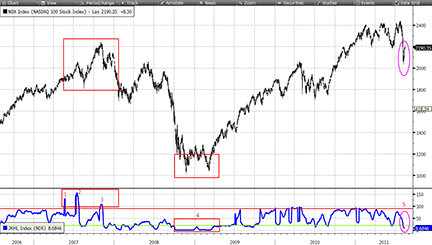
Figure 2: BLOOMBERG, the JK HiLo Index. Here is a daily line chart showing NASDAQ price movement over a five-year period from 2006 to 2011. The study panel underneath shows the JK HiLo index based on the NASDAQ daily total issues traded combined with NASDAQ daily new highs and lows. Annotations on the chart show five corresponding periods in the market and indications of where the JK HiLo index reaches extremely overbought and oversold conditions.
Using the CS.Net framework within the Stdy<GO> function on the Bloomberg Terminal, C# or Visual Basic code can be written to display the JK HiLo index described in Kaeppel’s article. The C# code for this indicator is shown here.
All Bloomberg code contributions to Traders’ Tips can also be found in the sample files provided with regular Sdk updates, and the studies will be included in the Bloomberg global study list.
using System;
using System.Collections.Generic;
using System.Text;
using System.Drawing;
using Bloomberg.Study.API;
using Bloomberg.Study.CoreAPI;
using Bloomberg.Study.Util;
using Bloomberg.Study.TA;
using Bloomberg.Math;

namespace JK_HiLo_Index
{

    public partial class JKHiLoIndex
    {


        private void Initialize()
        {
            // Create a new panel below the chart to output the JK HiLo Index
            Panels.Add("JKHL Panel", new StudyPanel());

            // Create the line for the JK HiLo Index
            Output.Add("JKHL index", new TimeSeries());
            StudyLine jkhl = new StudyLine("JKHL index", Color.Blue);
            jkhl.Style = LineStyle.Solid;
            jkhl.Width = 3;

            // Add output line of indicator to newly created panel
            Panels["JKHL Panel"].Visuals.Add("JKHL index", jkhl);

            // Create horizontal Overbought and Oversold Lines
            StudyHorizontalLine OB = new StudyHorizontalLine(90.0, Color.Red,VisualLineStyle.Solid);
            OB.Width = 2;
            Panels["JKHL Panel"].Visuals.Add("Overbought", OB);

            StudyHorizontalLine OS = new StudyHorizontalLine(20.0, Color.LawnGreen, VisualLineStyle.Solid);
            OS.Width = 2;
            Panels["JKHL Panel"].Visuals.Add("Oversold", OS);

            // Request the data needed for the indicator directly
            DataField total = new DataField("TRADNASD Index", "PX_LAST");
            DataField newhighs = new DataField("NWHLNDHI Index", "PX_LAST");
            DataField newlows = new DataField("NWHLNDLO Index", "PX_LAST");
            Input.Add("NSDQtrded", total);
            Input.Add("NSDQhighs", newhighs);
            Input.Add("NSDQlows", newlows);

        }


        public override void Calculate()
        {
            TimeSeries totaltraded = Input["NSDQtrded"];    // A
            TimeSeries highs = Input["NSDQhighs"];          // B
            TimeSeries lows = Input["NSDQlows"];            // C
            TimeSeries smaller = highs.Lower(lows);         // D
            TimeSeries E = (smaller / totaltraded) * 100;   // E
            TimeSeries MvgAvgofE = Indicator.SMAvg(E, 10);  // F

            TimeSeries G = new TimeSeries(MvgAvgofE.Count); // G
            // Loop to assess and assign value to 'G'
            for (int ii = 0; ii < MvgAvgofE.Count; ii++)
            {
                if (MvgAvgofE[ii] >= 2.15 || MvgAvgofE[ii] <= 0.40)
                    G[ii] = MvgAvgofE[ii];
                else
                    G[ii] = 1;
            }
            TimeSeries H = highs / (highs + lows);          // H
            TimeSeries MvgAvgofH = Indicator.SMAvg(H, 10);  // I
            TimeSeries JKHLI = (G * MvgAvgofH) * 100;       // J

            // Display indicator in previously created panel
            Output.Update("JKHL index", JKHLI);

        }

    }

}

eSIGNAL: JK HILO INDEX
For this month’s Traders’ Tip, we’ve provided the formula “JK_HiLo.efs,” based on Jay Kaeppel’s article in this issue, “The JK HiLo Index.”
The study contains formula parameters to set the index and number of periods, which may be configured through the Edit Chart window.
To discuss this study or download a complete copy of the formula code, please visit the Efs Library Discussion Board forum under the Forums link from the Support menu at www.esignal.com or visit our Efs KnowledgeBase at https://www.esignal.com/support/kb/efs/. The eSignal formula scripts (Efs ) are also available for copying and pasting below, or as a download here.
A sample chart is shown in Figure 3.
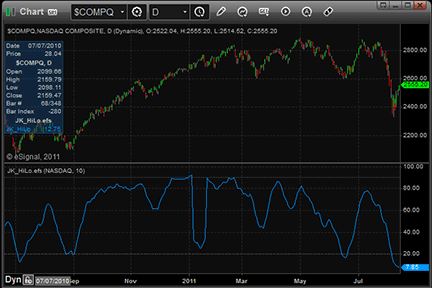
Figure 3: eSIGNAL, the JK HiLo Index
"JK_HiLo.efs"

/*********************************
Provided By:
    Interactive Data Corporation (Copyright © 2011)
    All rights reserved. This sample eSignal Formula Script (EFS)
    is for educational purposes only. Interactive Data Corporation
    reserves the right to modify and overwrite this EFS file with
    each new release.

Description:
    The JK HiLo Index

Version:            1.0  15/08/2011
Formula Parameters:           Default:
Index:                                  NASDAQ
Period:                                 10

Notes:
    The related article is copyrighted material. If you are not
    a subscriber of Stocks & Commodities, please visit www.traders.com.
**********************************/

var bVersion = null;
var fpArray = new Array();
function preMain()
{
    setCursorLabelName("JK_HiLo");

    var x = 0;
    fpArray[x] = new FunctionParameter("gIndex", FunctionParameter.STRING);
    with (fpArray[x++])
    {
            setName("Index");
            addOption("AMEX");
            addOption("NYSE");
            addOption("NASDAQ");
            setDefault("NASDAQ");
    }
    fpArray[x] = new FunctionParameter("gPeriod", FunctionParameter.INTEGER);
    with (fpArray[x++])
    {
            setName("Average Period");
            setDefault(10);
    }
}

var xEH = null;
var xF = null;
var xI = null;
var bInit = false;
function main(gIndex, gPeriod)
{
    if (bVersion == null) bVersion = verify();
    if (bVersion == false) return;
    if (getBarState()==BARSTATE_ALLBARS)
    {
            addBand(20, PS_DOT, 1, Color.grey, "l20");
            addBand(90, PS_DOT, 1, Color.grey, "l90");
    }
    if ( !bInit )
    {
        xEH = efsInternal("calcIndexes", gIndex)
        xF = sma(gPeriod, getSeries(xEH, 0));
        xI = sma(gPeriod, getSeries(xEH, 1));
        bInit = true;
    }
    var vF = xF.getValue(0);
    if ( vF == null ) return;
    var vG = ((vF>=2.15)||(vF<=0.4))? vF : 1;
    var vI = xI.getValue(0);
    return vI*vG*100;
}

function calcIndexes(sIndex)
{
    var xA = 0;
    var xB = 0;
    var xC = 0;
    if ( sIndex == "NASDAQ" )
    {
            vA = close(0, sym("$ACTV.NQ-ST"));
            vB = close(0, sym("$YRHI.NQ-ST"));
            vC = close(0, sym("$YRLO.NQ-ST"));
    }
    if ( sIndex == "NYSE" )
    {
            vA = close(0, sym("$ACTV.NY-ST"));
            vB = close(0, sym("$YRHI.NY-ST"));
            vC = close(0, sym("$YRLO.NY-ST"));
    }
    if ( sIndex == "AMEX" )
    {
            vA = close(0, sym("$ACTV.AM-ST"));
            vB = close(0, sym("$YRHI.AM-ST"));
            vC = close(0, sym("$YRLO.AM-ST"));
    }
    return new Array (100*Math.min(vB, vC)/vA, vB/(vB+vC));
}

function verify() {
    var b = false;
    if (getBuildNumber() < 779) {
        drawTextAbsolute(5, 35, "This study requires version 8.0 or later.",
            Color.white, Color.blue, Text.RELATIVETOBOTTOM|Text.RELATIVETOLEFT|Text.BOLD|Text.LEFT,
            null, 13, "error");
        drawTextAbsolute(5, 20, "Click HERE to upgrade.@URL=https://www.esignal.com/download/default.asp",
            Color.white, Color.blue, Text.RELATIVETOBOTTOM|Text.RELATIVETOLEFT|Text.BOLD|Text.LEFT,
            null, 13, "upgrade");
        return b;
    } else {
        b = true;
    }
    return b;
}

WEALTH-LAB: THE JK HILO INDEX
The JK HiLo index (Jkhl) presented by Jay Kaeppel in his article in this issue synthesizes two market breadth indicators to arrive at a new tool for supporting buy/sell decisions. However, although it’s based on a fairly wide sample of Nasdaq symbols, his original Jkhl formula contains two hard-coded thresholds in its construction that may not necessarily be applicable outside the Nasdaq watchlist. These numbers can become out of sync when applied to other portfolios.
So we wondered, what if we wanted to trade a different universe of stocks? What about futures? What about its applicability to overseas markets?
Given these considerations, we will introduce a tweak to enhance the formula given in the article. Since Wealth-Lab allows users to easily create their own unique market indexes, the code given here focuses on making Jkhl both adaptive and universal enough to capture the breadth of a custom “universe” of symbols, not just the Nasdaq. The idea behind determining the buy and sell thresholds dynamically is based on applying Bollinger Bands with upper and lower boundaries placed two standard deviations above and below a long-term Sma of the Jkhl. Finally, the thresholds based on constants used in the adjusted high/low logic index formula from the article can be replaced with custom values. See Figure 4 for a chart implementation of the Jlhl index.
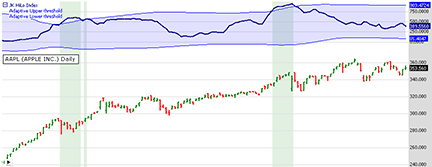
Figure 4: WEALTH-LAB, the JK HiLo Index. Here is a Wealth-Lab Developer 6.2 chart showing the JK HiLo index chart markup applied to a daily chart. The JKHL and its underlying indexes here are built against the S&P 100 stocks using 20-day new highs/lows. Our adaptive thresholds (colored bluish) are constructed using 100-day Bollinger Bands. Selling opportunities are highlighted in green.
Before the Jkhl can be used in Wealth-Lab as an aid in trading systems, several easy steps are required:
- Install the MS123 IndexDefinitions library from the Extensions section of our website www.wealth-lab.com and restart Wealth-Lab.
- In the Index Manager tool, select your favorite DataSet and select “JK HiLo index” from the list of available indexes to recreate the Jkhl. Type in “JKHL” as the index name. As you can see in Figure 5, everything about the Jkhl is made configurable: the new high/low period, the Sma period, and the two thresholds used when building the adjusted high/low logic index.
- Copy and paste in the strategy’s C# code shown here or simply let Wealth-Lab do the job: in the Open Strategy dialog, click “download” to get the strategy code.
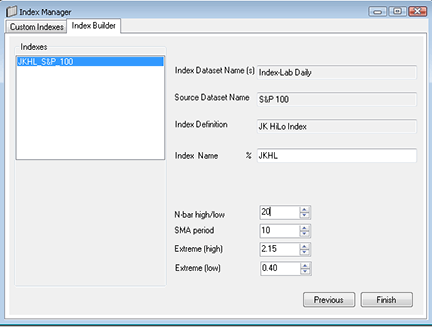
Figure 5: WEALTH-LAB, Index MANAGER. This shows the Index Manager dialog for creating the configurable JKHL index in Wealth-Lab.
C# code:

using System;
using System.Text;
using System.Drawing;
using WealthLab;
using WealthLab.Indicators;

namespace WealthLab.Strategies
{
	public class JKHiLoIndex : WealthScript
	{
		protected override void Execute()
		{
			DataSeries J = GetExternalSymbol("%JKHL",true).Close;
			//Adaptive thresholds for the JK HiLo Index
			BBandUpper bbu = BBandUpper.Series( J, 100, 2.0 );
			BBandLower bbl = BBandLower.Series( J, 100, 2.0 );

			// Plotting JK HiLo Index
			HideVolume();
			ChartPane jPane = CreatePane(45,true,true);
			PlotSeries( jPane, J, Color.DarkBlue, LineStyle.Solid, 2);
			PlotSeriesFillBand( jPane, bbu, bbl, Color.Blue,
				Color.FromArgb( 30, Color.Blue ), LineStyle.Solid, 1 );

			for(int bar = bbu.FirstValidValue; bar < Bars.Count; bar++)
			{
				bool sellZone = J[bar] >= bbu[bar];
				bool buyZone = J[bar] <= bbl[bar];

				if( sellZone )
					SetBackgroundColor( bar, Color.FromArgb( 30, Color.Green ) );
				if( buyZone )
					SetBackgroundColor( bar, Color.FromArgb( 30, Color.Red ) );
			}
		}
	}
}

AMIBROKER: THE JK HILO INDEX
In “The JK HiLo Index” in this issue, author Jay Kaeppel presents a new indicator that is based on market statistics for new lows/new highs.
A ready-to-use JK HiLo index formula for AmiBroker is presented here. To use it, enter the formula in the Afl Editor, then press Insert Indicator. You may need to adjust symbols for Nasdaq new highs/new lows market statistics to match your data source symbology. The formula presented here uses Quotes Plus symbology scheme.
LISTING 1

// you may need to adjust Nasdaq statistics symbols
// to match your data source symbology
AA = Foreign("!NQ-T", "C" ); // Nasdaq Total # of securitiies
BB = Foreign("!NQ-NH", "C" ); // Nasdaq new highs
CC = Foreign("!NQ-NL", "C" ); // Nasdaq new lows

DD = Min( BB, CC );
EE = 100 * DD/AA;
FF = MA( EE, 10 );
GG = IIf( FF >= 2.15 OR FF <= 0.40, FF, 1 );
HH = BB / ( BB + CC );
II = MA( HH, 10 );
JJ = 100 * GG * II;

Plot( JJ, "JK HiLo Index", colorRed );
PlotGrid( 20, colorGreen );
PlotGrid( 90, colorRed );
A sample chart is shown in Figure 6.
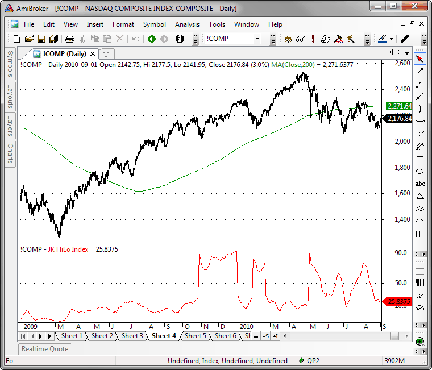
Figure 6: AMIBROKER, the JK HiLo Index. Here is an example of the NASDAQ Composite index price chart (upper pane) with the JK HiLo index (bottom pane).

NEUROSHELL TRADER: THE JK HILO INDEX
The JK HiLo index described by Jay Kaeppel in his article in this issue can be easily implemented with a few of NeuroShell Trader’s 800+ indicators. Simply select “New indicator…” from the Insert menu and use the Indicator Wizard to set up the following indicators:
Indicator1 [High/Low Logic Index]:
MovAvg(Multiply2( Divide( Min2( #NewHighs, #NewLows), #Traded), 100), 10)

Indicator2 [Avg of New Highs / Sum of New Highs & Lows]:
MovAvg(Divide( #NewHighs, Add2( #NewHighs, #NewLows)), 10)

JK HiLo Index:
Multiply3(If (A<B<C(0.40, Indicator1, 2.15), 1, Indicator1), Indicator2, 100)
Users of NeuroShell Trader can go to the Stocks & Commodities section of the NeuroShell Trader free technical support website to download a copy of this or any previous Traders’ Tips.
A sample chart is shown in Figure 7.
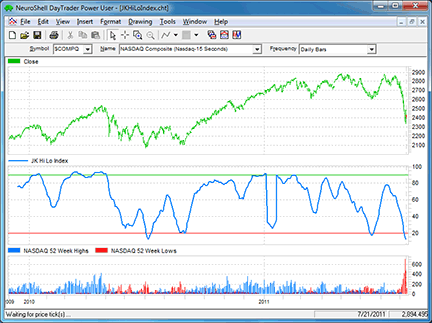
Figure 7: NEUROSHELL TRADER, the JK HiLo Index. Here is the JK HiLo index on a NeuroShell Trader chart.

AIQ: THE JK HILO INDEX
The Aiq code for Jay Kaeppel’s Jkhl indicator discussed in his article in this issue, “The JK HiLo Index,” is shown below and can be downloaded from www.TradersEdgeSystems.com/traderstips.htm.
See Figure 8 for an example of the Jkhl indicator plotted on a chart of the S&P 500.
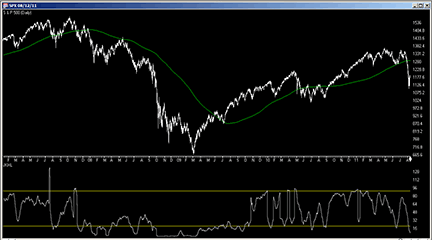
Figure 8: AIQ SYSTEMS, the JK HiLo Index. This chart shows the JKHL indicator on a chart of the S&P 500 index together with a 200-bar moving average.
! THE JK HILO INDEX
! Author: Jay Kaeppel, TASC October 2011
! Coded by: Richard Denning 8/12/2011
! www.TradersEdgeSystems.com

! HIGH-LOW INDICATORS:
! JKlogic:
NewH 	is TickerUDF("OCEXCH",[New Highs]).
NewL 	is TickerUDF("OCEXCH",[New Lows]).
Adv 	is TickerUDF("OCEXCH",[Adv Issues]).
Dec 	is TickerUDF("OCEXCH",[Dec Issues]).
Unch 	is TickerUDF("OCEXCH",[Unch Issues]).
Tot 	is Adv + Dec + Unch.
PctNH	is (NewH / Tot) * 100.
PctNL	is (NewL / Tot) * 100.
HLidx	is min(PctNH,PctNL).
avgHLidx is simpleavg(HLidx,10).

! JK VERSION OF HIGH LOW LOGIC INDICATOR:
JKlogic is iff(avgHLidx > 2.15 or avgHLidx < 0.40,avgHLidx,1).

! JK NEW HIGH PERCENT:
JKnH	is simpleavg(NewH / (NewH + NewL),10).

! COMBINED TWO JK INDICATORS:
!Plot as single line with upper 90 lower 20 support
JKHL 	is JKlogic * JKnH * 100.

TRADERSSTUDIO: THE JK HILO INDEX
The TradersStudio code for Jay Kaeppel’s Jkhl indicator presented in his article in this issue, “The JK HiLo Index,” is provided at the websites noted here. The following code files are provided in the download:
- Function “JKHL” Computes the indicator values
- Indicator Plot “JKHL_IND” For displaying the custom indicator on a session chart
- System “JKHL_SYS” A sample system I created that uses the indicator
The rules of the system that I created to try out the indicator are:
- Enter a long position the next day at market on open when:
- Jkhl indicator is less than the buy level one bar ago, and
- Jkhl is higher today than yesterday
- Exit a long position when:
- After X bars the position is not profitable or
- Jkhl indicator is above the sell level one bar ago, and
- Jkhl is lower today than yesterday.
- Enter a short position the next day at market on open when:
- Jkhl indicator is above the shorting level, and
- Jkhl is lower today than yesterday.
- Exit a short position when:
- After X bars the position is not profitable or
- Jkhl indicator is less than the cover short level one bar ago, and
- Jkhl is higher today than yesterday.
The parameters I used are listed in the system code. I ran the code on the S&P futures contract using data from Pinnacle Data. In Figure 9, I show the resulting logarithmic equity curve. In Figure 10, I show the underwater equity curve using the PctMarginPlan that comes with TradersStudio. I used a tradeplan parameter of 10% of margin to determine the number of contracts to trade on each signal.
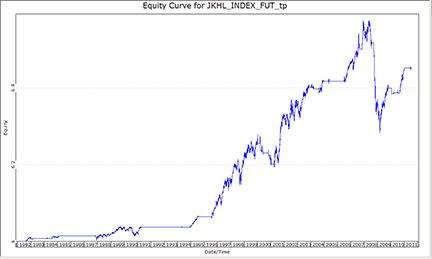
Figure 9: TRADERSSTUDIO, the JK HiLo Index TRADING SYSTEM. Here is a logarithmic equity curve for the sample system that uses the JKHL indicator trading the large S&P 500 futures contract.
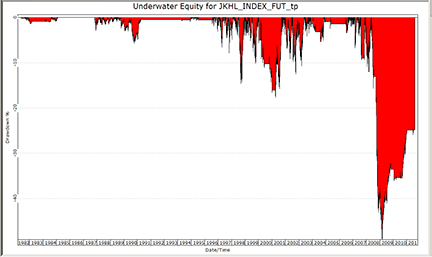
Figure 10: TRADERSSTUDIO, UNDERWATER EQUITY CURVE. Here is the underwater equity curve for the sample system that uses the JKHL indicator trading the large S&P 500 futures contract.
The code can be downloaded from the TradersStudio website at www.TradersStudio.com → Traders Resources → FreeCode or www.TradersEdgeSystems.com/traderstips.htm. The code is also shown here:
' THE JK HILO INDEX
' Author: Jay Kaeppel, TASC October 2011
' Coded by: Richard Denning 8/12/2011

'INDICATOR FUNCTION CODE:
Function JKHL(NAShighs As BarArray, NASlows As BarArray, NASissues As BarArray,upperCO, lowerCO, sLen)
    'Dim buyLevel, sellLevel, maxShortBars
    Dim pctNH, pctNL, HLidx
    Dim newH , newL, totIs
    Dim avgHLidx As BarArray
    Dim JKlogic As BarArray
    Dim JKnH As BarArray

   'set up the following in the session:
    'independent1 = Pinacle data file  "ND-HIGHS.CSV"
    'independent2 = Pinacle data file  "ND-LOWS.CSV"
    'independent3 = Pinacle data file  "ND-TOTIS.CSV"

   'defaults: upperCO=2.15, lowerCO=0.4, smoLen=10

    newH = NAShighs 'C Of independent1
    newL = NASlows  'C Of independent2
    totIs = NASissues 'C Of independent3
    If totIs > 0 Then
        pctNH = (newH / totIs) * 100
        pctNL = (newL / totIs) * 100
    End If
    HLidx = Min(pctNH,pctNL)
    avgHLidx = Average(HLidx,sLen)
    If avgHLidx > upperCO Or avgHLidx < lowerCO Then
        JKlogic = avgHLidx
    Else
        JKlogic = 1
    End If
    If newH + newL <> 0 Then
        JKnH = Average(newH / (newH + newL), sLen)
    Else
        JKnH = JKnH[1]
    End If
    JKHL = JKlogic * JKnH * 100
End Function
'-------------------------------------------------------------------
'INDICATOR PLOT:
Sub JKHL_IND(upperCO, lowerCO, sLen, bLvl, sLvl)
    Dim newH As BarArray
    Dim newL As BarArray
    Dim totIs As BarArray
    Dim myJKHL As BarArray

    'set up the following in the session:
    'independent1 = Pinacle data file  "ND-HIGHS.CSV"
    'independent2 = Pinacle data file  "ND-LOWS.CSV"
    'independent3 = Pinacle data file  "ND-TOTIS.CSV"

   'defaults: upperCO=2.15, lowerCO=0.4, smoLen=10, bLvl=20, sLvl=90
    newH = C Of independent1    'PINNACLE DATA: ND-HIGHS.CSV
    newL = C Of independent2    'PINNACLE DATA: ND-LOWS.CSV
    totIs = C Of independent3   'PINNACLE DATA: ND-TOTIS.CSV

    myJKHL = JKHL(newH,newL,totIs,upperCO,lowerCO,sLen)
    plot1(myJKHL)
    plot2(bLvl)
    plot3(sLvl)
End Sub
'---------------------------------------------------------------------
'SAMPLE SYSTEM (NOT IN ARTICLE):
Sub JKHL_Sys(upperCO,lowerCO,sLen,bLvl,sLvl,ssLvl,cvLvl,beBars)
    Dim newH As BarArray
    Dim newL As BarArray
    Dim totIs As BarArray
    Dim myJKHL As BarArray
    newH = C Of independent1    'PINNACLE DATA: ND-HIGHS.CSV
    newL = C Of independent2    'PINNACLE DATA: ND-LOWS.CSV
    totIs = C Of independent3   'PINNACLE DATA: ND-TOTIS.CSV

    myJKHL = JKHL(newH,newL,totIs,upperCO,lowerCO,sLen)

    'SAMPLE SYSTEM THAT USES THE JKHL INDEX
    'default parameters: uupperCO=2.15, lowerCO=0.4, sLen=10
    '                    bLvl=20, sLvl=90, ssLvl=95, cvLvl=15, beBars=4

    If myJKHL[1] < bLvl And myJKHL > myJKHL[1] Then
        Buy("LE",1,0,Market,Day)
    End If
    If myJKHL[1] > sLvl And myJKHL < myJKHL[1] Then
        ExitLong("LX","",1,0,Market,Day)
    End If
    If marketpos(0) = 1 And BarsSinceEntry > beBars And C < EntryPrice Then
        ExitLong("LX_LOSS","",1,0,Market,Day)
    End If
    If myJKHL[1] > ssLvl And myJKHL < myJKHL[1] Then
        Sell("SE",1,0,Market,Day)
    End If
    If myJKHL[1] < cvLvl And myJKHL > myJKHL[1] Then
        ExitShort("SX","",1,0,Market,Day)
    End If
    If marketpos(0) = -1 And BarsSinceEntry > beBars And C > EntryPrice Then
        ExitShort("SX_LOSS","",1,0,Market,Day)
    End If
End Sub
'----------------------------------------------------------------------------

STRATASEARCH: THE JK HILO INDEX
The article “The JK HiLo Index” by Jay Kaeppel in this issue offers a helpful way to evaluate new highs and new lows, and to use those values in identifying whether it’s a good time to buy or sell. Knowing which direction the market will move as a whole is extremely helpful in identifying when to buy and sell stocks within that market.
Using the Jkhl on its own, we had only limited success. Holding periods were quite long, and there were significant drawdowns on many of the trades. But as the author suggested, the Jkhl should ideally be traded with other confirmation indicators. So we ran a second test using a variety of supporting indicators.
In our second test, we defined the Jkhl as a supporting indicator, and did an automated search using thousands of different primary indicators. This proved to be quite successful, as we found quite a few systems that had high returns and very low drawdowns. In the end, it appears that the Jkhl can be quite effective in some cases, but only when paired with the proper supporting indicators.
StrataSearch users can easily search for supporting indicators for use with the Jkhl by downloading the plugin from the Shared Area of the StrataSearch user forum. After importing the plugin, simply launch the automated search to explore Jkhl alongside thousands of supporting trading rules.
//*********************************************************
// JK HiLo Index
//*********************************************************
A1 = tot("OTC", "Issues");
B1 = nh("OTC");
C1 = nl("OTC");
D1 = lower(B1, C1);
E1 = (D1 / A1) * 100;
F1 = mov(E1, 10, simple);
G1 = if(F1 >= 2.15 or F1 <= 0.40, F1, 1);
H1 = B1 / (B1 + C1);
I1 = mov(H1, 10, simple);
J1 = (G1 * I1) * 100;
JKHL = J1;
A sample chart is shown in Figure 11.
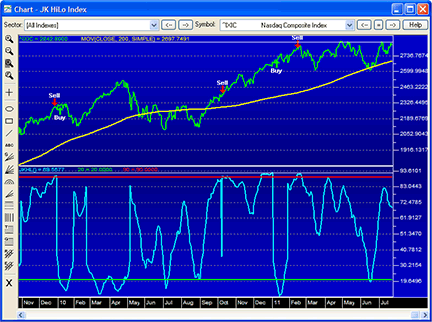
Figure 11: STRATASEARCH, JK HiLo Index. High values of the JKHL, combined with the NASDAQ Composite above its 200-day moving average, produced some successful buy signals.

OMNITRADER: THE JK HILO INDEX
In “The JK HiLo Index” in this issue, author Jay Kaeppel demonstrates a method of combining two breadth indicators to form the Jkhl indicator. The calculation uses the high/low logic index and the new highs/new highs plus new lows indicator. For the sake of completeness, we have included code for all three indicators. The code will work with both OmniTrader and VisualTrader.
To use the software, copy the three files to the Vba folder of your OmniTrader or VisualTrader directory. The next time you start OT or VT, these indicators will be available for use. If desired, the calculations can be modified using the OmniLanguage Ide.
For more information and complete source code, visit https://www.omnitrader.com/ProSI. A sample chart is shown in Figure 12.
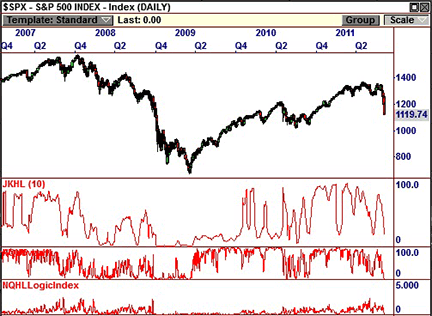
Figure 12: OMNITRADER, the JK HiLo Index. Here is the JK HiLo index plotted alongside the S&P 500.
"JKHL.txt"

'*********************************************************************
'*	NASDAQ JK HiLo Index
'* 		by Jeremy Williams
'*
'*	Adapted from Technical Analysis of Stocks & Commodities
'* 	October 2011
'*
'*	Summary:
'* 		This indicator uses the percentage of new highs or lows
'* 	to predict overbought and oversold conditions. For more information
'*	see "The JK HiLo Index" in the October 2011 Issue of Technical
'*	Analysis of Stocks & Commodities magazine.
'*
'* 	Parameters:
'*
'*	Periods- Specifies the number of periods for the smoothing moving
'*		average
'*
'**********************************************************************

#Indicator

#Param "Periods",10

Dim NewHighs	As Single
Dim NewLows		As Single
Dim TotalIssues As Single
Dim NQLogic		As Single
Dim NQLogicMA	As Single
Dim HoverHL		As Single
Dim HoverHLMA	As Single
Dim Multiplier	As Single
Dim Indicator 	As Single

' Get market breadth indicators
NewHighs = GetClose("$NQ52WH.N")
NewLows = GetClose("$NQ52WL.N")
TotalIssues = GetClose("$NQTI.N")

' Calculate the indicator value
NQLogic = 100*Math.Min(NewHighs,NewLows)/TotalIssues
NQLogicMA = SMA(NQLogic,Periods)
HoverHL = NewHighs/(NewHighs+NewLows)
HoverHLMA = SMA(HoverHL,Periods)

If NQLogicMA >= 2.15 or NQLogicMA <=.40 Then
	Multiplier = NQLogicMA
Else
	Multiplier = 1
End If

Indicator = 100*Multiplier*HoverHLMA

' Plot the indicator
SetScales(0,100)
Plot("HLLogic",Indicator)

' Return the value calculated by the indicator
Return Indicator


"NQHLLogicIndex.txt"

'*********************************************************************
'*	NASDAQ High/Low Logic Indicator
'* 		by Jeremy Williams
'*
'*	Adapted from Technical Analysis of Stocks & Commodities
'* 	October 2011
'*
'*	Summary:
'* 		This indicator uses the percentage of new highs or lows
'* 	to predict overbought and oversold conditions. For more information
'*	see "The JK HiLo Index" in the October 2011 Issue of Technical
'*	Analysis of Stocks & Commodities magazine.
'*
'**********************************************************************

#Indicator

Dim NewHighs	As Single
Dim NewLows		As Single
Dim TotalIssues As Single
Dim Indicator 	As Single

' Get Market Breadth Data
NewHighs = GetClose("$NQ52WH.N")
NewLows = GetClose("$NQ52WL.N")
TotalIssues = GetClose("$NQTI.N")

' Calculate the Indicator
Indicator = 100*Math.Min(NewHighs,NewLows)/TotalIssues

' Plot the Indicator
SetScales(0,5)
Plot("HLLogic",Indicator)

' Return the value calculated by the indicator
Return Indicator


"NQHoverHL.txt"

'*********************************************************************
'*	NASDAQ High/Highs Plus Lows Indicator
'* 		by Jeremy Williams
'*
'*	Adapted from Technical Analysis of Stocks & Commodities
'* 	October 2011
'*
'*	Summary:
'* 		This indicator uses the percentage of new highs or lows
'* 	to predict overbought and oversold conditions. For more information
'*	see "The JK HiLo Index" in the October 2011 Issue of Technical
'*	Analysis of Stocks & Commodities of magazine.
'*
'**********************************************************************

#Indicator

Dim NewHighs	As Single
Dim NewLows		As Single
Dim Indicator 	As Single

' Get Market Breadth Indicators
NewHighs = GetClose("$NQ52WH.N")
NewLows = GetClose("$NQ52WL.N")

' Calculate Value of Indicator
Indicator = 100*NewHighs/(NewHighs+NewLows)

'Plot Indicator
SetScales(0,100)
Plot("HoverHL",Indicator)

' Return the value calculated by the indicator
Return Indicator

NINJATRADER: THE JK HILO INDEX
The JK HiLo indicator, as presented in “The JK HiLo Index” by Jay Kaeppel in this issue, has now been implemented as an indicator available for download at www.ninjatrader.com/SC/October2011SC.zip.
Once it’s been downloaded, from within the NinjaTrader Control Center window, select the menu File → Utilities → Import NinjaScript and select the downloaded file. This indicator is for NinjaTrader version 7 or greater.
You can review the indicator’s source code by selecting the menu Tools → Edit NinjaScript → Indicator from within the NinjaTrader Control Center window and selecting “JKHiLo.”
NinjaScript uses compiled Dlls that run native, not interpreted, which provides you with the highest performance possible.
A sample chart implementing the strategy is shown in Figure 13.
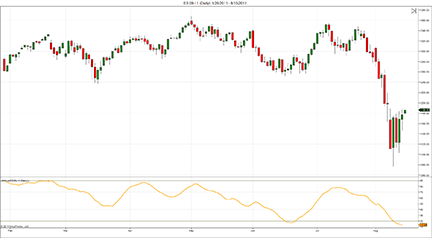
Figure 13: NINJATRADER, the JK HiLo Index. The screenshot shows the JK HiLo indicator applied to a daily chart of the emini S&P 500 September 2011 contract (ES 09-11).

UPDATA: THE JK HILO INDEX
The Traders’ Tip for this month is based on the article in this issue by Jay Kaeppel, “The JK HiLo Index.”
In the article, Kaeppel combines the principles of two referenced indicators to create a market breadth-based oscillator using the number of new highs/lows within an index to time trend reversals.
The Updata code has now been made available in the Updata Library and may be downloaded by clicking the custom menu and then either library. Those who cannot access the library due to a firewall may paste the code below into the Updata custom editor and save it.
A sample chart is shown in Figure 14.
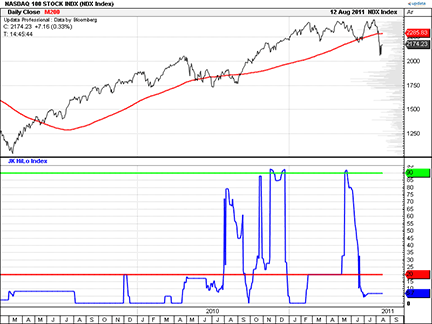
FIGURE 14: UPDATA, the JK HiLo Index. Here is an example of the JK HiLo index applied to the NASDAQ 100 Index. After the recent selloff, this indicator’s low reading would suggest the market is due to perform above average for the next equivalent period.
PARAMETER "Avg. Period" #Period=20
PARAMETER "Period Hi/Lo" #HiLoPeriod=250
PARAMETER "Sell Threshold" @SellThresh=90
PARAMETER "Buy Threshold" @BuyThresh=20
PARAMETER "Choose Watchlist" &MyList=SELECT
NAME "JK HiLo Index" ""
DISPLAYSTYLE 3LINES
PLOTSTYLE THICK2 RGB(10,10,255)
PLOTSTYLE2 THICK2 RGB(10,255,10)
PLOTSTYLE3 THICK2 RGB(255,10,10)
#ShareNumber=0
@PeriodNewHighs=0
@PeriodNewLows=0
@HiLoLogicIndex=0
@AdjHiLoLogicIndex=0
@JKHiLoIndex=0
@HiLoRatioAvg=0

FOR #CURDATE=#Period TO #LASTDATE

@PeriodNewHighs=0
@PeriodNewLows=0

For #ShareNumber=0 to Length(&MyList)-1

if Close(&MyList,#ShareNumber)>Hist(PHigh(Close(&MyList,#ShareNumber),#HiLoPeriod),1)
   @PeriodNewHighs=@PeriodNewHighs+1
endif
if Close(&MyList,#ShareNumber)<Hist(PLow(Close(&MyList,#ShareNumber),#HiLoPeriod),1)
   @PeriodNewLows=@PeriodNewLows+1
endif

Next

@HiLoLogicIndex=Sgnl(100*Min(@PeriodNewHighs,@PeriodNewLows)/Length(&MyList),#Period,M)

If @HiLoLogicIndex>=2.15 OR @HiLoLogicIndex<=0.4
   @AdjHiLoLogicIndex=@HiLoLogicIndex
Else
   @AdjHiLoLogicIndex=1
EndIf

@HiLoRatioAvg=Sgnl(@PeriodNewHighs/(@PeriodNewHighs+@PeriodNewLows),#Period,M)

@JKHiLoIndex=(@AdjHiLoLogicIndex*@HiLoRatioAvg)*100

@Plot=@JKHiLoIndex
@Plot2=@SellThresh
@Plot3=@BuyThresh

NEXT

TRADE NAVIGATOR: THE JK HILO INDEX
Trade Navigator offers everything needed for recreating the indicators discussed in “The JK HiLo Index” by Jay Kaeppel in this issue.
You can recreate these custom indicators and insert them into any Trade Navigator chart by using the TradeSense code and step-by-step instructions shown here.
First, open the Trader’s Toolbox, click on the Functions tab and click the New button. Type in the following code:
&a := Close Of "$advq" + Close Of "$declq"
&b := Close Of "$newhq"
&c := Close Of "$newlq"
&d := Min (&b , &c)
&e := (&d / &a) * 100
&f := MovingAvg (&e , 10)
&g := IFF (&f >= 2.15 Or &f <= 0.40 , &f , 1)
&h := &b / (&b + &c)
&i := MovingAvg (&h , 10)
(&g * &i) * 100
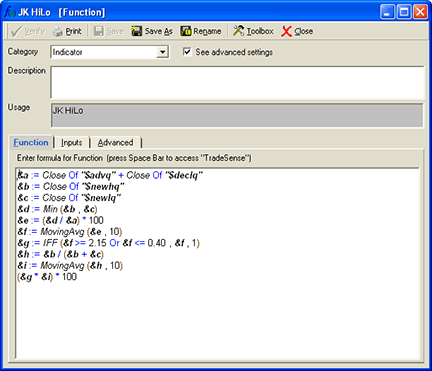
Click the Verify button.
When you are finished, click the Save button, type a name for your new function, and click OK.
Repeat these steps for the JK HiLo Buy Op & JK HiLo Sell Op functions using the following formula for each:
JK HiLo Buy Op
(Close > MovingAvg (Close , 200) And JK HiLo >= 90) Or (Close > MovingAvg (Close , 200) And JK HiLo >= 90)

JK HiLo Sell Op
(Close < MovingAvg (Close , 200) And JK HiLo <= 20) Or (Close > MovingAvg (Close , 200) And JK HiLo <= 20)
Creating the Chart
Because of the versatility of Trade Navigator, now that we have the functions, on a daily chart go to the Add to Chart window by clicking on the chart and typing “A” on the keyboard.
Click on the Indicators tab, find the JK HiLo indicator in the list, and either double-click on it or highlight the name and click the Add button.
Repeat these steps on the HighlightBars tab to add JK HiLo Buy Op and JK HiLo Sell Op.
Highlight each indicator/highlight bar and change it to the desired color in the chart settings window. Click OK
.In the pane with the JK HiLo on the chart, hold the Ctrl key down and click on two places in the pane. Type “E” to go back to the Chart Settings window and locate the two horizontal lines and change the values to 90 for the top one and 20 for the bottom one.
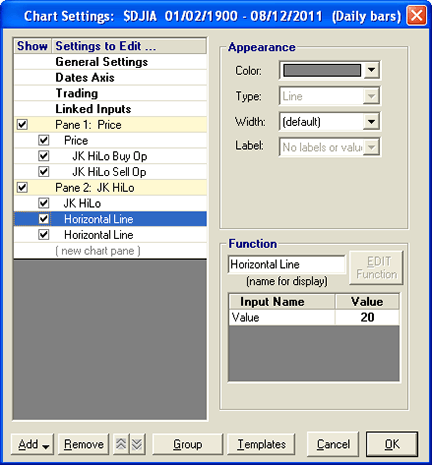
When you have them the way you want to see them, click on the Pane 2: JK HiLo to highlight everything in that pane. Click on the Save Study button. Type “JK HiLo” for the name and type a description if desired. Click Save.
You now have a study that you can add to any chart by typing the hot hey “A” and selecting the study from the Studies tab.
Genesis Financial Technologies has also provided a library called the JK HiLo Index, which includes the study with the custom indicator and the custom highlight bars. You can download a special file named “SC201110” through Trade Navigator to get this library.

WORDEN BROTHERS TC2000: QUICKSORT AND QUICKSCAN
Using QuickSort and QuickScan in TC2000 version 12, you can get results directly from a price plot or from indicators on the chart with only a few clicks.
For example, if you want to find the most active stocks so far today, just click volume on the chart, then click QuickSort. This will generate a watchlist sorted by today’s volume with the most active stocks at the top.
To find stocks crossing up through a 50-day moving average on the chart, click on price, then click “Create condition.” Set the condition to “Crossing Up Moving Average 50,” then click Scan → QuickScan.
To see which stocks are making a new one-year high, click on price, then click “Create condition.” Set the condition to “new high.” For a one-year new high on a daily time frame, set the period to 250, then click Scan → QuickScan.
You can also use QuickScan and QuickSort on intraday charts with TC2000 Platinum. To find stocks crossing up through volume-weighted average price (Vwap) on a one-minute chart, set the time frame on the chart to one minute and add Vwap to the chart by clicking Add Indicator → VWAP. Click on price, then click “Create condition.” Set the condition to “Price crossing up VWAP” and click Scan → QuickScan. Scan results come up in less than a second (Figure 15).
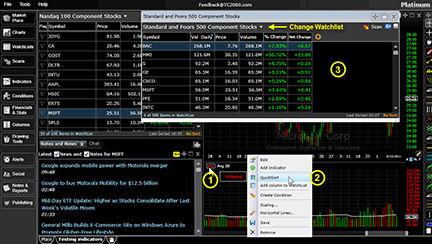
Figure 15: TC2000, QUICKSORT AND QUICKSCAN. To find the most active stocks today, click on volume on the chart (1); click QuickSort (2), and a watchlist window will pop up showing the most active stocks (3). In this example, we’re looking at the most active stocks in the S&P 500. To view the most active in a different list, just click on the watchlist selector to change to a different list.
You can try QuickSort and QuickScan for yourself with a free trial at www.TC2000.com.

VT TRADER: MOVING AVERAGE CROSSOVER (MAC) OSCILLATOR
Our Traders’ Tip this month is based on an article from the March 2009 issue of Stocks & Commodities titled “Second Chance Options” by Barbara Star. In her article, Star describes a short-term trading strategy that combines technical analysis tools such as the moving average crossover (Mac) oscillator, momentum, support/resistance zones, and market retracements with option contracts.
We’ll be focusing on only the Mac oscillator here. The Mac oscillator is a simple yet useful indicator for identifying trends and filtering out some false trend reversals and potential price whipsaws during range-bound periods. The Mac oscillator plots a +1 value while its faster moving average is above its slower moving average and it plots a -1 value. However, the Mac oscillator only plots these +/-1 values while the moving averages are more than 1% apart, making it easier to identify times when the moving averages are in very close proximity to each other and price is potentially range-bound as well those times when the moving averages are diverging away from each other and the price is potentially trending.
We’ll be offering the moving average crossover (Mac) oscillator for download in our VT client forums at https://forum.vtsystems.com along with hundreds of other precoded, free indicators and trading systems.
A sample chart implementation is shown in Figure 16.
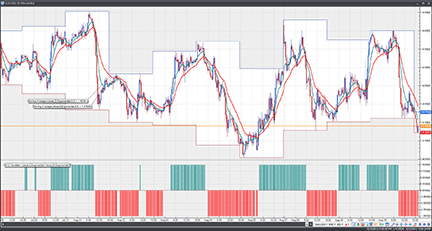
Figure 16: VT TRADER, Moving Average Crossover (MAC) Oscillator. Here is the MAC oscillator on a EUR/USD 30-minute candle chart.
The VT Trader instructions for creating the moving average crossover (Mac) are as follows:
- VT Trader’s Ribbon→Technical Analysis menu→Indicators group→Indicators Builder→[New] button
- In the General tab, type the following text into each corresponding text box:
Name: Moving Average Crossover (MAC) Oscillator
Function Name Alias: tasc_MacOsc
Label Mask: MAC Oscillator (%FastPrice%,%FastPeriods%,%FastType% / %SlowPrice%,%SlowPeriods%,%SlowType%)
Placement: New Frame
Data Inspection Alias: MAC Osc.
- In the Input Variable(s) tab, create the following variables:
[New] button...
Name: FastPrice
Display Name: Fast MA Price
Type: price
Default: close

[New] button...
Name: FastPeriods
Display Name: Fast MA Periods
Type: integer
Default: 8

[New] button...
Name: FastType
Display Name: Fast MA Type
Type: MA Type
Default: Exponential

[New] button...
Name: SlowPrice
Display Name: Slow MA Price
Type: price
Default: close

[New] button...
Name: SlowPeriods
Display Name: Slow MA Periods
Type: integer
Default: 20

[New] button...
Name: SlowType
Display Name: Slow MA Type
Type: MA Type
Default: Exponential

[New] button...
Name: Level
Display Name: Percent Level
Type: float
Default: 0.5
Min. Bounds: 0.01
Max. Bounds: 9999
- In the Output Variable(s) tab, create the following variables:
[New] button...
Var Name: UpTrendMAC
Name: (UpTrend MAC)
Line Color: green
Line Width: 2
Line Type: histogram

[New] button...
Var Name: DownTrendMAC
Name: (DownTrend MAC)
Line Color: red
Line Width: 2
Line Type: histogram
- In the Horizontal Line tab, create the following horizontal lines:
[New] button...
Value: 0
Line Color: black
Line Width: 1
Line Type: dashed
- In the Formula tab, copy and paste the following formula:
{Provided By: Visual Trading Systems, LLC} {Copyright: 2011} {Description: TASC, March 2009 - "Second Chance Options" by Barbara Star, PhD} {File: tasc_MacOsc.vtscr - Version 1.0} {Fast/Slow Moving Averages Oscillator} FastMA:= Mov(FastPrice,FastPeriods,FastType); SlowMA:= Mov(SlowPrice,SlowPeriods,SlowType); MaOsc:= (FastMA-SlowMA)*if(SymbolDigits()=5,1000,10); //normalize output {MAC Oscillator} UpTrendMAC:= If(MaOsc>Level,1,0); DownTrendMAC:= If(MaOsc<-Level,-1,0); - Click the “Save” icon in the toolbar to finish building the MAC oscillator indicator.
To attach the indicator to a chart, click the right mouse button within the chart window and then select “Add Indicator” → “Moving average crossover (MAC) oscillator” from the indicator list.
To learn more about VT Trader, visit www.vtsystems.com.
Risk disclaimer: Forex trading involves a substantial risk of loss and may not be suitable for all investors.

THE JK HILO INDEX (JKHL) - KAEPPEL
ARTICLE CODE
With the JK HiLo index, a number of calculations are involved, but the good news is that it can all be entered into a spreadsheet and recalculated automatically from there. Here are the components:
A = Nasdaq daily total issues traded
B = Nasdaq daily new highs
C = Nasdaq daily new lows
D = Lesser of B and C

E = (D / A) * 100

F = 10-day simple moving average of E

G =If F >=2.15 or if F <= 0.40 then G = F, else G = 1.00

H = B / (B + C)

I = 10-day simple moving average of H

J = (G * I) *100