TRADERS’ TIPS
November 2011
Here is this month’s selection of Traders’ Tips, contributed by various developers of technical analysis software to help readers more easily implement some of the strategies presented in this and other issues.
Other code appearing in articles in this issue is posted in the Subscriber Area of our website at https://technical.traders.com/sub/sublogin.asp. Login requires your last name and subscription number (from mailing label). Once logged in, scroll down to beneath the “Optimized trading systems” area until you see “Code from articles.” From there, code can be copied and pasted into the appropriate technical analysis program so that no retyping of code is required for subscribers.
You can copy these formulas and programs for easy use in your spreadsheet or analysis software. Simply “select” the desired text by highlighting as you would in any word processing program, then use your standard key command for copy or choose “copy” from the browser menu. The copied text can then be “pasted” into any open spreadsheet or other software by selecting an insertion point and executing a paste command. By toggling back and forth between an application window and the open web page, data can be transferred with ease.
This month’s tips include formulas and programs for:
- TRADESTATION: PUT/CALL RATIO INDICATORS
- eSIGNAL: PUT/CALL RATIO INDICATORS
- WEALTH-LAB: PUT/CALL RATIO INDICATORS
- AMIBROKER: PUT/CALL RATIO INDICATORS
- NEUROSHELL TRADER: PUT/CALL RATIO INDICATORS
- AIQ: PUT/CALL RATIO INDICATORS
- TRADERSSTUDIO: PUT/CALL RATIO INDICATORS
- STRATASEARCH: PUT/CALL RATIO INDICATORS
- NINJATRADER: PUT/CALL RATIO INDICATORS
- TRADE NAVIGATOR: PUT/CALL RATIO INDICATORS
- UPDATA: PUT/CALL RATIO INDICATORS
- MICROSOFT EXCEL: PUT/CALL RATIO INDICATORS
- VT TRADER: TRUE RANGE ZONE OSCILLATOR
- METASTOCK — PUT/CALL RATIO INDICATORS — VERVOORT ARTICLE CODE

TRADESTATION: PUT/CALL RATIO INDICATORS
In “Constructing The Put/Call Ratio Indicator” in this issue, author Sylvain Vervoort describes the construction of three indicators: the fast PCRI, the slow PCRI, and the PCRI slow inverse Fisher transform from put/call ratio data. The author suggests using these indicators to analyze the six phases of the price cycle. He mentions in the article that the upcoming third part in the series (this being part 2) will introduce a trading method using these indicators.
Here, we present indicator code for the three indicators. The code uses the put/call ratio (symbol $PCVA) as Data2 in a multiple-datastream chart. If you have data that is not available in the TradeStation platform (such as the data source used by the author), you can use the third-party ASCII-plotting feature in TradeStation (the ASCII data must be inserted as Data2). After the datastreams are configured, the indicators may be inserted.
To download the EasyLanguage code for the indicators, first navigate to the EasyLanguage FAQs and Reference Posts Topic in the EasyLanguage Support Forum (https://www.tradestation.com/Discussions/Topic.aspx?Topic_ID=47452), scroll down, and click on the link labeled “Traders’ Tips, TASC.” Then select the appropriate link for the month and year (November 2011, in this case). The ELD filename is “_Pcri.eld.”
A sample chart is shown in Figure 1.
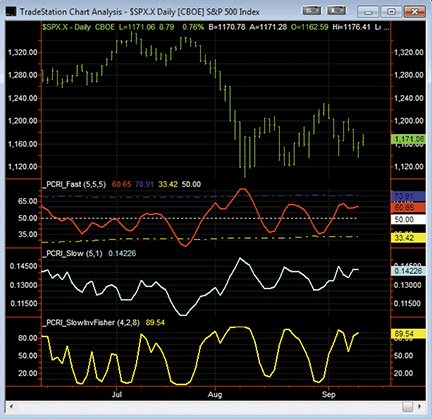
Figure 1: TRADESTATION, PUT/CALL RATIO INDICATORS. Here is a daily chart of $SPX.X with the three indicators described by Sylvain Vervoort applied. Symbol $PCVA is inserted as Data2 (daily bars) but is formatted to be hidden.
_PCRI_Fast (Indicator)
{ TASC Article - Constructing the Put/Call Ratio
  Indicator, November, 2011 }

inputs:
	temav( 5 ), { Length for TEMA on PC }
	rsiper( 5 ), { PC ratio RSI length }
	rsiav( 5 ) ; { PCRI average length }
variables:
	PC( 0, Data2 ),
	PCTema( 0, Data2 ),
	ma( 0, Data2 ),
	rainb( 0, Data2 ),
	RnBw( 0, Data2 ),
	pcri( 0, Data2 ),
    LTAvg( 0, Data2 ),
	UpperBand( 0, Data2 ),
	LowerBand( 0, Data2 ),
    EMA1( 0, Data2 ),
 	EMA2( 0, Data2 ),
	EMA3( 0, Data2 ) ;

if Close of Data2 > 0.9 then
	PC = 0.9
else if Close of Data2 < 0.45 then
	PC = 0.45
else
	PC = Close of Data2 ;

EMA1 = XAverage( PC, temav ) of Data2 ;
EMA2 = XAverage( EMA1, temav ) of Data2 ;
EMA3 = XAverage( EMA2, temav ) of Data2 ;

PCTema = 3 * EMA1 - 3 * EMA2 + EMA3 ;

ma = WAverage( PCTema, 2 ) of Data2 ;
RnBw = ma ;
ma = WAverage( ma, 2 ) of Data2 ;
RnBw = RnBw + ma ;
ma = WAverage( ma, 2 ) of Data2 ;
RnBw = RnBw + ma ;
ma = WAverage( ma, 2 ) of Data2 ;
RnBw = RnBw + ma ;
ma = WAverage( ma, 2 ) of Data2 ;
RnBw = RnBw + ma ;
ma = WAverage( ma, 2 ) of Data2 ;
RnBw = RnBw + ma ;
ma = WAverage( ma, 2 ) of Data2 ;
RnBw = RnBw + ma ;
ma = WAverage( ma, 2 ) of Data2 ;
RnBw = RnBw + ma ;
ma = WAverage( ma, 2 ) of Data2 ;
RnBw = RnBw + ma ;
ma = WAverage( ma, 2 ) of Data2 ;
RnBw = RnBw + ma ;

rainb = RnBw / 10 ;
pcri = WAverage( RSI( rainb, rsiper ) of Data2, rsiav )
	of Data2 ;
LTAvg = Average( pcri, 200 ) of Data2 ;
UpperBand = LTAvg + 1.3 * StdDev( pcri, 200 ) of Data2;
LowerBand = LTAvg - 1.3 * StdDev( pcri, 200 ) of Data2;

Plot1( pcri, "PCRI" ) ;
Plot2( UpperBand, "UpperBand" ) ;
Plot3( LowerBand, "LowerBand" ) ;
Plot4( 50, "50" ) ;


_PCRI_Slow (Indicator)
{ TASC Article - Constructing the Put/Call Ratio
  Indicator, November, 2011 }

inputs:
	mav( 5 ), { PC ratio rainbow average length }
	mova( 1 ) ; { PCRI smoothing length }
variables:
	PC( 0, Data2 ),
	ma( 0, Data2 ),
	RnBw( 0, Data2 ),
	rainb( 0, Data2 ),
	pcri( 0, Data2 ) ;

if Close of Data2 > 0.9 then
	PC = 0.9
else if Close of Data2 < 0.45 then
	PC = 0.45
else
	PC = Close of Data2 ;

ma = WAverage( PC, mav ) of Data2 ;
RnBw = ma ;
ma = WAverage( ma, mav ) of Data2 ;
RnBw = RnBw + ma ;
ma = WAverage( ma, mav ) of Data2 ;
RnBw = RnBw + ma ;
ma = WAverage( ma, mav ) of Data2 ;
RnBw = RnBw + ma ;
ma = WAverage( ma, mav ) of Data2 ;
RnBw = RnBw + ma ;
ma = WAverage( ma, mav ) of Data2 ;
RnBw = RnBw + ma ;
ma = WAverage( ma, mav ) of Data2 ;
RnBw = RnBw + ma ;
ma = WAverage( ma, mav ) of Data2 ;
RnBw = RnBw + ma ;
ma = WAverage( ma, mav ) of Data2 ;
RnBw = RnBw + ma ;
ma = WAverage( ma, mav ) of Data2 ;
RnBw = RnBw + ma ;

rainb = RnBw / 10 ;
pcri = WAverage( rainb, mova ) of Data2 ;

Plot1( pcri, "PCRI" ) ;


_PCRI_SlowInvFisher (Indicator)
{ TASC Article - Constructing the Put/Call Ratio
  Indicator, November, 2011 }

inputs:
	mav( 4 ), { PC Rainbow average length }
	mova( 2 ), { PCRI smoothing length }
	rsiper( 8 ) ; { RSI length }

variables:
	PC( 0, Data2 ),
	ma( 0, Data2 ),
	RnBw( 0, Data2 ),
	rainb( 0, Data2 ),
	pcri( 0, Data2 ),
	x( 0, Data2 ),
	invfish( 0, Data2 ) ;

if Close of Data2 > 0.9 then
	PC = 0.9
else if Close of Data2 < 0.45 then
	PC = 0.45
else
	PC = Close of Data2 ;

ma = WAverage( PC, mav ) of Data2 ;
RnBw = ma ;
ma = WAverage( ma, mav ) of Data2 ;
RnBw = RnBw + ma ;
ma = WAverage( ma, mav ) of Data2 ;
RnBw = RnBw + ma ;
ma = WAverage( ma, mav ) of Data2 ;
RnBw = RnBw + ma ;
ma = WAverage( ma, mav ) of Data2 ;
RnBw = RnBw + ma ;
ma = WAverage( ma, mav ) of Data2 ;
RnBw = RnBw + ma ;
ma = WAverage( ma, mav ) of Data2 ;
RnBw = RnBw + ma ;
ma = WAverage( ma, mav ) of Data2 ;
RnBw = RnBw + ma ;
ma = WAverage( ma, mav ) of Data2 ;
RnBw = RnBw + ma ;
ma = WAverage( ma, mav ) of Data2 ;
RnBw = RnBw + ma ;

rainb = RnBw / 10 ;
pcri = WAverage( rainb, mova ) of Data2 ;

x = 0.1 * ( RSI( pcri, rsiper ) of Data2 - 50 ) ;
invfish = ( ( ExpValue( 2 * x ) - 1 ) /
 ( ExpValue( 2 * x ) + 1 ) + 1 ) * 50 ;

Plot1( invfish, "InvFisher" ) ;
This article is for informational purposes. No type of trading or investment recommendation, advice, or strategy is being made, given, or in any manner provided by TradeStation Securities or its affiliates.

eSIGNAL: PUT/CALL RATIO INDICATORS
For this month’s Traders’ Tip, we’ve provided the formulas fast_PCRI.efs, slow_PCRI.efs (Figure 2), and slow_inverse_PCRI.efs (Figure 3) based on the formula code from Sylvain Vervoort’s article in this issue, “Constructing The Put/Call Ratio Indicator.”
The fast PCRI study contains formula parameters to set the TEMA period, PC ratio RSI period, PCRI indicator period, PC ratio rainbow average period, base period, and offset period.
The slow PCRI study contains formula parameters to set the PCRI period and the PC ratio rainbow average period.
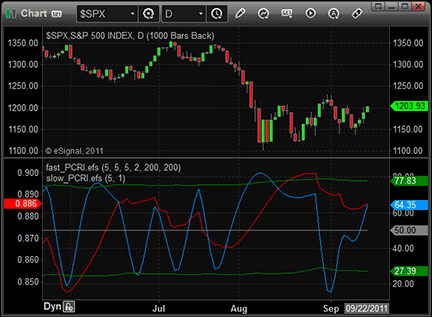
Figure 2: eSIGNAL, Put/Call Ratio Indicators. Here are the fast and slow PCRIs plotted in eSignal.
The slow inverse PCRI study contains formula parameters to set the PCRI period, PC ratio rainbow average period, and RSI period.
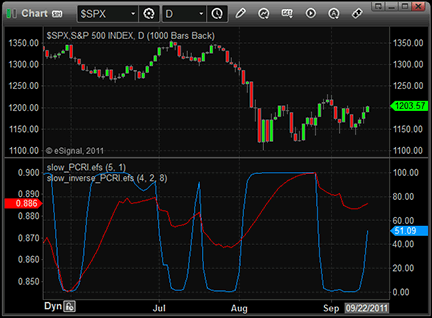
Figure 3: eSIGNAL, slow PCRI inverse. Here is the slow PCRI inverse Fisher transform plotted in eSignal.
Formula parameters may be configured through the Edit Chart window (right-click on chart and select Edit Chart or double-click any indicator).
To discuss this study or download complete copies of the formula code, please visit the EFS Library Discussion Board forum under the Forums link from the Support menu at www.esignal.com or visit our EFS KnowledgeBase at https://www.esignal.com/support/kb/efs/. The eSignal code is also shown below.
FAST_PCRI
/*********************************
Provided By:
    Interactive Data Corporation (Copyright © 2010)
    All rights reserved. This sample eSignal Formula Script (EFS)
    is for educational purposes only. Interactive Data Corporation
    reserves the right to modify and overwrite this EFS file with
    each new release.

Description:
    Fast Put/Call Ratio Indicator

Version:            1.00  15/09/2011

Formula Parameters:                     Default:
TEMA period                             5
PC ratio RSI period                     5
PCRI Indicator Period                   5
PC ratio rainbow average period         2
Base Period                             200
Offset Period                           200


Notes:
    The related article is copyrighted material. If you are not a subscriber
    of Stocks & Commodities, please visit www.traders.com.

**********************************/

// predefined constants
var PCRATIO_LOW = 0.45;
var PCRATIO_HIGH = 0.9;

var fpArray = new Array();

function preMain()
{
    setPriceStudy(false);

    setCursorLabelName("Fast PCRI", 0);
    setCursorLabelName("high", 1);
    setCursorLabelName("low", 2);
    setCursorLabelName("base", 3);

    setDefaultBarFgColor(Color.green, 1);
    setDefaultBarFgColor(Color.green, 2);
    setDefaultBarFgColor(Color.grey, 3);

    setDefaultBarThickness(0, 1);
    setDefaultBarThickness(0, 2);
    setDefaultBarThickness(1, 3);


    var x=0;
    fpArray[x] = new FunctionParameter("temaPeriod", FunctionParameter.NUMBER);
    with(fpArray[x++])
    {
	setName("TEMA Period");
	setLowerLimit(1);
        setUpperLimit(100);
        setDefault(5);
    }

    fpArray[x] = new FunctionParameter("rsiPeriod", FunctionParameter.NUMBER);
    with(fpArray[x++])
    {
	setName("PC Ratio RSI Period");
	setLowerLimit(2);
        setUpperLimit(100);
        setDefault(5);
    }

    fpArray[x] = new FunctionParameter("pcriPeriod", FunctionParameter.NUMBER);
    with(fpArray[x++])
    {
	setName("PCRI Indicator Period");
	setLowerLimit(1);
        setUpperLimit(100);
        setDefault(5);
    }

    fpArray[x] = new FunctionParameter("rainbPeriod", FunctionParameter.NUMBER);
    with(fpArray[x++])
    {
	setName("PC ratio rainbow average period");
	setLowerLimit(1);
        setUpperLimit(10);
        setDefault(2);
    }

    fpArray[x] = new FunctionParameter("basePeriod", FunctionParameter.NUMBER);
    with(fpArray[x++])
    {
	setName("Base Period");
	setLowerLimit(1);
        setUpperLimit(500);
        setDefault(200);
    }

    fpArray[x] = new FunctionParameter("offsetPeriod", FunctionParameter.NUMBER);
    with(fpArray[x++])
    {
	setName("Offset Period");
	setLowerLimit(1);
        setUpperLimit(500);
        setDefault(200);
    }

}

var bInit = false;
var bVersion = null;

var xPCratio = null;
var xPC = null;
var xPCtema = null;
var xRainb = null;
var xPCRI = null;

var xBase = null;
var xOffset = null;
function main(temaPeriod, rsiPeriod, pcriPeriod, rainbPeriod, basePeriod, offsetPeriod)
{
    if (bVersion == null) bVersion = verify();
    if (bVersion == false) return;

    if (!bInit)
    {
        xPCratio = close(sym("$PCCE-ST"));

        xPC = efsInternal("LimitPC", PCRATIO_LOW, PCRATIO_HIGH, xPCratio);

        xPCtema = efsInternal("TEMA", temaPeriod, xPC);

        xRainb = efsInternal("RainbowAverage", rainbPeriod, xPCtema);

        xPCRI = wma(pcriPeriod, rsi(rsiPeriod, xRainb));

        xBase = sma(basePeriod, xPCRI);
        xOffset = efsInternal("MSTD", offsetPeriod, xPCRI);

        bInit = true;
    }

    var vBase = xBase.getValue(0);
    var vOffset = xOffset.getValue(0);

    var lowLine = null;
    var highLine = null;

    if (vBase != null && vOffset != null)
    {
        lowLine = vBase - 1.3 * vOffset;
        highLine = vBase + 1.3 * vOffset;
    }

    var baseLine = 50;

    var vPCRI = xPCRI.getValue(0);

    if (vPCRI == null)
        return null;

    return new Array(vPCRI, highLine, lowLine, baseLine);
}

/*************************************************
             SUPPORT FUNCTIONS
**************************************************/

var bInitRainbow = false;
var xWMA1 = null;
var xWMA2 = null;
var xWMA3 = null;
var xWMA4 = null;
var xWMA5 = null;
var xWMA6 = null;
var xWMA7 = null;
var xWMA8 = null;
var xWMA9 = null;
var xWMA10 = null;

// rainbow averaging technique
function RainbowAverage(period, series)
{
    if (!bInitRainbow)
    {
            xWMA1 = wma(period, series);
            xWMA2 = wma(period, xWMA1);
            xWMA3 = wma(period, xWMA2);
            xWMA4 = wma(period, xWMA3);
            xWMA5 = wma(period, xWMA4);
            xWMA6 = wma(period, xWMA5);
            xWMA7 = wma(period, xWMA6);
            xWMA8 = wma(period, xWMA7);
            xWMA9 = wma(period, xWMA8);
            xWMA10 = wma(period, xWMA9);

            bInitRainbow = true;
    }

    var vWMA1 = xWMA1.getValue(0);
    var vWMA2 = xWMA2.getValue(0);
    var vWMA3 = xWMA3.getValue(0);
    var vWMA4 = xWMA4.getValue(0);
    var vWMA5 = xWMA5.getValue(0);
    var vWMA6 = xWMA6.getValue(0);
    var vWMA7 = xWMA7.getValue(0);
    var vWMA8 = xWMA8.getValue(0);
    var vWMA9 = xWMA9.getValue(0);
    var vWMA10 = xWMA10.getValue(0);

    if (vWMA10 == null)
        return null;

    var nRes = (vWMA1 + vWMA2 + vWMA3 + vWMA4 + vWMA5 + vWMA6 + vWMA7 + vWMA8 + vWMA9 + vWMA10)/10;

    return nRes;
}


// Limited Put/Call ratio
function LimitPC(lowLevel, highLevel, PCratio)
{
    var PCLim = PCratio.getValue(0);

    if (PCLim == null) return null;

    if(PCLim > highLevel)
        PCLim = highLevel;
    else if (PCLim < lowLevel)
        PCLim = lowLevel;

   return PCLim;
}

var bInitTEMA = false;
var xEma1 = null;
var xEma2 = null;
var xEma3 = null;

// Triple Exponential Moving Average
function TEMA(period, series)
{
    if(!bInitTEMA)
    {
        xEma1 = ema(period, series);
        xEma2 = ema(period, xEma1);
        xEma3 = ema(period, xEma2);

        bInitTEMA = true;
    }

    var vEma1 = xEma1.getValue(0);
    var vEma2 = xEma2.getValue(0);
    var vEma3 = xEma3.getValue(0);

    if (vEma3 == null)
        return null;

    return 3 * vEma1 - 3 * vEma2 + vEma3;
}


// Moving Standard Deviation (MSTD)
var aPr = new Array();
var sPr = 0;
var sPr2 = 0;
function MSTD(period, series)
{
        var vPr0 = series.getValue(0);


        if ( getBarState() == BARSTATE_ALLBARS )
        {
            aPr.length = 0;
            sPr = 0;
            sPr2 = 0;
        }

        if ( getBarState() == BARSTATE_NEWBAR )
        {
            if (aPr.length >= period )
            {
                sPr-=aPr[0];
                sPr2-=aPr[0]*aPr[0];
                aPr.shift();
            }
            sPr+=vPr0;
            sPr2+=vPr0*vPr0;
            aPr.push(vPr0);
        }
        if ( getBarState() == BARSTATE_CURRENTBAR )
        {
            sPr-=aPr[aPr.length-1];
            sPr2-=aPr[aPr.length-1]*aPr[aPr.length-1];
            sPr+=vPr0;
            sPr2+=vPr0*vPr0;
            aPr[aPr.length-1] = vPr0;
        }

        var stdDev = null;
        if (aPr.length == period )
        {
            stdDev = Math.sqrt( ( period*sPr2 - sPr*sPr )/( period*( period-1 )) );
        }

        return stdDev;
}


// verify version
function verify() {
    var b = false;
    if (getBuildNumber() < 779) {
        drawTextAbsolute(5, 35, "This study requires version 8.0 or later.",
            Color.white, Color.blue, Text.RELATIVETOBOTTOM|Text.RELATIVETOLEFT|Text.BOLD|Text.LEFT,
            null, 13, "error");
        drawTextAbsolute(5, 20, "Click HERE to upgrade.@URL=https://www.esignal.com/download/default.asp",
            Color.white, Color.blue, Text.RELATIVETOBOTTOM|Text.RELATIVETOLEFT|Text.BOLD|Text.LEFT,
            null, 13, "upgrade");
        return b;
    } else {
        b = true;
    }
    return b;
}
SLOW_PCRI
/*********************************
Provided By:
    Interactive Data Corporation (Copyright © 2010)
    All rights reserved. This sample eSignal Formula Script (EFS)
    is for educational purposes only. Interactive Data Corporation
    reserves the right to modify and overwrite this EFS file with
    each new release.

Description:
    Slow Put/Call Ratio Indicator

Version:            1.00  15/09/2011

Formula Parameters:                     Default:
PC ratio rainbow average period         5
PCRI period                             1

Notes:
    The related article is copyrighted material. If you are not a subscriber
    of Stocks & Commodities, please visit www.traders.com.

**********************************/

// predefined constants
var PCRATIO_LOW = 0.45;
var PCRATIO_HIGH = 0.9;

var fpArray = new Array();

function preMain()
{
    setPriceStudy(false);
    setCursorLabelName("Slow PCRI", 0);

    var x=0;
    fpArray[x] = new FunctionParameter("rainbPeriod", FunctionParameter.NUMBER);
    with(fpArray[x++])
    {
	setName("PC ratio rainbow average period");
	setLowerLimit(1);
        setUpperLimit(10);
        setDefault(5);
    }

    fpArray[x] = new FunctionParameter("pcriPeriod", FunctionParameter.NUMBER);
    with(fpArray[x++])
    {
	setName("PCRI period");
	setLowerLimit(1);
        setUpperLimit(100);
        setDefault(1);
    }
}

var bInit = false;
var bVersion = null;

var xPCratio = null;
var xPC = null;
var xRainb = null;
var xPCRI = null;
function main(rainbPeriod, pcriPeriod)
{
    if (bVersion == null) bVersion = verify();
    if (bVersion == false) return;

    if (!bInit)
    {
        xPCratio = close(sym("$PCCE-ST"));
        xPC = efsInternal("LimitPC",  PCRATIO_LOW, PCRATIO_HIGH, xPCratio);
        xRainb = efsInternal("RainbowAverage", rainbPeriod, xPC);
        xPCRI = wma(pcriPeriod, xRainb);

        bInit = true;
    }

    var vPCRI = xPCRI.getValue(0);

    if (vPCRI == null )
        return null;

    return vPCRI;
}

/*************************************************
             SUPPORT FUNCTIONS
**************************************************/


var bInitRainbow = false;
var xWMA1 = null;
var xWMA2 = null;
var xWMA3 = null;
var xWMA4 = null;
var xWMA5 = null;
var xWMA6 = null;
var xWMA7 = null;
var xWMA8 = null;
var xWMA9 = null;
var xWMA10 = null;

// rainbow averaging technique
function RainbowAverage(period, series)
{
    if (!bInitRainbow)
    {
            xWMA1 = wma(period, series);
            xWMA2 = wma(period, xWMA1);
            xWMA3 = wma(period, xWMA2);
            xWMA4 = wma(period, xWMA3);
            xWMA5 = wma(period, xWMA4);
            xWMA6 = wma(period, xWMA5);
            xWMA7 = wma(period, xWMA6);
            xWMA8 = wma(period, xWMA7);
            xWMA9 = wma(period, xWMA8);
            xWMA10 = wma(period, xWMA9);

            bInitRainbow = true;
    }

    var nRes = 0;
    var vWMA1 = xWMA1.getValue(0);
    var vWMA2 = xWMA2.getValue(0);
    var vWMA3 = xWMA3.getValue(0);
    var vWMA4 = xWMA4.getValue(0);
    var vWMA5 = xWMA5.getValue(0);
    var vWMA6 = xWMA6.getValue(0);
    var vWMA7 = xWMA7.getValue(0);
    var vWMA8 = xWMA8.getValue(0);
    var vWMA9 = xWMA9.getValue(0);
    var vWMA10 = xWMA10.getValue(0);

    if (vWMA10 == null)
        return null;

    nRes = (vWMA1 + vWMA2 + vWMA3 + vWMA4 + vWMA5 + vWMA6 + vWMA7 + vWMA8 + vWMA9 + vWMA10)/10;

    return nRes;
}


// Limited Put/Call ratio
function LimitPC(lowLevel, highLevel, PCratio)
{
    var PCLim = PCratio.getValue(0);

    if (PCLim == null)
        return null;

    if(PCLim > highLevel)
        PCLim = highLevel;
    else if (PCLim < lowLevel)
        PCLim = lowLevel;

   return PCLim;
}

// verify version
function verify() {
    var b = false;
    if (getBuildNumber() < 779) {
        drawTextAbsolute(5, 35, "This study requires version 8.0 or later.",
            Color.white, Color.blue, Text.RELATIVETOBOTTOM|Text.RELATIVETOLEFT|Text.BOLD|Text.LEFT,
            null, 13, "error");
        drawTextAbsolute(5, 20, "Click HERE to upgrade.@URL=https://www.esignal.com/download/default.asp",
            Color.white, Color.blue, Text.RELATIVETOBOTTOM|Text.RELATIVETOLEFT|Text.BOLD|Text.LEFT,
            null, 13, "upgrade");
        return b;
    } else {
        b = true;
    }
    return b;
}
SLOW_INVERSE_PCRI
/*********************************
Provided By:
    Interactive Data Corporation (Copyright © 2010)
    All rights reserved. This sample eSignal Formula Script (EFS)
    is for educational purposes only. Interactive Data Corporation
    reserves the right to modify and overwrite this EFS file with
    each new release.

Description:
    PCRI Slow Inverse Fisher Transform Indicator

Version:            1.00  15/09/2011

Formula Parameters:                     Default:
PC ratio rainbow average period         4
PCRI period                             2
RSI period                              8

Notes:
    The related article is copyrighted material. If you are not a subscriber
    of Stocks & Commodities, please visit www.traders.com.

**********************************/

// predefined constants
var PCRATIO_LOW = 0.45;
var PCRATIO_HIGH = 0.9;

var fpArray = new Array();

function preMain()
{
    setPriceStudy(false);
    setCursorLabelName("Slow PCRI Inverse", 0);

    var x=0;
    fpArray[x] = new FunctionParameter("rainbPeriod", FunctionParameter.NUMBER);
    with(fpArray[x++])
    {
	setName("PC ratio rainbow average period");
	setLowerLimit(1);
        setUpperLimit(10);
        setDefault(4);
    }

    fpArray[x] = new FunctionParameter("pcriPeriod", FunctionParameter.NUMBER);
    with(fpArray[x++])
    {
	setName("PCRI period");
	setLowerLimit(1);
        setUpperLimit(100);
        setDefault(2);
    }


       fpArray[x] = new FunctionParameter("rsiPeriod", FunctionParameter.NUMBER);
    with(fpArray[x++])
    {
	setName("RSI period");
	setLowerLimit(1);
        setUpperLimit(100);
        setDefault(8);
    }
}

var bInit = false;
var bVersion = null;

var xPCratio = null;
var xPC = null;
var xRainb = null;
var xPcri = null;
var xPcriRsi = null;
function main(rainbPeriod, pcriPeriod, rsiPeriod)
{
    if (bVersion == null) bVersion = verify();
    if (bVersion == false) return;

    if (!bInit)
    {
        xPCratio = close(sym("$PCCE-ST"));

        xPC = efsInternal("LimitPC", PCRATIO_LOW, PCRATIO_HIGH, xPCratio);

        xRainb = efsInternal("RainbowAverage", rainbPeriod, xPC);

        xPcri = wma(pcriPeriod, xRainb);

        xPcriRsi = rsi(rsiPeriod, xPcri);

        bInit = true;
    }

    var vPcriRsi = xPcriRsi.getValue(0);

    if(vPcriRsi == null)
        return null;

    var x = 0.1 * (vPcriRsi - 50);

    var invfish = ((Math.exp(2*x)-1)/(Math.exp(2*x)+1)+1)*50;

    return invfish;
}

/*************************************************
             SUPPORT FUNCTIONS
**************************************************/

var bInitRainbow = false;
var xWMA1 = null;
var xWMA2 = null;
var xWMA3 = null;
var xWMA4 = null;
var xWMA5 = null;
var xWMA6 = null;
var xWMA7 = null;
var xWMA8 = null;
var xWMA9 = null;
var xWMA10 = null;

// rainbow averaging technique
function RainbowAverage(period, series)
{
    if (!bInitRainbow)
    {
            xWMA1 = wma(period, series);
            xWMA2 = wma(period, xWMA1);
            xWMA3 = wma(period, xWMA2);
            xWMA4 = wma(period, xWMA3);
            xWMA5 = wma(period, xWMA4);
            xWMA6 = wma(period, xWMA5);
            xWMA7 = wma(period, xWMA6);
            xWMA8 = wma(period, xWMA7);
            xWMA9 = wma(period, xWMA8);
            xWMA10 = wma(period, xWMA9);

            bInitRainbow = true;
    }

    var vWMA1 = xWMA1.getValue(0);
    var vWMA2 = xWMA2.getValue(0);
    var vWMA3 = xWMA3.getValue(0);
    var vWMA4 = xWMA4.getValue(0);
    var vWMA5 = xWMA5.getValue(0);
    var vWMA6 = xWMA6.getValue(0);
    var vWMA7 = xWMA7.getValue(0);
    var vWMA8 = xWMA8.getValue(0);
    var vWMA9 = xWMA9.getValue(0);
    var vWMA10 = xWMA10.getValue(0);

    if (vWMA10 == null)
        return null;

    var nRes = (vWMA1 + vWMA2 + vWMA3 + vWMA4 + vWMA5 + vWMA6 + vWMA7 + vWMA8 + vWMA9 + vWMA10)/10;

    return nRes;
}


// Limited Put/Call ratio
function LimitPC(lowLevel, highLevel, PCratio)
{
    var PCLim = PCratio.getValue(0);

    if (PCLim == null)
        return null;

    if(PCLim > highLevel)
        PCLim = highLevel;
    else if (PCLim < lowLevel)
        PCLim = lowLevel;

   return PCLim;
}

// verify version
function verify() {
    var b = false;
    if (getBuildNumber() < 779) {
        drawTextAbsolute(5, 35, "This study requires version 8.0 or later.",
            Color.white, Color.blue, Text.RELATIVETOBOTTOM|Text.RELATIVETOLEFT|Text.BOLD|Text.LEFT,
            null, 13, "error");
        drawTextAbsolute(5, 20, "Click HERE to upgrade.@URL=https://www.esignal.com/download/default.asp",
            Color.white, Color.blue, Text.RELATIVETOBOTTOM|Text.RELATIVETOLEFT|Text.BOLD|Text.LEFT,
            null, 13, "upgrade");
        return b;
    } else {
        b = true;
    }
    return b;
}

WEALTH-LAB: PUT/CALL RATIO INDICATORS
This Traders’ Tip is based on “Constructing The Put/Call Ratio Indicator” by Sylvain Vervoort in this issue, in which he introduces several put/call ratio indicators (PCRIs).
Wealth-Lab users can install the CBOE Provider extension found at Wealth-Lab.com to easily access and update put/call ratio data directly from the CBOE website. The script simply plots the now-formalized PCRI indicators from our ever-expanding TASCIndicator Library. “TransformSeries” is a routine required only to plot an unscaled version of the slow PCRI in the zero-to-100 oscillator range of the fast PCRI and IFT versions of the indicator.
C# code:

using System;
using System.Collections.Generic;
using System.Text;
using System.Drawing;
using WealthLab;
using WealthLab.Indicators;
using TASCIndicators;

namespace WealthLab.Strategies
{
   public class PutCallRatioIndicator : WealthScript
   {
      StrategyParameter _rsiPeriod;
      StrategyParameter _wmaPeriod;
      StrategyParameter _devs;
      StrategyParameter _slowRainbowPeriod;
      StrategyParameter _wmaSlow;
      StrategyParameter _rsiPer;

      public PutCallRatioIndicator()
      {
         _rsiPeriod = CreateParameter("Fast RSI Period", 5, 2, 30, 1);
         _wmaPeriod = CreateParameter("Fast WMA Period", 5, 2, 10, 1);
         _devs = CreateParameter("SD Multiple", 1.3, 1, 2, 0.1);
         _slowRainbowPeriod = CreateParameter("Slow Rbw Period", 4, 1, 10, 1);
         _wmaSlow = CreateParameter("Slow Smooth Period", 2, 1, 10, 1);
         _rsiPer = CreateParameter("Slow IF RSI Period", 8, 1, 20, 1);
      }


      // Transforms a series for unscaled plotting (translated from WL4 Code Library, Dexter Brunet)
      public DataSeries TransformSeries( DataSeries ds, double a1, double a2, double b1, double b2)
      {
         string sName = ds.Description + "(No Scale)";
         if (Math.Abs(a1 - a2) > 0.00001)
         {
            double a = (b1 - b2)/(a1 - a2);
            double b = (b2 * a1 - a2 * b1)/(a1 - a2);
            DataSeries s = ds * a;
            s += b;
            s.Description = sName;
            return s;
         }
         else
            return ds;
      }

      protected override void Execute()
      {
         // Access the raw P/C Ratio data
         DataSeries pcrEQ = GetExternalSymbol("EQUITYPC", true).Close;

         /* Create and plot indicators */
         HideVolume();
         DataSeries fastPCRI = PCRiFast.Series(pcrEQ, _rsiPeriod.ValueInt, _wmaPeriod.ValueInt);
         DataSeries uBand = BBandUpper.Series(fastPCRI, 200, 1.3);
         DataSeries lBand = BBandLower.Series(fastPCRI, 200, 1.3);
         DataSeries slowPCRI = PCRiSlow.Series(pcrEQ, _slowRainbowPeriod.ValueInt, _wmaSlow.ValueInt);

         ChartPane rsiPane = CreatePane(40, false, true);
         PlotSeries(rsiPane, fastPCRI, Color.Black, LineStyle.Solid, 2);
         PlotSeries(rsiPane, uBand, Color.Blue, LineStyle.Dashed, 1);
         PlotSeries(rsiPane, lBand, Color.Blue, LineStyle.Dashed, 1);

         // Transform slowPCRI for plotting in same pane as fastPCRI
         int n = Bars.Count - 1;
         DataSeries slowT = TransformSeries(slowPCRI, Lowest.Value(n, slowPCRI, n - 30), Highest.Value(n, slowPCRI, n - 30), 0, 100);
         PlotSeries(rsiPane, slowT, Color.Red, LineStyle.Solid, 2);

         DataSeries pcri_IF = PCRiSlowIFT.Series(pcrEQ, _slowRainbowPeriod.ValueInt, _wmaSlow.ValueInt, _rsiPer.ValueInt);
         PlotSeries(rsiPane, pcri_IF, Color.Blue, LineStyle.Solid, 2);

         ChartPane pcPane = CreatePane(40, false, true);
         PlotSeries(pcPane, pcrEQ, Color.Black, LineStyle.Solid, 2, "P/C Ratio (raw, clipped)");
      }
   }
}
A sample chart is shown in Figure 4.
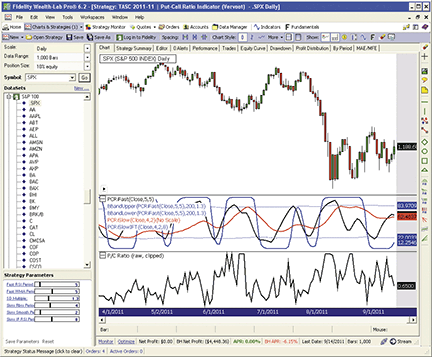
Figure 4: WEALTH-LAB, Put/Call Ratio IndicatorS. Here are plots of the raw but “clipped” P/C ratio data (lower graph) and the three PCRI indicators presented in Sylvain Vervoort’s article in this issue.

AMIBROKER: PUT/CALL RATIO INDICATORS
In “Constructing The Put/Call Ratio Indicator” in this issue, Sylvain Vervoort presents a new indicator that is based on the put/call ratio. We have prepared a ready-to-use fast and slow put-call ratio indicator (PCRI) formula for AmiBroker, shown below. To use it, enter the formula in the AFL Editor, then press “Insert Indicator.” You may need to adjust your symbols for the put/call ratio to match your data source symbology. The AFL formula presented here uses the eSignal symbology scheme.
A sample chart of the PCRI is shown in Figure 5.
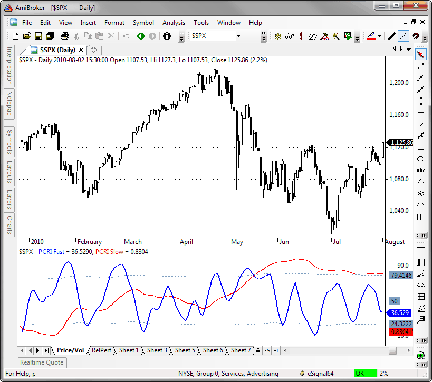
Figure 5: AMIBROKER, Put/Call Ratio IndicatorS. Here is an S&P 500 price chart (upper pane) with the fast and slow PCRI (lower pane).
// Fast and Slow PCRI
PCRatio = Foreign("$PC-ST", "C" );
PCRatio = Min( 0.9, Max( 0.45, PCRatio ) );
temav = Param("TEMA avg PCRatio", 5, 1, 100 );
PCTema = TEMA( PCRatio, temav );
tma = PCTema;
rnbw = 0;

for( i = 0; i < 10; i++ )
{
 tma = WMA( tma, 2 );
 rnbw += tma;
}
rainb = rnbw / 10;
RSIper = Param("PC ratio RSI period", 5, 2, 100 );
RSIav = Param("PCRI Indicator avg", 5, 1, 100 );
pcri = WMA( RSIa( rainb, RSIper ), RSIav );
pcriup = MA( pcri, 200 ) + 1.3 * StDev( pcri, 200 );
pcridn = MA( pcri, 200 ) - 1.3 * StDev( pcri, 200 );

Plot( pcri, "PCRI Fast", colorBlue, styleThick );
Plot( pcriup, "", colorLightBlue, styleDashed );
Plot( pcridn, "", colorLightBlue, styleDashed );
Plot( 50, "", colorLightBlue, styleDashed );
mova = Param("PCRI smoothing", 30, 1, 100 );
Plot( WMA( rainb, mova ), "PCRI Slow", colorRed, styleThick | styleOwnScale );

NEUROSHELL TRADER: PUT/CALL RATIO INDICATORS
The put/call ratio indicators introduced by Sylvain Vervoort in his article in this issue can be easily implemented with a few of NeuroShell Trader’s 800+ indicators. Simply select “New Indicator...” from the Insert menu and use the Indicator Wizard to set up the following indicators:
PCLIMIT
Max2(Min2(PCRatio,0.9).0.45)

Rainbow Average Indicator ( TimeSeries, Bars )
Divide(Add4(Add4( LinWgtAvg(TimeSeries,Bars) ,LinWgtAvg( LinWgtAvg(TimeSeries,Bars), Bars), LinWgtAvg( LinWgtAvg( LinWgtAvg(TimeSeries, Bars), Bars), Bars), LinWgtAvg( LinWgtAvg( LinWgtAvg( LinWgtAvg(TimeSeries, Bars), Bars), Bars), Bars) ), Add4( LinWgtAvg( LinWgtAvg( LinWgtAvg( LinWgtAvg( LinWgtAvg(TimeSeries, Bars), Bars), Bars), Bars), Bars),LinWgtAvg( LinWgtAvg( LinWgtAvg( LinWgtAvg( LinWgtAvg( LinWgtAvg(TimeSeries, Bars), Bars), Bars), Bars), Bars), Bars), LinWgtAvg( LinWgtAvg( LinWgtAvg( LinWgtAvg( LinWgtAvg( LinWgtAvg( LinWgtAvg(TimeSeries, Bars), Bars), Bars), Bars), Bars), Bars), Bars), LinWgtAvg( LinWgtAvg( LinWgtAvg( LinWgtAvg( LinWgtAvg( LinWgtAvg( LinWgtAvg( LinWgtAvg(TimeSeries, Bars), Bars), Bars), Bars), Bars), Bars), Bars), Bars)),LinWgtAvg( LinWgtAvg( LinWgtAvg( LinWgtAvg( LinWgtAvg( LinWgtAvg( LinWgtAvg( LinWgtAvg( LinWgtAvg(TimeSeries, Bars), Bars), Bars), Bars), Bars), Bars), Bars), Bars), Bars),LinWgtAvg( LinWgtAvg( LinWgtAvg( LinWgtAvg( LinWgtAvg( LinWgtAvg( LinWgtAvg( LinWgtAvg( LinWgtAvg( LinWgtAvg(TimeSeries, Bars), Bars), Bars), Bars), Bars), Bars), Bars), Bars), Bars), Bars)), 10)


PCRI FAST
LinWgtAvg(RSI( RainbowAvg(Tema(PCLIMIT, 5),5), 5), 5)

PCRI FAST UPPER & LOWER BANDS
BollingerBandHigh (PCRIFAST, 200, 1.3 )
BollingerBandLow (PCRIFAST, 200, 1.3 )

PCRI SLOW
LinWgtAvg(RainbowAvg(PCLIMIT,5), 1)

EXPX
Exp( Multiply2( 0.2, Subtract( RSI( LinWgtAvg(RainbowAvg(PCLIMIT,4), 2), 8), 50 ) ) )

PCRI SLOW INVERSE FISHER TRANSFORM
Multiply2( Add2( Divide( Subtract( EXPX, 1), Add2(EXPX,1) ) ), 1), 50 )
Note that the fast PCRI is based on the TEMA custom indicator. The TEMA indicator, along with the indicators discussed above, are included in the chart for this Traders’ Tip, which NeuroShell Trader users can download for free from www.ward.net. No programming is required.
A sample chart is shown in Figure 6.
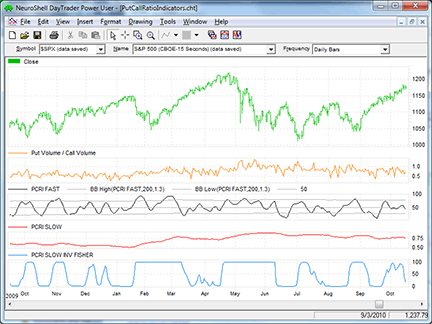
Figure 6: NEUROSHELL TRADER, Put/Call Ratio IndicatorS. Here is a sample NeuroShell Trader chart showing Sylvain Vervoort’s put/call ratio indicators.

AIQ: PUT/CALL RATIO INDICATORS
Here is code for AIQ based on Sylvain Vervoort’s put/call ratio indicators (PCRIs) described in his article in this issue. The code has been modified from the author’s formulas, which used weighted averaging. That type of averaging is not offered in AIQ as a built-in function and had to be coded long-style; the result was very inefficient code that ran too slowly to be of any use. So I modified the formulas by substituting exponential averaging for the weighted averaging. The code now runs fast enough to be useful, and the indicators can be plotted without hanging up the processor.
On my website, I will also provide the code that matches the original formulas for those who want to try it. However, I believe the modified code can produce similar results.
Although the values are not the same as the author’s values when using the same parameters, the resulting shapes of the indicators are similar. Also on my website, I have a “PCratio.dta” data file that can be downloaded and saved into the “C:\wintes32\tdata\” folder. Once the file is saved, go to the Data Manager module and run the utility “Rebuild Master Ticker List” to complete the data file install process.
The three modified PC ratio indicators are shown in Figure 7 on a chart of the S&P 500 index.
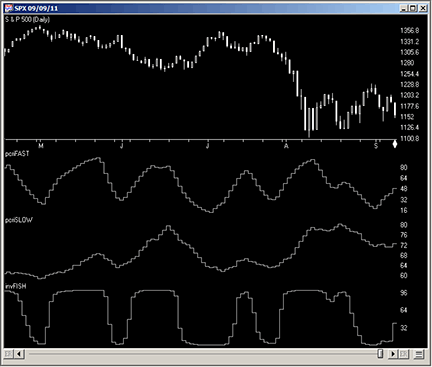
Figure 7: AIQ SYSTEMS, Put/Call Ratio IndicatoRS. Here are Sylvain Vervoort’s three put/call ratio indicators shown on a chart of the S&P 500 index.
The code and EDS file can be downloaded from www.TradersEdgeSystems.com/traderstips.htm and is also shown at below.
AIQ code
!CONSTRUCTING THE PUT/CALL RATIO INDICATOR (MODIFIED VERSION)
!Author: Sylvain Vervoort, TASC November 2011
!Coded by: Richard Denning 9/11/2011

!NOTE: THIS VERSION USES EXPONENTIAL RATHER THAN THE AUTHOR'S WEIGHTED AVERAGING

!INPUTS:
!For pcriFAST Indicator:
	emaF is 2.
	emaFAST	is 5.
	rsiFAST	is 5.
 	movFAST is 5.

!For pcriSLOW Indicator:
	emaS	is 3.
	movSLOW	is 1.

!For invFISH Indicator:
	emaIF	is 2.
	rsiFISH is 8.
	movFISH	is 3.

!FORMULAS COMMON TO ALL THREE INDICATORS:
C 	is [close].
PCR	is tickerUDF("PCratio",C).
PCRA	is iff(PCR > 0.9,0.9,iff(PCR < 0.45,0.45,PCR)).

!FAST PCRI:
EMApc	is expavg(PCRA,emaFAST).
EMA_EMApc is expavg(EMApc,emaFAST).
TEMApc 	is 3*EMApc - 3*EMA_EMApc + expavg(EMA_EMApc,emaFAST).
ma1 	is expavg(TEMApc,emaF).
ma2	is expavg(ma1,emaF).
ma3	is expavg(ma2,emaF).
ma4	is expavg(ma3,emaF).
ma5	is expavg(ma4,emaF).
ma6	is expavg(ma5,emaF).
ma7	is expavg(ma6,emaF).
ma8	is expavg(ma7,emaF).
ma9	is expavg(ma8,emaF).
ma10	is expavg(ma9,emaF).
rainbPC	is (ma1 + ma2 + ma3 + ma4 + ma5 + ma6 + ma7 + ma8 + ma9 + ma10)/10.

!RSI WILDER OF rainbPC:
!To convert Wilder Averaging to Exponential Averaging use this formula:
!ExponentialPeriods = 2 * WilderPeriod - 1.
U 	is rainbPC - valresult(rainbPC,1).
D 	is valresult(rainbPC,1) - rainbPC.
rsiLen1	is 2 * rsiFAST - 1.
AvgU 	is expAvg(iff(U>0,U,0),rsiLen1).
AvgD 	is expAvg(iff(D>=0,D,0),rsiLen1).
rsiPC 	is 100-(100/(1+(AvgU/AvgD))).

pcriFAST is expavg(rsiPC,movFAST). !PLOT AS CUSTOM INDICATOR

sDevPcri is sqrt(variance(pcriFAST,200)).
UPpcri 	is simpleavg(pcriFAST,200) + 1.3*sDevPcri.
DNpcri	is simpleavg(pcriFAST,200) - 1.3*sDevPcri.

!SLOW PCRI:
ma11 	is expavg(PCRA*100,emaS).
ma12	is expavg(ma11,emaS).
ma13	is expavg(ma12,emaS).
ma14	is expavg(ma13,emaS).
ma15	is expavg(ma14,emaS).
ma16	is expavg(ma15,emaS).
ma17	is expavg(ma16,emaS).
ma18	is expavg(ma17,emaS).
ma19	is expavg(ma18,emaS).
ma20	is expavg(ma19,emaS).
rbPCslow is (ma11 + ma12 + ma13 + ma14 + ma15 + ma16 + ma17 + ma18 + ma19 + ma20)/10.
pcriSLOW is expavg(rbPCslow,movSLOW).  !PLOT AS CUSTOM INDICATOR

!iFISH PCRI:
ma21 	is expavg(PCRA*100,emaIF).
ma22	is expavg(ma21,emaIF).
ma23	is expavg(ma22,emaIF).
ma24	is expavg(ma23,emaIF).
ma25	is expavg(ma24,emaIF).
ma26	is expavg(ma25,emaIF).
ma27	is expavg(ma26,emaIF).
ma28	is expavg(ma27,emaIF).
ma29	is expavg(ma28,emaIF).
ma30	is expavg(ma29,emaIF).
rbPCslowF is (ma21 + ma22 + ma23 + ma24 + ma25 + ma26 + ma27 + ma28 + ma29 + ma30)/10.
pcriFISH is expavg(rbPCslowF,movFISH).

!RSI WILDER OF pcriFISH:
!To convert Wilder Averaging to Exponential Averaging use this formula:
!ExponentialPeriods = 2 * WilderPeriod - 1.
UpF 	is pcriFISH - valresult(pcriFISH,1).
DpF 	is valresult(pcriFISH,1) - pcriFISH.
rsiLen2	is 2 * rsiFISH - 1.
AvgUpF 	is expAvg(iff(UpF>0,UpF,0),rsiLen2).
AvgDpF 	is expAvg(iff(DpF>=0,DpF,0),rsiLen2).
rsiF is 100-(100/(1+(AvgUpF/AvgDpF))).

X 	is 0.1*(rsiF-50).

invFISH is ((exp(2*x)-1)/(exp(2*x)+1)+1)*50. !PLOT AS CUSTOM INDICATOR

!REPORT TABS:
FAST 	if symbol() = "PCratio".
SLOW 	if symbol() = "PCratio".
iFISH 	if symbol() = "PCratio".

TRADERSSTUDIO: PUT/CALL RATIO INDICATORS
The TradersStudio code for Sylvain Vervoort’s put/call ratio indicators (PCRIS) from the article “Constructing The Put/Call Ratio Indicator” in this issue is provided at the TradersStudio website and is also shown below. The following code files are provided in the download:
- Function: TEMA computes the TRIX value for input to the fast PCRI
- Function: RainbowMA computes the rainbow moving average for all indicators
- Indicator plot: PCRI_FAST_IND2 for displaying the PCRI_FAST indicator on a chart
- Indicator plot: PCRI_SLOW_IND2 for displaying the PCRI_SLOW indicator on a chart
- Indicator plot: PCRI_FISH_IND2 for displaying the PCRI_IFISH indicator on a chart
- System: PC_RATIO_TEST2 is session code for setting up a session chart (not a system)
In Figure 8, I show the three put/call ratio indicators below a chart of the S&P 500 index. Please note that I have rescaled the slow PCRI indicator by multiplying it by 100 to put it in a similar range of zero to 100.
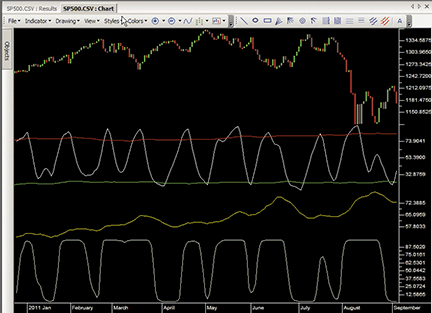
Figure 8: TRADERSSTUDIO, Put/Call Ratio IndicatorS. The three put/call ratio indicators below a chart of the S&P 500 index are shown in this order: fast, slow, iFish.
The TradersStudio code is shown here and can also be downloaded from the TradersStudio website at www.TradersStudio.com → Traders Resources → FreeCode or from www.TradersEdgeSystems.com/traderstips.htm.
TradersStudio code
'CONSTRUCTING THE PUT/CALL RATIO INDICATOR
'Author: Sylvain Vervoort, TASC November 2011
'Coded by: Richard Denning 9/11/2011

Function RainbowMA(Price As BarArray,rbLen,avgLen,AvgType )
    Dim AvgAvgs As BarArray
    Dim AvgVal As BarArray
    Dim AvgArr As Array
    Dim n
    ReDim (AvgArr, 11)

    AvgAvgs = 0
    If AvgType = 1 Then
        AvgArr[1] = Average(Price, avgLen, 0)
        AvgArr[2] = Average(AvgArr[1], avgLen, 0)
        AvgArr[3] = Average(AvgArr[2], avgLen, 0)
        AvgArr[4] = Average(AvgArr[3], avgLen, 0)
        AvgArr[5] = Average(AvgArr[4], avgLen, 0)
        AvgArr[6] = Average(AvgArr[5], avgLen, 0)
        AvgArr[7] = Average(AvgArr[6], avgLen, 0)
        AvgArr[8] = Average(AvgArr[7], avgLen, 0)
        AvgArr[9] = Average(AvgArr[8], avgLen, 0)
        AvgArr[10] = Average(AvgArr[9], avgLen, 0)
    End If
    If AvgType = 2 Then
        AvgArr[1] = WeightedMA(Price, avgLen, 0)
        AvgArr[2] = WeightedMA(AvgArr[1], avgLen, 0)
        AvgArr[3] = WeightedMA(AvgArr[2], avgLen, 0)
        AvgArr[4] = WeightedMA(AvgArr[3], avgLen, 0)
        AvgArr[5] = WeightedMA(AvgArr[4], avgLen, 0)
        AvgArr[6] = WeightedMA(AvgArr[5], avgLen, 0)
        AvgArr[7] = WeightedMA(AvgArr[6], avgLen, 0)
        AvgArr[8] = WeightedMA(AvgArr[7], avgLen, 0)
        AvgArr[9] = WeightedMA(AvgArr[8], avgLen, 0)
        AvgArr[10] = WeightedMA(AvgArr[9], avgLen, 0)
    End If

    For n = 1 To rbLen
        AvgAvgs = AvgAvgs + AvgArr[n]
    Next

    AvgVal = AvgAvgs / rbLen
    RainbowMA = AvgVal
End Function
'------------------------------------------------------------------------------------------
' TRIPPLE EXPONENTIAL MOVING AVERAGE:
Function TEMA(price,temaLen)
    Dim EMA As BarArray
    EMA = XAverage(price, temaLen, 0)
    TEMA = (3 * EMA) - (3 * XAverage(EMA,temaLen)) + (XAverage(XAverage(EMA,temaLen),temaLen))
End Function
'-------------------------------------------------------------------------------------------
Sub PCRI_FAST_IND2()
    Dim rainbowMA1 As BarArray
    Dim PCR As BarArray
    Dim PCRA As BarArray
    Dim TEMApc As BarArray
    Dim RSIpc As BarArray
    Dim pcriFAST As BarArray
    Dim sdevFAST As BarArray
    Dim upFAST As BarArray
    Dim dnFAST As BarArray
    Dim midFAST As BarArray

    PCR = C Of independent1
    PCRA = IIF(PCR > 0.9,0.9,IFF(PCR < 0.45,0.45,PCR))
    TEMApc = TEMA(PCRA,5)
    rainbowMA1 = RainbowMA(TEMApc,10,2,2)
    RSIpc = rsi(rainbowMA1,5,0)
    pcriFAST = weightedMA(RSIpc,5,0)
    sdevFAST = StdDevS(pcriFAST,200)
    midFAST = Average(pcriFAST,200)
    upFAST = midFAST + 1.3*sdevFAST
    dnFAST = midFAST - 1.3*sdevFAST
    Plot1(pcriFAST)
    Plot2(upFAST)
    Plot3(dnFAST)
End Sub
'--------------------------------------------------
Sub PCRI_SLOW_IND2()
    Dim rainbowMA2 As BarArray
    Dim PCR As BarArray
    Dim PCRA As BarArray
    Dim pcriSLOW As BarArray

    PCR = C Of independent1
    PCRA = IIF(PCR > 0.9,0.9,IFF(PCR < 0.45,0.45,PCR))
    rainbowMA2 = RainbowMA(PCRA*100,10,5,2)
    pcriSLOW = weightedMA(rainbowMA2,1,0)
    PLOT1(pcriSLOW)
End Sub
'---------------------------------------------------
Sub PCRI_IFISH_IND2()
    Dim rainbowMA3 As BarArray
    Dim PCR As BarArray
    Dim PCRA As BarArray
    Dim RSIfish As BarArray
    Dim pcriFISH As BarArray
    Dim X As BarArray
    Dim invFISH As BarArray

    PCR = C Of independent1
    PCRA = IIF(PCR > 0.9,0.9,IFF(PCR < 0.45,0.45,PCR))
    rainbowMA3 = RainbowMA(PCRA*100,10,4,2)
    pcriFISH = weightedMA(rainbowMA3,2,0)
    RSIfish = rsi(pcriFISH,8,0)
    X = 0.1 * (RSIfish-50)
    invFISH = ((Exp(2*X)-1) / (Exp(2*X)+1)+1)*50
    PLOT1(invFISH)
End Sub
'----------------------------------------------------

STRATASEARCH: PUT/CALL RATIO INDICATORS
Sylvain Vervoort’s article in this issue, “Constructing The Put/Call Ratio Indicator,” provides an exciting setup for a trading system. All the pieces are in place, and we’ve been given a few clues as to how the trading system will be used, but we still need to wait till next month’s follow-up article to turn these indicators into a complete trading system.
In the meantime, we did some experimentation based on the clues the author provided, and were able to come up with some promising results. Using the put/call ratio indicator (PCRI) as a market filter, and combining that filter with rules that identify when to buy and sell the individual stocks within the market, we were able to find systems with high returns, low drawdowns, and relatively short holding periods. It will be interesting to see the complete system in next month’s issue.
StrataSearch users wishing to explore these indicators now, including the experimental rules we created, can download a plugin from the Shared Area of the StrataSearch user forum. After installing the plugin, users can run an automated search for trading systems, identifying the best combinations of indicators for use alongside the put/call ratio indicator.
A sample chart is shown in Figure 9.
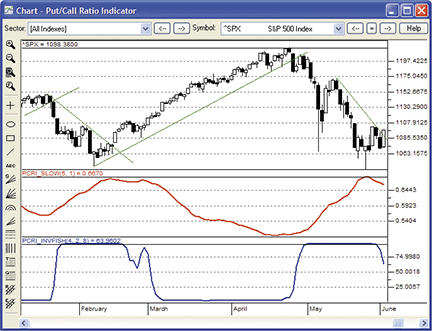
Figure 9: STRATASEARCH, Put/Call Ratio IndicatorS. Tops and bottoms in the slow PCRI (red line) are confirmed by extreme highs and lows in the PCRI inverse Fisher transform (blue line).
//*********************************************************
// PCRI Fast
//*********************************************************
temav = parameter("TEMA Average");
rsiper = parameter("RSI Period");
rsiav = parameter("PCRI Average");
PCratio = symbol(PCEQ, close);
PC=If(PCratio>.9,.9,If(PCratio<.45,.45,PCratio));
PCtema=Tema(PC,temav);
ma= Mov(PCtema,2,W); RnBw=ma;
ma= Mov(ma,2,W); RnBw=RnBw+ma;
ma= Mov(ma,2,W); RnBw=RnBw+ma;
ma= Mov(ma,2,W); RnBw=RnBw+ma;
ma= Mov(ma,2,W); RnBw=RnBw+ma;
ma= Mov(ma,2,W); RnBw=RnBw+ma;
ma= Mov(ma,2,W); RnBw=RnBw+ma;
ma= Mov(ma,2,W); RnBw=RnBw+ma;
ma= Mov(ma,2,W); RnBw=RnBw+ma;
ma= Mov(ma,2,W); RnBw=RnBw+ma;
rainb= RnBw/10;
PCRI_Fast=Mov(RSI2(rainb,rsiper),rsiav,W);

//*********************************************************
// PCRI Slow
//*********************************************************
mav = parameter("Rainbow Average");
mova = parameter("PCRI Smoothing");
PCratio = symbol(PCEQ, close);
PC=If(PCratio>.9,.9,If(PCratio<.45,.45,PCratio));
ma= Mov(PC,mav,W); RnBw=ma;
ma= Mov(ma,mav,W); RnBw=RnBw+ma;
ma= Mov(ma,mav,W); RnBw=RnBw+ma;
ma= Mov(ma,mav,W); RnBw=RnBw+ma;
ma= Mov(ma,mav,W); RnBw=RnBw+ma;
ma= Mov(ma,mav,W); RnBw=RnBw+ma;
ma= Mov(ma,mav,W); RnBw=RnBw+ma;
ma= Mov(ma,mav,W); RnBw=RnBw+ma;
ma= Mov(ma,mav,W); RnBw=RnBw+ma;
ma= Mov(ma,mav,W); RnBw=RnBw+ma;
rainb= RnBw/10;
PCRI_Slow=Mov(rainb,mova,W);

//*********************************************************
// PCRI Slow Inverse Fisher Transform
//*********************************************************
mav = parameter("Rainbow Average");
mova =parameter("PCRI Smoothing");
rsiper=parameter("RSI Period");
PCratio = symbol(PCEQ, close);
PC=If(PCratio>.9,.9,If(PCratio<.45,.45,PCratio));
ma= Mov(PC,mav,W); RnBw=ma;
ma= Mov(ma,mav,W); RnBw=RnBw+ma;
ma= Mov(ma,mav,W); RnBw=RnBw+ma;
ma= Mov(ma,mav,W); RnBw=RnBw+ma;
ma= Mov(ma,mav,W); RnBw=RnBw+ma;
ma= Mov(ma,mav,W); RnBw=RnBw+ma;
ma= Mov(ma,mav,W); RnBw=RnBw+ma;
ma= Mov(ma,mav,W); RnBw=RnBw+ma;
ma= Mov(ma,mav,W); RnBw=RnBw+ma;
ma= Mov(ma,mav,W); RnBw=RnBw+ma;
rainb= RnBw/10;
pcri=Mov(rainb,mova,W);
x= .1*(RSI2(pcri,rsiper)-50);
PCRI_Invfish=((Exp(2*x)-1)/(Exp(2*x)+1)+1)*50;

NINJATRADER: PUT/CALL RATIO INDICATORS
The fast and slow put/call ratio indicators (PCRIs) introduced in Sylvain Vervoort’s article in this issue, “Constructing The Put/Call Ratio Indicator,” have now been implemented as indicators available for download at www.ninjatrader.com/SC/November2011SC.zip.
Once you have the indicators downloaded, from within the NinjaTrader Control Center window, select the menu File→Utilities→Import NinjaScript and select the downloaded file. This indicator is for NinjaTrader version 7 or greater.
You can review the indicator source code by selecting the menu Tools→Edit NinjaScript→Indicator from within the NinjaTrader Control Center window and selecting either “PCRIFast” or “PCRISlow.”
NinjaScript uses compiled DLLs that run native, not interpreted, to provide the highest performance possible.
A sample chart implementing the strategy is shown in Figure 10.
Figure 10: NINJATRADER, Put/Call Ratio IndicatorS. This chart shows the PCRIFast and PCRISlow indicators applied to a daily chart of the S&P 500 index (∧SP500).

TRADE NAVIGATOR: PUT/CALL RATIO INDICATORS
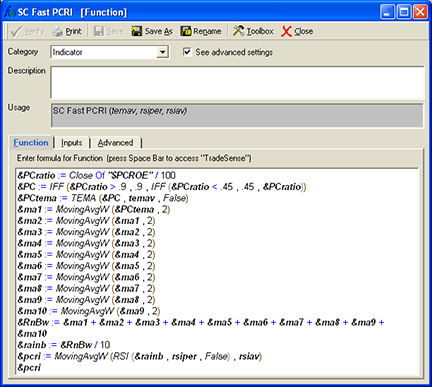
Trade Navigator users can use the TradeSense programming language to recreate the indicators introduced in Sylvain Vervoort’s article in this issue, “Constructing The Put/Call Ratio Indicator.” The TradeSense code and step-by-step instructions are shown here.
First, open the Trader’s Toolbox, click on the Functions tab and click the New button.
SC Fast PCRI
Type in the following code:
&PCratio := Close Of "$PCROE" / 100
&PC := IFF (&PCratio > .9 , .9 , IFF (&PCratio < .45 , .45 , &PCratio))
&PCtema := TEMA (&PC , temav , False)
&ma1 := MovingAvgW (&PCtema , 2)
&ma2 := MovingAvgW (&ma1 , 2)
&ma3 := MovingAvgW (&ma2 , 2)
&ma4 := MovingAvgW (&ma3 , 2)
&ma5 := MovingAvgW (&ma4 , 2)
&ma6 := MovingAvgW (&ma5 , 2)
&ma7 := MovingAvgW (&ma6 , 2)
&ma8 := MovingAvgW (&ma7 , 2)
&ma9 := MovingAvgW (&ma8 , 2)
&ma10 := MovingAvgW (&ma9 , 2)
&RnBw := &ma1 + &ma2 + &ma3 + &ma4 + &ma5 + &ma6 + &ma7 + &ma8 + &ma9 + &ma10
&rainb := &RnBw / 10
&pcri := MovingAvgW (RSI (&rainb , rsiper , False) , rsiav)
&pcri
TRADE NAVIGATOR: Creating a function
Click the Verify button. When the Add Inputs window pops up, click the Add button. Set the following values:
temav = 5
rsiper = 5
rsiav = 5
For the SC Fast PCRI & SC Slow PCRI functions, go to the Advanced tab and uncheck the Criteria/Scans option before saving.
When you are finished, click on the Save button, type a name for your new function and click OK.
Repeat these steps for the SC slow PCRI, SC PCRI upper band, SC PCRI lower band & SC slow PCRI nvFisher functions using the following formulas for each:
SC Slow PCRI
&PCratio := Close Of "$PCROE" / 100
&PC := IFF (&PCratio > .9 , .9 , IFF (&PCratio < .45 , .45 , &PCratio))
&ma1 := MovingAvgW (&PC , mav)
&ma2 := MovingAvgW (&ma1 , mav)
&ma3 := MovingAvgW (&ma2 , mav)
&ma4 := MovingAvgW (&ma3 , mav)
&ma5 := MovingAvgW (&ma4 , mav)
&ma6 := MovingAvgW (&ma5 , mav)
&ma7 := MovingAvgW (&ma6 , mav)
&ma8 := MovingAvgW (&ma7 , mav)
&ma9 := MovingAvgW (&ma8 , mav)
&ma10 := MovingAvgW (&ma9 , mav)
&RnBw := &ma1 + &ma2 + &ma3 + &ma4 + &ma5 + &ma6 + &ma7 + &ma8 + &ma9 + &ma10
&rainb := &RnBw / 10
&pcri := MovingAvgW (&rainb , mova)
&pcri

Inputs:
mova = 1
mav = 5
SC PCRI Upper band
MovingAvg (SC Fast PCRI (5 , 5 , 5) , 200) + 1.3 * MovingStdDev (SC Fast PCRI (5 , 5 , 5) , 200)

Inputs: none
SC PCRI Lower band
MovingAvg (SC Fast PCRI (5 , 5 , 5) , 200) - 1.3 * MovingStdDev (SC Fast PCRI (5 , 5 , 5) , 200)

Inputs: none
SC Slow PCRI InvFisher
&PCratio := Close Of "$PCROE" / 100
&PC := IFF (&PCratio > .9 , .9 , IFF (&PCratio < .45 , .45 , &PCratio))
&ma1 := MovingAvgW (&PC , mav)
&ma2 := MovingAvgW (&ma1 , mav)
&ma3 := MovingAvgW (&ma2 , mav)
&ma4 := MovingAvgW (&ma3 , mav)
&ma5 := MovingAvgW (&ma4 , mav)
&ma6 := MovingAvgW (&ma5 , mav)
&ma7 := MovingAvgW (&ma6 , mav)
&ma8 := MovingAvgW (&ma7 , mav)
&ma9 := MovingAvgW (&ma8 , mav)
&ma10 := MovingAvgW (&ma9 , mav)
&RnBw := &ma1 + &ma2 + &ma3 + &ma4 + &ma5 + &ma6 + &ma7 + &ma8 + &ma9 + &ma10
&rainb := &RnBw / 10
&pcri := MovingAvgW (&rainb , mova)
&x := 1 * (RSI (&pcri , rsiper , False) - 50)
&invfish := ((Power (2 , 2 * &x) - 1) / (Power (2 , 2 * &x) + 1) + 1) * 50
&invfish

Inputs:
mova = 2
rsiper = 8
mav = 4
Creating the chart
Now that we have the functions, on a daily chart, go to the Add to Chart window by clicking on the chart and typing “A” on the keyboard.
Click on the Indicators tab, find the SC Fast PCRI indicator in the list and either doubleclick on it or highlight the name and click the Add button.
Repeat these steps for the SC slow PCRI, SC PCRI upper band, SC PCRI lower band & SC slow PCRI InvFisher indicators. Add a second copy of the SC slow PCRI.
Click on the name of the SC PCRI lower band on the chart and drag it into the same pane as the SC fast PCRI. Then do the same with the SC PCRI upper band and one of the SC slow PCRI.
Click on the name of the remaining SC slow PCRI and drag it into the pane with the SC slow PCRI InvFisher.
Type the letter “E” on your keyboard to bring up the Chart Settings window. Highlight each indicator and change it to the desired color in the chart settings window. Click OK.
In the pane with the SC fast PCRI on the chart, hold the Ctrl key down and click in that pane. Type “E” to go back to the Chart Settings window and locate the horizontal line and change the value to 50. Click OK.
Now that you have the chart the way you want it, click on the Templates button in the toolbar and select <Manage chart templates>, click the New button, type a name for your template and click OK.
Genesis Financial Technologies has provided a library called “Constructing the PCRI” that includes the study with the custom indicators discussed in this article. It also contains the template and a chart page to make it easier for you to view these indicators. You can download the file named “SC201111,” downloadable through Trade Navigator, to get this library.
A sample chart is shown in Figure 11.
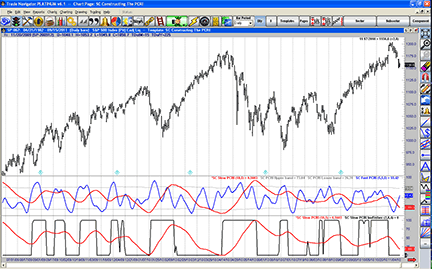
Figure 11: TRADE NAVIGATOR, Put/Call Ratio IndicatorS

UPDATA: PUT/CALL RATIO INDICATORS
This tip is based on “Constructing The Put/Call Ratio Indicator” by Sylvain Vervoort in this issue.
In the article, Vervoort creates three indicators based on the ratio of put-option volume to call-option volume for equities in the S&P 500 index. The slow PCRI smoothes the volume ratio with an iterative rainbow average; the fast PCRI uses this rainbow average as a basis in an RSI calculation, and the slow PCRI inverse Fisher transform processes this RSI calculation with a Fisher transform. Each should give a distinct benchmark for the cycle phase of the put/call ratio, and hence, the underlying index.
The Updata code for each indicator has now been added to the Updata Library and may be downloaded by clicking the custom menu and then either library. Those who cannot access the library due to a firewall may paste the code into the Updata custom editor and save it. The code is shown here:
'Slow Put Call Ratio Indicator
PARAMETER "Avg Period" #Period=5
PARAMETER "RnBw Smoothing" #Smooth=5
PARAMETER "RnBw Iterations" #Iteration=10
PARAMETER "P/C Ratio" ~Fundamental=Select
NAME "Avg Put / Call Ratio" ""
DISPLAYSTYLE LINE
PLOTSTYLE LINE RGB(0,0,0)
INDICATORTYPE Chart
#i=0
@PC=0
@RnBw=0
@RnBwSum=0
@RnBwAvg=0
FOR #CURDATE=#Period TO #LASTDATE
   If ~Fundamental>0.9
      @PC=0.9
   ElseIf ~Fundamental<0.45
      @PC=0.45
   Else
      @PC=~Fundamental
   EndIf
   @RnBwSum=0
   For #i=1 TO #Iteration
      if #i=1
        @RnBw=Sgnl(@PC,#Period,W)
        @RnBwSum=@RnBw
      else
        @RnBw=Sgnl(@RnBw,#Period,W)
        @RnBwSum=@RnBwSum+@RnBw
      endif
   Next
    @RnBwAvg=Sgnl(@RnBwSum/#Iteration,#Smooth,W)
    @Plot=@RnBwAvg
NEXT

'Fast Put Call Ratio Indicator
PARAMETER "Avg Period" #Period=10
PARAMETER "TEMA Period" #TemaPeriod=5
PARAMETER "RSI Period" #RSIPeriod=5
PARAMETER "RSI Smooth" #RSISmoothPeriod=5
PARAMETER "RnBw Iterations" #Iteration=10
PARAMETER "P/C Ratio" ~Fundamental=Select
NAME "Fast PCRI" ""
DISPLAYSTYLE 4LINES
PLOTSTYLE THICK2 RGB(0,0,0)
PLOTSTYLE2 LINE RGB(100,100,100)
PLOTSTYLE3 LINE RGB(100,100,100)
PLOTSTYLE4 DOT RGB(100,100,100)
INDICATORTYPE Chart
#i=0
@PC=0
@RnBw=0
@RnBwSum=0
@RnBwAvg=0
@RnBwRSI=0
@TEMA=0
@UpperBand=0
@LowerBand=0
FOR #CURDATE=#Period TO #LASTDATE
   If ~Fundamental>0.9
      @PC=0.9
   ElseIf ~Fundamental<0.45
      @PC=0.45
   Else
      @PC=~Fundamental
   EndIf
   @TEMA=3*Sgnl(@PC,#TemaPeriod,E)-3*Sgnl(Sgnl(@PC,#TemaPeriod,E),#TemaPeriod,E)+Sgnl(Sgnl(Sgnl(@PC,#TemaPeriod,E),#TemaPeriod,E),#TemaPeriod,E)
   For #i=1 TO #Iteration
      if #i=1
        @RnBw=Sgnl(@TEMA,#Period,W)
        @RnBwSum=@RnBw
      else
        @RnBw=Sgnl(@RnBw,#Period,W)
        @RnBwSum=@RnBwSum+@RnBw
      endif
   Next
    @RnBwAvg=@RnBwSum/#Iteration
    @RnBwRSI=Sgnl(STUDY(RSI(#RSIPeriod),@RnBwAvg),#RSISmoothPeriod,W)
    @UpperBand=Sgnl(@RnBwRSI,200,M)+1.3*StdDev(@RnBwRSI,200)
    @LowerBand=Sgnl(@RnBwRSI,200,M)-1.3*StdDev(@RnBwRSI,200)
    @Plot=@RnBwRSI
    @Plot2=@UpperBand
    @Plot3=@LowerBand
    @Plot4=50
NEXT

'Slow PCRI Inverse Fisher Transform
PARAMETER "Avg Period" #Period=4
PARAMETER "RSI Period" #RSIPeriod=8
PARAMETER "RnBw Smoothing" #PCRISmooth=2
PARAMETER "RnBw Iterations" #Iteration=10
PARAMETER "P/C Ratio" ~Fundamental=Select
NAME "Slow PCRI Inv Fisher Transform" ""
DISPLAYSTYLE 3LINES
PLOTSTYLE THICK2 RGB(0,0,0)
INDICATORTYPE Chart
#i=0
@PC=0
@RnBw=0
@RnBwSum=0
@RnBwAvg=0
@RnBwRSI=0
@x=0
@InvFisher=0
FOR #CURDATE=#Period TO #LASTDATE
   If ~Fundamental>0.9
      @PC=0.9
   ElseIf ~Fundamental<0.45
      @PC=0.45
   Else
      @PC=~Fundamental
   EndIf
   For #i=1 TO #Iteration
      if #i=1
        @RnBw=Sgnl(@PC,#Period,W)
        @RnBwSum=@RnBw
      else
        @RnBw=Sgnl(@RnBw,#Period,W)
        @RnBwSum=@RnBwSum+@RnBw
      endif
   Next
    @RnBwAvg=Sgnl(@RnBwSum/#Iteration,#PCRISmooth,W)
    @RnBwRSI=STUDY(RSI(#RSIPeriod),@RnBwAvg)
    @x=0.1*(@RnBwRSI-50)
    @InvFisher=50*(1+((Exp(2*@x)-1)/(Exp(2*@x)+1)))
    @Plot=@InvFisher
NEXT
A sample chart is shown in Figure 12.
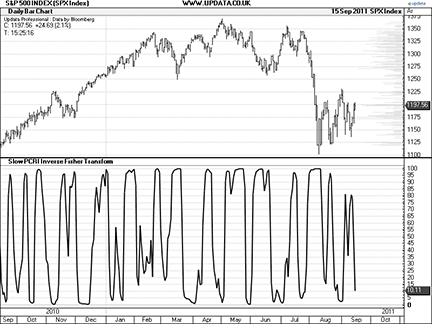
FIGURE 12: UPDATA, Put/Call Ratio IndicatorS. Here, the slow PCRI inverse transform is applied to the daily S&P 500 index.
MICROSOFT EXCEL: PUT/CALL RATIO INDICATORS
In his article in this issue, Sylvain Vervoort constructs three indicators built on the CBOE equities put/call ratio.
Here is an approach to building the three indicators described in the article using Microsoft Excel spreadsheet software.
My sample chart combines two data sources: Yahoo! Finance S&P 500 index price history, and equity put/call ratio data from the Cboe website. See the Notes tab in the workbook I have provided for download here “PutCallRatioIndicator.xls” to refresh the data from these sources.
A sample chart is shown in Figure 13.
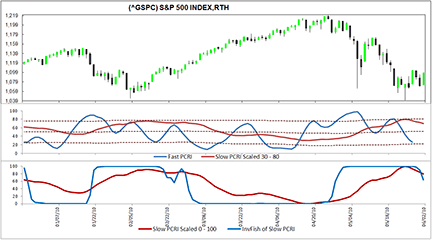
FIGURE 13: EXCEL, Put/Call Ratio IndicatorS. Here, the slow PCRI inverse transform is applied to the daily S&P 500 index.

VT TRADER: TRUE RANGE ZONE OSCILLATOR
Our Traders’ Tip this month is based on an article that appeared in the May 2011 issue of Stocks & Commodities, “Trending Or Nontrending: In the Volume Zone” by Walid Khalil and David Steckler. In part 1 of the article series, the authors introduce the volume zone oscillator (VZO). The VZO uses several overbought and oversold levels (+60, +40, +15, 0, -5, -40, and -60) to help the trader determine whether the price is in a bullish or bearish zone. Khalil and Steckler go on to describe several components and rules for a comprehensive VZO-based trading system.
Since the forex market does not provide any form of volume data, we have modified the VZO to use a measure of volatility instead. In view of this substitution, our modified indicator will be referred to as the true range zone oscillator. We’ll be offering the true range zone oscillator (TRZO) for download in our VT client forums at https://forum.vtsystems.com along with hundreds of other precoded and free indicators and trading systems.
The VT Trader instructions for recreating this indicator are as follows:
- VT Trader’s Ribbon → Technical Analysis menu → Indicators group → Indicators Builder → [New] button
- In the General tab, type the following text into each corresponding text box:
Name: True Range Zone Oscillator
Function Name Alias: tasc_TRZO
Label Mask: True Range Zone Oscillator (%Periods%) = %TRZO%
Placement: New Frame
Data Inspection Alias: True Range Zone Osc.
- In the Input Variable(s) tab, create the following variables:
[New] button...
Name: Periods
Display Name: Periods
Type: integer
Default: 14
- In the Output Variable(s) tab, create the following variables:
[New] button...
Var Name: TRZO
Name: (TRZO)
Line Color: dark blue
Line Width: slightly thicker
Line Type: solid
- In the Horizontal Line tab, create the following horizontal lines:
[New] button...
Value: +60
Line Color: dark red
Line Width: thin
Line Type: dashed

[New] button...
Value: +40
Line Color: red
Line Width: thin
Line Type: dashed

[New] button...
Value: +15
Line Color: red
Line Width: thin
Line Type: dashed

[New] button...
Value: 0
Line Color: black
Line Width: thin
Line Type: dashed

[New] button...
Value: -5
Line Color: red
Line Width: thin
Line Type: dashed

[New] button...
Value: -40
Line Color: red
Line Width: thin
Line Type: dashed

[New] button...
Value: -60
Line Color: dark red
Line Width: thin
Line Type: dashed
- In the Formula tab, copy and paste the following formula:
{Provided By: Capital Market Services, LLC & Visual Trading Systems, LLC} {Copyright: 2011} {Description: TASC, May 2011 - “In The Volume Zone” by Walid Khalil and David Steckler} {File: tasc_TRZO.vtscr - Version 1.0} TR:= Abs(Atr(1)); R:= If(C>Ref(C,-1),TR,-TR); TRP:= Mov(R,Periods,E); TTR:= Mov(TR,Periods,E); TRZO:= 100*(TRP/TTR); - Click the “Save” icon in the toolbar to finish building the true range zone oscillator (TRZO).
To attach the indicator to a chart, click the right mouse button within the chart window and then select “Add Indicator” → “True Range Zone Oscillator” from the indicator list.
A sample chart is shown in Figure 14.
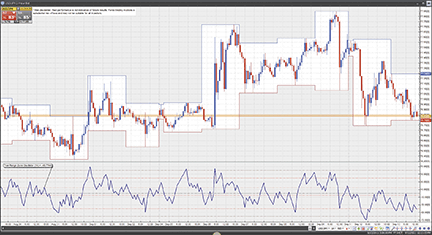
Figure 14: VT TRADER, true range zone oscillator. Here is an example of the true range zone oscillator (TRZO) on a USD/JPY one-hour candlestick chart.
To learn more about VT Trader, visit www.vtsystems.com.
Risk disclaimer: Forex trading involves a substantial risk of loss and may not be suitable for all investors.

METASTOCK — PUT/CALL RATIO INDICATORS — VERVOORT ARTICLE CODE
In part 2 of this series of articles, I created three put/call ratio indicators that will allow you to recognize the six phases of the price cycle (below). In part 3, I will show you a trading method based on using these three put/call ratio indicators.
Fast PCRI in MetaStock
{PCRI_Fast}
temav:=Input("TEMA average on PC ratio", 1,100,5);
rsiper:=Input("PC ratio RSI period",2,100,5);
rsiav:=Input("PCRI Indicator Average",1,100,5);
PCratio:=Security("C:\equis\data\specials\PCEQ",C);
PC:=If(PCratio>.9,.9,If(PCratio<.45,.45,PCratio));
PCtema:=Tema(PC,temav);
ma:= Mov(PCtema,2,W); RnBw:=ma;
ma:= Mov(ma,2,W); RnBw:=RnBw+ma;
ma:= Mov(ma,2,W); RnBw:=RnBw+ma;
ma:= Mov(ma,2,W); RnBw:=RnBw+ma;
ma:= Mov(ma,2,W); RnBw:=RnBw+ma;
ma:= Mov(ma,2,W); RnBw:=RnBw+ma;
ma:= Mov(ma,2,W); RnBw:=RnBw+ma;
ma:= Mov(ma,2,W); RnBw:=RnBw+ma;
ma:= Mov(ma,2,W); RnBw:=RnBw+ma;
ma:= Mov(ma,2,W); RnBw:=RnBw+ma;
rainb:= RnBw/10;
pcri:=Mov(RSI(rainb,rsiper),rsiav,W);
Mov(pcri,200,S)+1.3*Stdev(pcri,200);
Mov(pcri,200,S)-1.3*Stdev(pcri,200);
50;
Pcri
Slow PCRI in MetaStock
{PCRI_Slow}
mav:=Input("PC ratio rainbow average", 1,10,5);
mova:=Input("PCRI smoothing", 1,100,1);
PCratio:=Security("C:\equis\data\specials\PCEQ",C);
PC:=If(PCratio>.9,.9,If(PCratio<.45,.45,PCratio));
ma:= Mov(PC,mav,W); RnBw:=ma;
ma:= Mov(ma,mav,W); RnBw:=RnBw+ma;
ma:= Mov(ma,mav,W); RnBw:=RnBw+ma;
ma:= Mov(ma,mav,W); RnBw:=RnBw+ma;
ma:= Mov(ma,mav,W); RnBw:=RnBw+ma;
ma:= Mov(ma,mav,W); RnBw:=RnBw+ma;
ma:= Mov(ma,mav,W); RnBw:=RnBw+ma;
ma:= Mov(ma,mav,W); RnBw:=RnBw+ma;
ma:= Mov(ma,mav,W); RnBw:=RnBw+ma;
ma:= Mov(ma,mav,W); RnBw:=RnBw+ma;
rainb:= RnBw/10;
pcri:=Mov(rainb,mova,W);
pcri
Slow PCRI inverse Fisher transform in MetaStock
{PCRI_Slow_IFT}
mav:=Input("PC ratio rainbow average", 1,10,4);
mova:=Input("PCRI smoothing", 1,100,2);
rsiper:=Input("RSI period",1,100,8);
PCratio:=Security("C:\equis\data\specials\PCEQ",C);
PC:=If(PCratio>.9,.9,If(PCratio<.45,.45,PCratio));
ma:= Mov(PC,mav,W); RnBw:=ma;
ma:= Mov(ma,mav,W); RnBw:=RnBw+ma;
ma:= Mov(ma,mav,W); RnBw:=RnBw+ma;
ma:= Mov(ma,mav,W); RnBw:=RnBw+ma;
ma:= Mov(ma,mav,W); RnBw:=RnBw+ma;
ma:= Mov(ma,mav,W); RnBw:=RnBw+ma;
ma:= Mov(ma,mav,W); RnBw:=RnBw+ma;
ma:= Mov(ma,mav,W); RnBw:=RnBw+ma;
ma:= Mov(ma,mav,W); RnBw:=RnBw+ma;
ma:= Mov(ma,mav,W); RnBw:=RnBw+ma;
rainb:= RnBw/10;
pcri:=Mov(rainb,mova,W);
x:= .1*(RSI(pcri,rsiper)-50);
invfish:=((Exp(2*x)-1)/(Exp(2*x)+1)+1)*50;
invfish