TRADERS’ TIPS
December 2011
Here is this month’s selection of Traders’ Tips, contributed by various developers of technical analysis software to help readers more easily implement some of the strategies presented in this and other issues.
Other code appearing in articles in this issue is posted in the Subscriber Area of our website at https://technical.traders.com/sub/sublogin.asp. Login requires your last name and subscription number (from mailing label). Once logged in, scroll down to beneath the “Optimized trading systems” area until you see “Code from articles.” From there, code can be copied and pasted into the appropriate technical analysis program so that no retyping of code is required for subscribers.
You can copy these formulas and programs for easy use in your spreadsheet or analysis software. Simply “select” the desired text by highlighting as you would in any word processing program, then use your standard key command for copy or choose “copy” from the browser menu. The copied text can then be “pasted” into any open spreadsheet or other software by selecting an insertion point and executing a paste command. By toggling back and forth between an application window and the open web page, data can be transferred with ease.
This month’s tips include formulas and programs for:
- TRADESTATION: FISHER TRANSFORM STOCHASTIC OSCILLATOR
- eSIGNAL: FISHER TRANSFORM STOCHASTIC OSCILLATOR
- WEALTH-LAB: FISHER TRANSFORM STOCHASTIC OSCILLATOR
- AMIBROKER: FISHER TRANSFORM STOCHASTIC OSCILLATOR
- NEUROSHELL TRADER: FISHER TRANSFORM STOCHASTIC OSCILLATOR
- AIQ: FISHER TRANSFORM STOCHASTIC OSCILLATOR
- TRADERSSTUDIO: FISHER TRANSFORM STOCHASTIC OSCILLATOR
- STRATASEARCH: INVERSE FISHER TRANSFORM STOCHASTIC OSCILLATOR
- NINJATRADER: FISHER TRANSFORM STOCHASTIC OSCILLATOR
- TRADE NAVIGATOR: FISHER TRANSFORM STOCHASTIC OSCILLATOR
- UPDATA: FISHER TRANSFORM STOCHASTIC OSCILLATOR
- VT TRADER: FISHER TRANSFORM STOCHASTIC OSCILLATOR
- MICROSOFT EXCEL: FISHER TRANSFORM STOCHASTIC OSCILLATOR
- METASTOCK: INVERSE FISHER TRANSFORM STOCHASTIC OSCILLATOR — VERVOORT ARTICLE CODE

TRADESTATION: FISHER TRANSFORM STOCHASTIC OSCILLATOR
In the article “Applying The Put/Call Ratio Indicator” in this issue, author Sylvain Vervoort describes the construction of an indicator — called the SVE_Stoch_IFT — that is used in conjunction with the three indicators presented in his previous two articles in this three-part series. (Those indicators are the fast PCRI, the slow PCRI, and the PCRI slow inverse Fisher transform.) The indicators aid in trade entry and exit.
The author also describes several trading rules and examples using these four indicators. Below, we present indicator code for the Fisher transform stochastic oscillator (SVE_Stoch_IFT). This code is shown below.
The data in the chart shown in Figure 1 that is used for the put/call ratio indicator calculations is TradeStation symbol $PCVE, inserted as Data2.
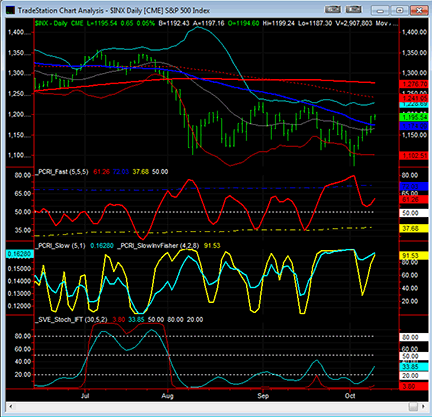
Figure 1: TRADESTATION, inverse Fisher transform stochastic oscillator (SVE_Stoch_IFT). Here is a daily chart of the S&P 500 index ($INX) exhibiting the chart setup described by Sylvain Vervoort in his article in this issue. In the top subgraph is the 20-period Bollinger Band indicator along with a 50-bar (blue), 100-bar (red dashed), and 200-bar (red) simple moving average. Subgraph 2 contains put/call ratio data (TradeStation [$PCVE]) that is hidden. Subgraph 3 contains the _PCRI_Fast indicator. Subgraph 4 contains the _PCRI_Slow (left-scaled) and _PCRI_SlowInvFisher indicators. Subgraph 5 contains the _SVE_Stoch_IFT indicator (code is provided).
To download the EasyLanguage code for the indicator, first navigate to the EasyLanguage FAQs and Reference Posts Topic in the EasyLanguage Support Forum (https://www.tradestation.com/Discussions/Topic.aspx?Topic_ID=47452), scroll down, and click on the link labeled “Traders’ Tips, TASC.” Then select the appropriate link for the month and year. The ELD filename is “_SVE_STOCH_IFT.ELD.”
_SVE_Stoch_IFT (Indicator)

{ TASC - December 2011 }
{ Applying the Put/Call Ratio Indicator
  by Sylvain Vervoort }

inputs:
	StochasticPeriod( 30 ),
	StochasticSlowing( 5 ),
	MALen( 2 ) ;

variables:
	MA( 0 ),
	RBW( 0 ),
	RBWStoch( 0 ),
	x( 0 ),
	IFTStoch( 0 ) ;

MA = WAverage( Close, MALen ) ;
RBW = 5 * MA ;
MA = WAverage( MA, MALen ) ;
RBW = RBW + 4 * MA ;
MA = WAverage( MA, MALen ) ;
RBW = RBW + 3 * MA ;
MA = WAverage( MA, MALen ) ;
RBW = RBW + 2 * MA ;
MA = WAverage( MA, MALen ) ;
RBW = RBW + MA ;
MA = WAverage( MA, MALen ) ;
RBW = RBW + MA ;
MA = WAverage( MA, MALen ) ;
RBW = RBW + MA ;
MA = WAverage( MA, MALen ) ;
RBW = RBW + MA ;
MA = WAverage( MA, MALen ) ;
RBW = RBW + MA ;
MA = WAverage( MA, MALen ) ;
RBW = ( RBW + MA ) / 20 ;

RBWStoch = ( Summation( RBW - Lowest( RBW,
 StochasticPeriod ) , StochasticSlowing ) /
 ( Summation( Highest( RBW, StochasticPeriod )-
 Lowest( RBW, StochasticPeriod ), StochasticSlowing )
 + 0.0001 ) * 100 ) ;

x = 0.1 * ( RBWStoch - 50 ) ;
IFTStoch = ( ( ExpValue( 2 * x ) - 1 ) /
 ( ExpValue( 2 * x ) + 1 ) + 1 ) * 50 ;

Plot1( IFTStoch, "IFTStoch" ) ;
Plot2( RBWStoch, "RBWStoch" ) ;
Plot3( 50, "50" ) ;
Plot4( 80, "OB" ) ;
Plot5( 20, "OS" ) ;
This article is for informational purposes. No type of trading or investment recommendation, advice, or strategy is being made, given, or in any manner provided by TradeStation Securities or its affiliates.

eSIGNAL: FISHER TRANSFORM STOCHASTIC OSCILLATOR
For this month’s Traders’ Tip, we’ve provided the formulas SVE_Stoch_IFT.efs and SVE_Stoch_IFT_Strategy.efs, based on Sylvain Vervoort’s article in this issue, “Applying The Put/Call Ratio Indicator.”
Both studies contains formula parameters to set the stochastic period and slowing, which may be configured through the Edit Chart window. This strategy study also contains a formula parameter to configure the SMA period and is configured for backtesting.
To discuss this study or download a complete copy of the formula code, please visit the EFS Library Discussion Board forum under the Forums link from the support menu at www.esignal.com or visit our EFS KnowledgeBase at https://www.esignal.com/support/kb/efs/. The code from the eSignal formula scripts (EFS) is also shown below.
A sample chart is shown in Figure 2.
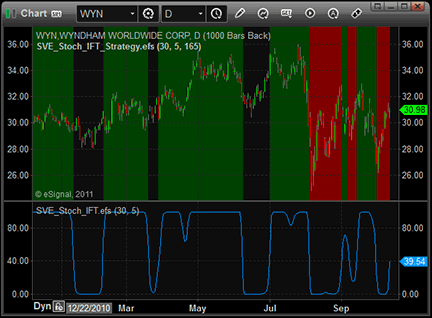
Figure 2: eSIGNAL, inverse Fisher transform stochastic oscillator
SVE_Stoch_IFT.efs

/*********************************
Provided By:
    Interactive Data Corporation (Copyright © 2011)
    All rights reserved. This sample eSignal Formula Script (EFS)
    is for educational purposes only. Interactive Data Corporation
    reserves the right to modify and overwrite this EFS file with
    each new release.

Description:
    Smoothed Inverse Fisher Transform Stochastic Oscillator

Version:            1.00  13/10/2011

Formula Parameters:                     Default:
Stochastic Period                       30
Stochastic Slowing                      5


Notes:
    The related article is copyrighted material. If you are not a subscriber
    of Stocks & Commodities, please visit www.traders.com.

**********************************/
var fpArray = new Array();
function preMain()
{
    setPriceStudy(false);
    setCursorLabelName("SVE_Stoch_IFT", 0);

    var x=0;
    fpArray[x] = new FunctionParameter("stochPeriod", FunctionParameter.NUMBER);
    with(fpArray[x++])
    {
	setName("Stochastic Period");
	setLowerLimit(2);
        setUpperLimit(100);
        setDefault(30);
    }

    fpArray[x] = new FunctionParameter("stochSlowing", FunctionParameter.NUMBER);
    with(fpArray[x++])
    {
	setName("Stochastic Slowing");
	setLowerLimit(1);
        setUpperLimit(10);
        setDefault(5);
    }
}

var bInit = false;
var bVersion = null;

var xRainb = null;
var xHHV = null;
var xLLV = null;

var xSmaR = null;
var xSmaL = null;
var xSmaH = null;

function main(stochPeriod, stochSlowing)
{
    if (bVersion == null) bVersion = verify();
    if (bVersion == false) return;

    if (!bInit)
    {
        xRainb = efsInternal("Calc_RainbW");
        xHHV = hhv(stochPeriod, xRainb);
        xLLV = llv(stochPeriod, xRainb);

        xSmaR = sma(stochSlowing, xRainb);
        xSmaL = sma(stochSlowing, xLLV);
        xSmaH = sma(stochSlowing, xHHV);

        bInit = true;
    }

    var nSmaR = xSmaR.getValue(0);
    var nSmaL = xSmaL.getValue(0);
    var nSmaH = xSmaH.getValue(0);

    if (nSmaR == null || nSmaL == null || nSmaH == null)
        return;

    var nSumR = nSmaR * stochSlowing;
    var nSumL = nSmaL * stochSlowing;
    var nSumH = nSmaH * stochSlowing;

    var nRBWStoch = (nSumR - nSumL)/(nSumH - nSumL + 0.0001)*100;

    var x = 0.1 * (nRBWStoch-50);

    var nIFTStoch = ((Math.exp(2 * x) - 1) / (Math.exp(2 * x) + 1) + 1) * 50;

    return nIFTStoch;
}

/*************************************************
             SUPPORT FUNCTIONS
**************************************************/
var bInitRainbow = false;
var xWMA1 = null;
var xWMA2 = null;
var xWMA3 = null;
var xWMA4 = null;
var xWMA5 = null;
var xWMA6 = null;
var xWMA7 = null;
var xWMA8 = null;
var xWMA9 = null;
var xWMA10 = null;

// rainbow averaging technique
function Calc_RainbW() {
var nRes = 0;
var nWMA1 = 0;
var nWMA2 = 0;
var nWMA3 = 0;
var nWMA4 = 0;
var nWMA5 = 0;
var nWMA6 = 0;
var nWMA7 = 0;
var nWMA8 = 0;
var nWMA9 = 0;
var nWMA10 = 0;
    if (!bInitRainbow) {
        xWMA1 = wma(2);
        xWMA2 = wma(2, xWMA1);
        xWMA3 = wma(2, xWMA2);
        xWMA4 = wma(2, xWMA3);
        xWMA5 = wma(2, xWMA4);
        xWMA6 = wma(2, xWMA5);
        xWMA7 = wma(2, xWMA6);
        xWMA8 = wma(2, xWMA7);
        xWMA9 = wma(2, xWMA8);
        xWMA10 = wma(2, xWMA9);
        bInitRainbow = true;
    }
    nWMA1 = xWMA1.getValue(0);
    nWMA2 = xWMA2.getValue(0);
    nWMA3 = xWMA3.getValue(0);
    nWMA4 = xWMA4.getValue(0);
    nWMA5 = xWMA5.getValue(0);
    nWMA6 = xWMA6.getValue(0);
    nWMA7 = xWMA7.getValue(0);
    nWMA8 = xWMA8.getValue(0);
    nWMA9 = xWMA9.getValue(0);
    nWMA10 = xWMA10.getValue(0);
    if (nWMA10 == null) return;
    nRes = (5 * nWMA1 + 4 * nWMA2 + 3 * nWMA3 + 2 * nWMA4 +
            nWMA5 + nWMA6 + nWMA7 + nWMA8 + nWMA9 + nWMA10) / 20;
    return nRes;
}


// verify version
function verify() {
    var b = false;
    if (getBuildNumber() < 779) {
        drawTextAbsolute(5, 35, "This study requires version 8.0 or later.",
            Color.white, Color.blue, Text.RELATIVETOBOTTOM|Text.RELATIVETOLEFT|Text.BOLD|Text.LEFT,
            null, 13, "error");
        drawTextAbsolute(5, 20, "Click HERE to upgrade.@URL=https://www.esignal.com/download/default.asp",
            Color.white, Color.blue, Text.RELATIVETOBOTTOM|Text.RELATIVETOLEFT|Text.BOLD|Text.LEFT,
            null, 13, "upgrade");
        return b;
    } else {
        b = true;
    }
    return b;
}


SVE_Stoch_IFT_Strategy.efs

/*********************************
Provided By:
    Interactive Data Corporation (Copyright © 2011)
    All rights reserved. This sample eSignal Formula Script (EFS)
    is for educational purposes only. Interactive Data Corporation
    reserves the right to modify and overwrite this EFS file with
    each new release.

Description:
    Smoothed Inverse Fisher Transform Stochastic Oscillator Strategy

Version:            1.00  13/10/2011

Formula Parameters:                     Default:
Stochastic Period                       30
Stochastic Slowing                      5
SMA Period                              165

Notes:
    The related article is copyrighted material. If you are not a subscriber
    of Stocks & Commodities, please visit www.traders.com.

**********************************/
var fpArray = new Array();

function preMain()
{
    setPriceStudy(true);
    setCursorLabelName("SVE_Stoch_IFT_Strategy", 0);

    var x=0;
    fpArray[x] = new FunctionParameter("stochPeriod", FunctionParameter.NUMBER);
    with(fpArray[x++])
    {
	setName("Stochastic Period");
	setLowerLimit(2);
        setUpperLimit(100);
        setDefault(30);
    }

    fpArray[x] = new FunctionParameter("stochSlowing", FunctionParameter.NUMBER);
    with(fpArray[x++])
    {
	setName("Stochastic Slowing");
	setLowerLimit(1);
        setUpperLimit(10);
        setDefault(5);
    }

    fpArray[x] = new FunctionParameter("smaPeriod", FunctionParameter.NUMBER);
    with(fpArray[x++])
    {
	setName("SMA Period");
	setLowerLimit(1);
        setDefault(165);
    }
}

var bInit = false;
var bVersion = null;

var xSVE_Stoch = null;
var xSMA = null;

function main(stochPeriod, stochSlowing, smaPeriod)
{
    // Back Testing formulas are not for real time analysis.
    // Therefore, prevent processing and exit at bar 0.
    if (getCurrentBarIndex() == 0) return;

    if (bVersion == null) bVersion = verify();
    if (bVersion == false) return;

    if (!bInit)
    {
        xSVE_Stoch = efsInternal("Calc_SVE_Stoch_IFT", stochPeriod, stochSlowing);
        xSMA = sma(smaPeriod);

        bInit = true;
    }

    var nStoch0 = xSVE_Stoch.getValue(0);
    var nStoch1 = xSVE_Stoch.getValue(-1);

    var nSMA = xSMA.getValue(0);

    if (nStoch0 == null || nSMA == null)
        return;

    // exit strategy
    if (Strategy.isInTrade())
    {
        // exit long
        if (Strategy.isLong())
        {
            if (nStoch1 > 60 && nStoch0 <= 60)
                Strategy.doSell("Long Exit Signal", Strategy.CLOSE, Strategy.THISBAR);
        }
        // exit short
        else if (Strategy.isShort())
        {
            if (nStoch1 < 30 && nStoch0 >= 30)
                Strategy.doCover("Short Exit Signal", Strategy.CLOSE, Strategy.THISBAR);
        }
    }

    // entry strategy
    if (!Strategy.isInTrade())
    {
        if (nStoch1 < 30 && nStoch0 >= 30)
            Strategy.doLong("Long signal", Strategy.CLOSE, Strategy.THISBAR);

        if (nStoch1 > 60 && nStoch0 <= 60)
            if (close(0) < nSMA)
                Strategy.doShort("Short signal", Strategy.CLOSE, Strategy.THISBAR);
    }


    if(Strategy.isLong()) {
    setBarBgColor(Color.darkgreen);
    } else if(Strategy.isShort()) {
    setBarBgColor(Color.maroon);
    }

    return;
}


// SVE_Stoch_IFT params
var stochInit = false;

var xRainb = null;
var xHHV = null;
var xLLV = null;

var xSmaR = null;
var xSmaL = null;
var xSmaH = null;

function Calc_SVE_Stoch_IFT(stochPeriod, stochSlowing)
{
    if (!stochInit)
    {
        xRainb = efsInternal("Calc_RainbW");
        xHHV = hhv(stochPeriod, xRainb);
        xLLV = llv(stochPeriod, xRainb);

        xSmaR = sma(stochSlowing, xRainb);
        xSmaL = sma(stochSlowing, xLLV);
        xSmaH = sma(stochSlowing, xHHV);

        stochInit = true;
    }

    var nSmaR = xSmaR.getValue(0);
    var nSmaL = xSmaL.getValue(0);
    var nSmaH = xSmaH.getValue(0);

    if (nSmaR == null || nSmaL == null || nSmaH == null)
        return;

    var nSumR = nSmaR * stochSlowing;
    var nSumL = nSmaL * stochSlowing;
    var nSumH = nSmaH * stochSlowing;

    var nRBWStoch = (nSumR - nSumL)/(nSumH - nSumL + 0.0001)*100;

    var x = 0.1 * (nRBWStoch-50);

    var nIFTStoch = ((Math.exp(2 * x) - 1) / (Math.exp(2 * x) + 1) + 1) * 50;

    return nIFTStoch;
}

var bInitRainbow = false;
var xWMA1 = null;
var xWMA2 = null;
var xWMA3 = null;
var xWMA4 = null;
var xWMA5 = null;
var xWMA6 = null;
var xWMA7 = null;
var xWMA8 = null;
var xWMA9 = null;
var xWMA10 = null;

// rainbow averaging technique
function Calc_RainbW() {
var nRes = 0;
var nWMA1 = 0;
var nWMA2 = 0;
var nWMA3 = 0;
var nWMA4 = 0;
var nWMA5 = 0;
var nWMA6 = 0;
var nWMA7 = 0;
var nWMA8 = 0;
var nWMA9 = 0;
var nWMA10 = 0;
    if (!bInitRainbow) {
        xWMA1 = wma(2);
        xWMA2 = wma(2, xWMA1);
        xWMA3 = wma(2, xWMA2);
        xWMA4 = wma(2, xWMA3);
        xWMA5 = wma(2, xWMA4);
        xWMA6 = wma(2, xWMA5);
        xWMA7 = wma(2, xWMA6);
        xWMA8 = wma(2, xWMA7);
        xWMA9 = wma(2, xWMA8);
        xWMA10 = wma(2, xWMA9);
        bInitRainbow = true;
    }
    nWMA1 = xWMA1.getValue(0);
    nWMA2 = xWMA2.getValue(0);
    nWMA3 = xWMA3.getValue(0);
    nWMA4 = xWMA4.getValue(0);
    nWMA5 = xWMA5.getValue(0);
    nWMA6 = xWMA6.getValue(0);
    nWMA7 = xWMA7.getValue(0);
    nWMA8 = xWMA8.getValue(0);
    nWMA9 = xWMA9.getValue(0);
    nWMA10 = xWMA10.getValue(0);
    if (nWMA10 == null) return;
    nRes = (5 * nWMA1 + 4 * nWMA2 + 3 * nWMA3 + 2 * nWMA4 +
            nWMA5 + nWMA6 + nWMA7 + nWMA8 + nWMA9 + nWMA10) / 20;
    return nRes;
}

// verify version
function verify() {
    var b = false;
    if (getBuildNumber() < 779) {
        drawTextAbsolute(5, 35, "This study requires version 8.0 or later.",
            Color.white, Color.blue, Text.RELATIVETOBOTTOM|Text.RELATIVETOLEFT|Text.BOLD|Text.LEFT,
            null, 13, "error");
        drawTextAbsolute(5, 20, "Click HERE to upgrade.@URL=https://www.esignal.com/download/default.asp",
            Color.white, Color.blue, Text.RELATIVETOBOTTOM|Text.RELATIVETOLEFT|Text.BOLD|Text.LEFT,
            null, 13, "upgrade");
        return b;
    } else {
        b = true;
    }
    return b;
}

WEALTH-LAB: FISHER TRANSFORM STOCHASTIC OSCILLATOR
Our Wealth-Lab strategy code this month includes the indicator-plotting template presented in Sylvain Vervoort’s article in this issue, “Applying The Put/Call Ratio Indicator.”
This indicator has now been added to Wealth-Lab’s TASCIndicator Library. We have found it to produce performance results similar to Vervoort’s using only the trading rules employing the SVE_Stoch_IFT indicator.
In addition, the money management rule discussed in Vervoort’s article for not sharing profit or loss between symbols inspired us to create a new MS123.PosSizer for that purpose. An equity curve for the portfolio simulation with $100,000 starting equity is shown in Figure 3.
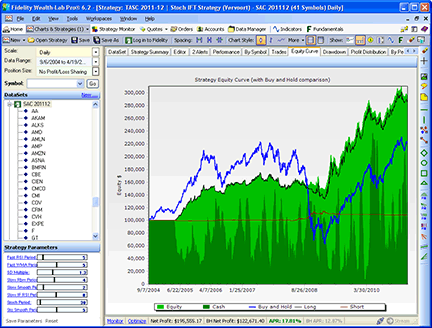
Figure 3: WEALTH-LAB, INVERSE FISHER TRANSFORM STOCHASTIC OSCILLATOR STRATEGY. The strategy presented by Sylvain Vervoort in his article in this issue based on the inverse Fisher transform stochastic oscillator was able to avoid the large 2008 drawdown (seen in blue) that using a buy & hold approach would have produced by trading from the short side (red), which compensated for the drawdown in long positions (black).
As a reminder, Wealth-Lab users should install the CBOE Provider extension from Wealth-Lab.com to easily access and update put/call ratio data directly from the CBOE website.
The code is shown below.
C# code:

using System;
using System.Collections.Generic;
using System.Text;
using System.Drawing;
using WealthLab;
using WealthLab.Indicators;
using TASCIndicators;

namespace WealthLab.Strategies
{
   public class PutCallRatioIndicator : WealthScript
   {
      StrategyParameter _rsiPeriod;
      StrategyParameter _wmaPeriod;
      StrategyParameter _devs;
      StrategyParameter _slowRainbowPeriod;
      StrategyParameter _wmaSlow;
      StrategyParameter _rsiPer;
      StrategyParameter _stoPer;
      StrategyParameter _stoSmooth;

      public PutCallRatioIndicator()
      {
         _rsiPeriod = CreateParameter("Fast RSI Period", 5, 2, 30, 1);
         _wmaPeriod = CreateParameter("Fast WMA Period", 5, 2, 10, 1);
         _devs = CreateParameter("SD Multiple", 1.3, 1, 2, 0.1);
         _slowRainbowPeriod = CreateParameter("Slow Rbw Period", 4, 1, 10, 1);
         _wmaSlow = CreateParameter("Slow Smooth Period", 2, 1, 10, 1);
         _rsiPer = CreateParameter("Slow IF RSI Period", 8, 1, 20, 1);
         _stoPer = CreateParameter("Stoch Period", 30, 5, 500, 1);
         _stoSmooth = CreateParameter("Sto Smooth Perio", 5, 2, 10, 1);
      }


      // Transforms a series for unscaled plotting (translated from WL4 Code Library, Dexter Brunet)
      public DataSeries TransformSeries( DataSeries ds, double a1, double a2, double b1, double b2)
      {
         string sName = ds.Description + "(No Scale)";
         if (Math.Abs(a1 - a2) > 0.00001)
         {
            double a = (b1 - b2)/(a1 - a2);
            double b = (b2 * a1 - a2 * b1)/(a1 - a2);
            DataSeries s = ds * a;
            s += b;
            s.Description = sName;
            return s;
         }
         else
            return ds;
      }

      protected override void Execute()
      {
         // Access the raw P/C Ratio data
         DataSeries pcrEQ = GetExternalSymbol("CBOE", "EQUITYPC", true).Close;

         /* Create and plot indicators */
         HideVolume();

         // Moving Averages
         DataSeries ma50 = SMA.Series(Close, 50);
         DataSeries ma100 = SMA.Series(Close, 100);
         DataSeries ma200 = SMA.Series(Close, 200);
         DataSeries ma20 = SMA.Series(Close, 20);
         DataSeries bbU = BBandUpper.Series(Close, 20, 2);
         DataSeries bbL = BBandLower.Series(Close, 20, 2);
         PlotSeries(PricePane, ma50, Color.Blue, LineStyle.Solid, 1);
         PlotSeries(PricePane, ma100, Color.Red, LineStyle.Dashed, 1);
         PlotSeries(PricePane, ma200, Color.Red, LineStyle.Solid, 1);
         PlotSeries(PricePane, ma20, Color.Green, LineStyle.Solid, 1);
         PlotSeriesFillBand(PricePane, bbU, bbL, Color.Transparent, Color.FromArgb(30, Color.Green), LineStyle.Solid, 1);

         DataSeries fastPCRI = PCRiFast.Series(pcrEQ, _rsiPeriod.ValueInt, _wmaPeriod.ValueInt);
         DataSeries uBand = BBandUpper.Series(fastPCRI, 200, _devs.Value);
         DataSeries lBand = BBandLower.Series(fastPCRI, 200, _devs.Value);
         DataSeries slowPCRI = PCRiSlow.Series(pcrEQ, _slowRainbowPeriod.ValueInt, _wmaSlow.ValueInt);

         ChartPane rsiPane = CreatePane(40, false, true);
         PlotSeries(rsiPane, fastPCRI, Color.Black, LineStyle.Solid, 2);
         PlotSeries(rsiPane, uBand, Color.Blue, LineStyle.Dashed, 1);
         PlotSeries(rsiPane, lBand, Color.Blue, LineStyle.Dashed, 1);

         // Transform slowPCRI for plotting in same pane as fastPCRI
         int n = Bars.Count - 1;
         DataSeries slowT = TransformSeries(slowPCRI, Lowest.Value(n, slowPCRI, n - 30), Highest.Value(n, slowPCRI, n - 30), 0, 100);
         ChartPane sloPane = CreatePane(40, false, true);
         PlotSeries(sloPane, slowT, Color.Red, LineStyle.Solid, 2);

         DataSeries pcri_IF = PCRiSlowIFT.Series(pcrEQ, _slowRainbowPeriod.ValueInt, _wmaSlow.ValueInt, _rsiPer.ValueInt);
         PlotSeries(sloPane, pcri_IF, Color.Blue, LineStyle.Solid, 2);

         DataSeries iftSto = InverseFisherStoch.Series(Close, _stoPer.ValueInt, _stoSmooth.ValueInt);
         DataSeries stoD = StochD.Series(Bars, _stoPer.ValueInt, _stoSmooth.ValueInt);
         ChartPane stoPane = CreatePane(40, false, true);
         PlotSeries(stoPane, iftSto, Color.Red, LineStyle.Solid, 2);
         PlotSeries(stoPane, stoD, Color.Blue, LineStyle.Solid, 1);

         for (int bar = GetTradingLoopStartBar(165); bar < Bars.Count; bar++)
         {
            if (IsLastPositionActive)
            {
               Position p = LastPosition;
               if (p.PositionType == PositionType.Long)
               {
                  if (CrossUnder(bar, iftSto, 60))
                     ExitAtMarket(bar + 1, p);
               }
               else if (CrossOver(bar, iftSto, 30))
                  ExitAtMarket(bar + 1, p);
            }
            else
            {
               if (CrossOver(bar, iftSto, 30))
                  BuyAtMarket(bar + 1);
               else if (CrossUnder(bar, iftSto, 60) && Close[bar] < SMA.Series(Close, 165)[bar])
                  ShortAtMarket(bar + 1);
            }
         }
      }
   }
}

AMIBROKER: FISHER TRANSFORM STOCHASTIC OSCILLATOR
In “Applying The Put/Call Ratio Indicator” in this issue, author Sylvain Vervoort presents the inverse Fisher transform stochastic oscillator. An AmiBroker formula to implement this technique is shown below. To use it, enter the formula in the AFL editor, then press “insert indicator.” To adjust the stochastic period and slowing, right-click on the chart and select “parameters” from the context menu.
A sample chart is shown in Figure 4.
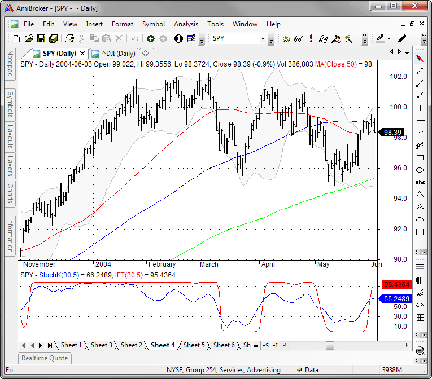
FIGURE 4: AMIBROKER, INVERSE FISHER TRANSFORM STOCHASTIC OSCILLATOR. Here is an SPY price chart with Bollinger Bands and 50/100/200 moving averages (upper pane) with the inverse Fisher transform stochastic oscillator in the lower pane.
// Inverse Fisher Transform Stochastic Oscillator
stochper = Param( "Stochastic Period?", 30, 2, 100 );
slowing = Param( "Stochastic Slowing?", 5, 1, 10 );
mav = WMA( C, 2 );
RBW = 5 * mav;
mav = WMA( mav, 2 );
RBW += 4 * mav;
mav = WMA( mav, 2 );
RBW += 3 * mav;
mav = WMA( mav, 2 );
RBW += 2 * mav;
for( i = 0; i < 6; i++ )
{
 mav = WMA( mav, 2 );
 RBW += mav;
}

RBW /= 20;
RBWStoch = 100 * Sum( RBW - LLV( RBW, stochper ), slowing ) /
( Sum( HHV( RBW, stochper ) - LLV( RbW, stochper ), slowing ) + 0.0001 );

x = 0.1 * ( RBWStoch - 50 );
IFTStoch = ( ( exp( 2 * x ) - 1 ) / ( exp( 2 * x ) + 1 ) + 1 ) * 50;

Plot( StochK(stochper, slowing), "StochK" + _PARAM_VALUES(), colorBlue );
Plot( IFTStoch, "IFT" + _PARAM_VALUES(), colorRed );

Buy = IFTStoch > 30;
Sell = IFTStoch < 60;

Short = IFTStoch < 60 AND Close < MA( Close, 165 );
Cover = IFTStoch > 30;

NEUROSHELL TRADER: FISHER TRANSFORM STOCHASTIC OSCILLATOR
The inverse Fisher transform stochastic oscillator described by Sylvain Vervoort in his article in this issue, “Applying The Put/Call Ratio Indicator,” can be easily implemented with a few of NeuroShell Trader’s 800+ indicators. Simply select “New Indicator…” from the Insert menu and use the Indicator Wizard to set up the indicators using the following formulas:
RBWStoch*
Multiply2(Divide2(Sum(Subtract(RainbowAvg(Close,2)-Min(RainbowAvg(Close,2),30)), 5),
Add2(Sum(Subtract2(Max(RainbowAvg(Close,2),30)-Min(RainbowAvg(Close,2),30)), 5),0.0001)),100)

SVE_Stoch_IFT*
Multiply2(Add2(Divide(Subtract(Exp(Multiply2(2, Multiply2( 0.1, Subtract(RBWStoch,50)))),1), Add2(Exp(Multiply2(2, Multiply2( 0.1, Subtract(RBWStoch,50)))),1)),1), 50)
*The above indicators use the Rainbow Avg indicator from part 2 of this article series.
To recreate the trading system based on the inverse Fisher transform stochastic oscillator, use the Trading Strategy Wizard to enter the following formulas in the appropriate locations:
Generate a buy long “MarketClose (current bar)” order if all of the following are true:
A>B(SVE_Stoch_IFT, 30)
Generate a sell long “MarketClose (current bar)” order if all of the following are true:
A<B(SVE_Stoch_IFT, 60)
Generate a sell short “MarketClose (current bar)” order if all of the following are true:
A<B(SVE_Stoch_IFT, 60)
A<B(Close,MovAvg(Close,165))
Generate a cover short “MarketClose (current bar)” order if all of the following are true:
A>B(SVE_Stoch_IFT, 30)
If you have NeuroShell Trader Professional, you can also choose whether the parameters should be optimized. After backtesting the trading strategy, use the “Detailed analysis” button to view the backtest and trade-by-trade statistics for the strategy.
A chart that includes these indicators (including the rainbow average from Vervoort’s previous article) and trading rules are available as a download from the Stocks & Commodities section of the NeuroShell Trader free technical support website at www.neuroshell.com.
A sample chart is shown in Figure 5.
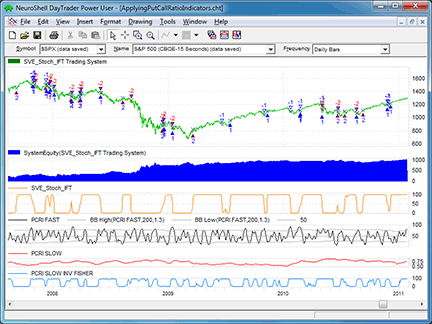
FIGURE 5: NEUROSHELL TRADER, INVERSE FISHER TRANSFORM STOCHASTIC OSCILLATOR. This NeuroShell Trader chart shows the inverse Fisher transform stochastic oscillator trading system and confirming put/call ratio signals.

AIQ: FISHER TRANSFORM STOCHASTIC OSCILLATOR
The AIQ code for Sylvain Vervoort’s put/call ratio indicator — named the IFTStoch indicator — and the related system from his article in this issue, “Applying The Put/Call Ratio Indicator,” is provided at the website noted at the end of this writeup.
The code has been modified from the author’s formulas, which used weighted averaging. That type of averaging is not offered in AIQ as a built-in function and had to be coded long style; the result was very inefficient code that ran too slowly to be of any use. So I modified the formulas by substituting exponential averaging for the weighted averaging. The code now runs fast enough to be useful, and the indicators can be plotted without hanging up the processor.
I believe that the modified code can produce similar results. Although the values are not the same as the author’s values when using the same parameters, the resulting shapes of the indicators are similar.
On my website, I have a “PCratio.dta” data file that can be downloaded and saved into the “C:\wintes32\tdata\” folder. Once the file is saved, go to the Data Manager module and run the utility “Rebuild Master Ticker List” to complete the data file installation process.
Using the system from Vervoort’s article called the SVE_Stoch_IFT, I ran a test on the NASDAQ 100 list of stocks using the Portfolio Manager module. The following capitalization settings were used:
- Maximum of 10 open positions
- Size each position at 10% of mark-to-market total capital
- Take no more than three new positions per day
- Compute the mark-to-market capital each day
- Choose signals based on the IFTStoch indicator for ranking in descending order for longs.
In Figure 6, I show the equity curve for long-only trading on the NASDAQ 100 list of stocks. The return averaged 19% per year with a maximum drawdown of 50% on March 9, 2009.
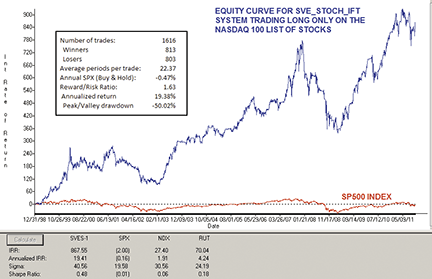
FIGURE 6: AIQ SYSTEMS, INVERSE FISHER TRANSFORM STOCHASTIC OSCILLATOR SYSTEM. Shown here is the equity curve for a trading simulation using the SVE_Stoch_IFT system on the NASDAQ 100 list of stocks for the period 12/31/1998 to 10/10/2011 (blue line) compared to buy & hold on the S&P 500 index (red line).
The short side, when tested separately from the longs, lost 91% of the initial capital by January 7, 2004, and then ceased to trade due to limited capital. The results of the short-side test are not shown.
I did not attempt to filter the trades using the put/call ratio indicators, since the author did not supply specific code for this purpose.
The code and EDS file can be downloaded from www.TradersEdgeSystems.com/traderstips.htm. The code is also shown below.
!CONSTRUCTING THE PUT/CALL RATIO INDICATOR (MODIFIED VERSION)
!Author: Sylvain Vervoort, TASC November 2011
!Coded by: Richard Denning 9/11/2011

!NOTE: THIS VERSION USES EXPONENTIAL RATHER THAN THE AUTHOR’S WEIGHTED AVERAGING

!INPUTS:
!For pcriFAST Indicator:
	emaF is 2.
	emaFAST	is 5.
	rsiFAST	is 5.
 	movFAST is 5.

!For pcriSLOW Indicator:
	emaS	is 3.
	movSLOW	is 1.

!For invFISH Indicator:
	emaIF	is 2.
	rsiFISH is 8.
	movFISH	is 3.

!For invSVEstoch Indicator:
	stochLen is 30.
	smoLen	is 5.
	emaSVE is 2.

!FORMULAS COMMON TO ALL THREE INDICATORS:
C 	is [close].
PCR	is tickerUDF("PCratio",C).
PCRA	is iff(PCR > 0.9,0.9,iff(PCR < 0.45,0.45,PCR)).

!FAST PCRI:
EMApc	is expavg(PCRA,emaFAST).
EMA_EMApc is expavg(EMApc,emaFAST).
TEMApc 	is 3*EMApc - 3*EMA_EMApc + expavg(EMA_EMApc,emaFAST).
ma1 	is expavg(TEMApc,emaF).
ma2	is expavg(ma1,emaF).
ma3	is expavg(ma2,emaF).
ma4	is expavg(ma3,emaF).
ma5	is expavg(ma4,emaF).
ma6	is expavg(ma5,emaF).
ma7	is expavg(ma6,emaF).
ma8	is expavg(ma7,emaF).
ma9	is expavg(ma8,emaF).
ma10	is expavg(ma9,emaF).
rainbPC	is (ma1 + ma2 + ma3 + ma4 + ma5 + ma6 + ma7 + ma8 + ma9 + ma10)/10.

!RSI WILDER OF rainbPC:
!To convert Wilder Averaging to Exponential Averaging use this formula:
!ExponentialPeriods = 2 * WilderPeriod - 1.
U 	is rainbPC - valresult(rainbPC,1).
D 	is valresult(rainbPC,1) - rainbPC.
rsiLen1	is 2 * rsiFAST - 1.
AvgU 	is expAvg(iff(U>0,U,0),rsiLen1).
AvgD 	is expAvg(iff(D>=0,D,0),rsiLen1).
rsiPC 	is 100-(100/(1+(AvgU/AvgD))).

pcriFAST is expavg(rsiPC,movFAST). !PLOT AS CUSTOM INDICATOR

sDevPcri is sqrt(variance(pcriFAST,200)).
UPpcri 	is simpleavg(pcriFAST,200) + 1.3*sDevPcri.
DNpcri	is simpleavg(pcriFAST,200) - 1.3*sDevPcri.

!SLOW PCRI:
ma11 	is expavg(PCRA*100,emaS).
ma12	is expavg(ma11,emaS).
ma13	is expavg(ma12,emaS).
ma14	is expavg(ma13,emaS).
ma15	is expavg(ma14,emaS).
ma16	is expavg(ma15,emaS).
ma17	is expavg(ma16,emaS).
ma18	is expavg(ma17,emaS).
ma19	is expavg(ma18,emaS).
ma20	is expavg(ma19,emaS).
rbPCslow is (ma11 + ma12 + ma13 + ma14 + ma15 + ma16 + ma17 + ma18 + ma19 + ma20)/10.
pcriSLOW is expavg(rbPCslow,movSLOW).  !PLOT AS CUSTOM INDICATOR

!iFISH PCRI:
ma21 	is expavg(PCRA*100,emaIF).
ma22	is expavg(ma21,emaIF).
ma23	is expavg(ma22,emaIF).
ma24	is expavg(ma23,emaIF).
ma25	is expavg(ma24,emaIF).
ma26	is expavg(ma25,emaIF).
ma27	is expavg(ma26,emaIF).
ma28	is expavg(ma27,emaIF).
ma29	is expavg(ma28,emaIF).
ma30	is expavg(ma29,emaIF).
rbPCslowF is (ma21 + ma22 + ma23 + ma24 + ma25 + ma26 + ma27 + ma28 + ma29 + ma30)/10.
pcriFISH is expavg(rbPCslowF,movFISH).

!RSI WILDER OF pcriFISH:
!To convert Wilder Averaging to Exponential Averaging use this formula:
!ExponentialPeriods = 2 * WilderPeriod - 1.
UpF 	is pcriFISH - valresult(pcriFISH,1).
DpF 	is valresult(pcriFISH,1) - pcriFISH.
rsiLen2	is 2 * rsiFISH - 1.
AvgUpF 	is expAvg(iff(UpF>0,UpF,0),rsiLen2).
AvgDpF 	is expAvg(iff(DpF>=0,DpF,0),rsiLen2).
rsiF is 100-(100/(1+(AvgUpF/AvgDpF))).

X 	is 0.1*(rsiF-50).

invFISH is ((exp(2*x)-1)/(exp(2*x)+1)+1)*50. !PLOT AS CUSTOM INDICATOR

!INVERSE FISHER TRANSFORM STOCHASTIC OSCILLATOR:
ma31 	is expavg(C,emaSVE).
ma32	is expavg(ma21,emaSVE).
ma33	is expavg(ma22,emaSVE).
ma34	is expavg(ma23,emaSVE).
ma35	is expavg(ma24,emaSVE).
ma36	is expavg(ma25,emaSVE).
ma37	is expavg(ma26,emaSVE).
ma38	is expavg(ma27,emaSVE).
ma39	is expavg(ma28,emaSVE).
ma40	is expavg(ma29,emaSVE).
RBW 	is (5*ma31 + 4*ma32 + 3*ma33 + 2*ma34 + ma35 + ma36 + ma37 + ma38 + ma39 + ma40)/20.
RBWstoch is (sum(RBW - lowresult(RBW,stochLen),smoLen) /
	(sum(highresult(RBW,stochLen) - lowresult(RBW,stochLen),smoLen)+0.0001)*100).
Y 	is 0.1*(RBWstoch-50).
IFTstoch is ((exp(2*y)-1)/(exp(2*y)+1)+1)*50. !PLOT AS CUSTOM INDICATOR

!REPORT TABS:
FAST 	if 1.
SLOW 	if 1.
iFISH 	if 1.
iSVE 	if 1.

!TRADING SYSTEM CODE:
BuyIstoch if IFTstoch > 30.
ExitBuy if IFTstoch < 60.
ShortIstoch if IFTstoch < 60 and C < simpleavg(C,165).
ExitShort if IFTstoch > 30.

TRADERSSTUDIO: FISHER TRANSFORM STOCHASTIC OSCILLATOR
The TradersStudio code for Sylvain Vervoort’s put/call ratio indicators and the IFTStoch indicator based on his article in this issue, “Applying The Put/Call Ratio Indicator,” is provided at the websites noted below. From there, you can download the following code files:
For last month’s issue (November 2011), which presented part 2 of Vervoort’s article series:
- Function: “TEMA” computes the TRIX value for input to the FAST PCRI
- Function: “RainbowMA” computes the rainbow moving average for all indicators
- Indicator plot: “PCRI_FAST_IND2” for displaying the PCRI_FAST indicator on a chart
- Indicator plot: “PCRI_SLOW_IND2” for displaying the PCRI_SLOW indicator on a chart
- Indicator plot: “PCRI_FISH_IND2” for displaying the PCRI_IFISH indicator on a chart
- System: “PC_RATIO_TEST2” is the session code for setting up a session chart (not a system)
For this issue (December 2011), which presents part 3 of Vervoort’s article series:
- Function: “IFTStoch” computes the IFTStoch Indicator
- Indicator plot: “IFTStoch_IND” for displaying the IFTStoch indicator on a chart
- System: “FVE_STOCH_IFT_SYS” is the session code for the trading system described by author Sylvain Vervoort.
The function “IFTStoch” has an input parameter that sets the type of averaging used in the indicator. The choices are: simple = 1, weighted = 2, exponential = 3. Although the author uses the weighted averaging, upon testing I found a slight advantage to exponential averaging over the weighted and the simple. The tests shown in Figures 7 and 8 use exponential averaging.
In Figure 7, I show the logarithmic equity curve for the FVE_STOCH_IFT_SYS using the tradeplan TS_StockPlanFilterRanking using parameters of 30 for the upper percent and zero for the ranking type. This tradeplan ships with the TradersStudio program and is explained in the manual. In Figure 8, I show the underwater equity curve. The test was run using my standard test list of 74 highly active NASDAQ stocks from 1998 to October 7, 2011, which showed a 14.1% compound annual return with a 62.7% maximum drawdown that occurred on November 11, 2002.
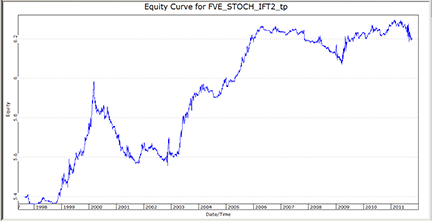
FIGURE 7: TRADERSSTUDIO, INVERSE FISHER TRANSFORM STOCHASTIC OSCILLATOR. Here is a logarithmic equity curve for the SVE_STOCH_IFT_SYS on the 74 NASDAQ stocks, from 1998 to 10/7/2011, using the tradeplan TS_StockPlanFilterRanking(30,0).
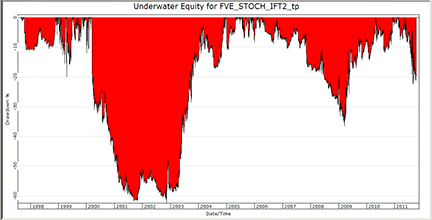
FIGURE 8: TRADERSSTUDIO, UNDERWATER EQUITY CURVE. Here is an underwater equity curve for the SVE_STOCH_IFT_SYS on the 74 NASDAQ stocks, 1998 to 10/7/2011, using the tradeplan TS_StockPlanFilterRanking(30,0).
I did not attempt to filter the trades using the put/call ratio indicators, since the author did not supply specific code for this purpose.
The code can be downloaded from the TradersStudio website at www.TradersStudio.com → Traders Resources → FreeCode or www.TradersEdgeSystems.com/traderstips.htm. It is also shown below.
'APPLYING THE PUT/CALL RATIO INDICATOR
'Author: Sylvain Vervoort, TASC December 2011
'Coded by: Richard Denning 10/10/2011

Function IFTStoch(Price As BarArray,avgLen,stochLen,stochSmo,AvgType)
    'defaults: Price = C,avgLen = 2,stochLen = 30,stochSmo = 5,AvgType = 3
    'simple averaging: AvgType = 1
    'weighted averaging: AvgType = 2
    'exponential averaging: AvgType = 3
    Dim AvgAvgs As BarArray
    Dim AvgVal As BarArray
    Dim LLV As BarArray
    Dim HHV As BarArray
    Dim RBWStoch As BarArray
    Dim X As BarArray
    Dim AvgArr As Array
    Dim n
    ReDim (AvgArr, 11)

    AvgAvgs = 0
    If AvgType = 1 Then
        AvgArr[1] = Average(Price, avgLen, 0)
        AvgArr[2] = Average(AvgArr[1], avgLen, 0)
        AvgArr[3] = Average(AvgArr[2], avgLen, 0)
        AvgArr[4] = Average(AvgArr[3], avgLen, 0)
        AvgArr[5] = Average(AvgArr[4], avgLen, 0)
        AvgArr[6] = Average(AvgArr[5], avgLen, 0)
        AvgArr[7] = Average(AvgArr[6], avgLen, 0)
        AvgArr[8] = Average(AvgArr[7], avgLen, 0)
        AvgArr[9] = Average(AvgArr[8], avgLen, 0)
        AvgArr[10] = Average(AvgArr[9], avgLen, 0)
    End If
    If AvgType = 2 Then
        AvgArr[1] = WeightedMA(Price, avgLen, 0)
        AvgArr[2] = WeightedMA(AvgArr[1], avgLen, 0)
        AvgArr[3] = WeightedMA(AvgArr[2], avgLen, 0)
        AvgArr[4] = WeightedMA(AvgArr[3], avgLen, 0)
        AvgArr[5] = WeightedMA(AvgArr[4], avgLen, 0)
        AvgArr[6] = WeightedMA(AvgArr[5], avgLen, 0)
        AvgArr[7] = WeightedMA(AvgArr[6], avgLen, 0)
        AvgArr[8] = WeightedMA(AvgArr[7], avgLen, 0)
        AvgArr[9] = WeightedMA(AvgArr[8], avgLen, 0)
        AvgArr[10] = WeightedMA(AvgArr[9], avgLen, 0)
    End If
    If AvgType = 3 Then
        AvgArr[1] = XAverage(Price, avgLen, 0)
        AvgArr[2] = XAverage(AvgArr[1], avgLen, 0)
        AvgArr[3] = XAverage(AvgArr[2], avgLen, 0)
        AvgArr[4] = XAverage(AvgArr[3], avgLen, 0)
        AvgArr[5] = XAverage(AvgArr[4], avgLen, 0)
        AvgArr[6] = XAverage(AvgArr[5], avgLen, 0)
        AvgArr[7] = XAverage(AvgArr[6], avgLen, 0)
        AvgArr[8] = XAverage(AvgArr[7], avgLen, 0)
        AvgArr[9] = XAverage(AvgArr[8], avgLen, 0)
        AvgArr[10] = XAverage(AvgArr[9], avgLen, 0)
    End If
    For n = 1 To 10
        If n = 0 Then
            AvgAvgs = AvgAvgs + 5*AvgArr[0]
        Else If n = 1 Then
            AvgAvgs = AvgAvgs + 4*AvgArr[1]
        Else If n = 2 Then
            AvgAvgs = AvgAvgs + 3*AvgArr[2]
        Else If n = 3 Then
            AvgAvgs = AvgAvgs + 2*AvgArr[3]
        Else
            AvgAvgs = AvgAvgs + AvgArr[n]
        End If
        End If
        End If
        End If
    Next
    AvgVal = AvgAvgs / 20
    LLV = Lowest(AvgVal,stochLen)
    HHV = Highest(AvgVal,stochLen)
    RBWStoch = summation(AvgVal-LLV,stochSmo)/(summation(HHV-LLV,stochSmo)+0.0001)*100
    X = 0.1 * (RBWStoch-50)
    IFTStoch = ((Exp(2*X)-1) / (Exp(2*X)+1)+1)*50
End Function
'-------------------------------------------------------------------------------------
'INDICATOR PLOT:
sub IFTStoch_IND(avgLen,stochLen,stochSmo,AvgType)
    'defaults: Price = C,avgLen = 2,stochLen = 30,stochSmo = 5,AvgType = 3
    'simple averaging: AvgType = 1
    'weighted averaging: AvgType = 2
    'exponential averaging: AvgType = 3
    plot1(IFTStoch(C,avgLen,stochLen,stochSmo,AvgType))
    plot2(30)
    plot3(70)
End Sub
'--------------------------------------------------------------------------------------
'AUTHOR'S TRADING SYSTEM CODE:
Sub SVE_STOCH_IFT_SYS(avgLen,stochLen,stochSmo,AvgType)
    'defaults: Price = C,avgLen = 2,stochLen = 30,stochSmo = 5,AvgType = 3
    'simple averaging: AvgType = 1
    'weighted averaging: AvgType = 2
    'exponential averaging: AvgType = 3
    Dim myIFTStoch As BarArray
    myIFTStoch = IFTStoch(C,avgLen,stochLen,stochSmo,AvgType)
    If myIFTStoch > 30 Then Buy("LE",1,0,Market,Day)
    If myIFTStoch < 60 Then ExitLong("LX","",1,0,Market,Day)
    If myIFTStoch < 60 And C < Average(C,165) Then Sell("SE",1,0,Market,Day)
    If myIFTStoch > 30 Then ExitShort("SX","",1,0,Market,Day)
End Sub
'---------------------------------------------------------------------------------------

STRATASEARCH: INVERSE FISHER TRANSFORM STOCHASTIC OSCILLATOR
While this month’s article by Sylvain Vervoort provides multiple ways of using the inverse Fisher transform stochastic oscillator (IFTStoch) as a confirmation indicator, we decided to use Vervoort’s suggested implementation as a primary indicator. As it turns out, this implementation shows great promise.
Running it against the NASDAQ 100 stocks from 2000 to present, the IFTStoch beat the NASDAQ 100 index benchmark with nearly every parameter set we tried. This is a good sign, as it shows the system is robust. Nevertheless, the system suffered from two very important weaknesses. First, the percentage of profitable trades never rose above 50%. And second, the system suffered major drawdowns during bear market periods (2000–02 and 2008).
To solve these problems, we first added a market-level filter to prevent trading during bear markets. Next, we ran an automated search for supporting trading rules to run alongside the IFTStoch. The combination of these two enhancements drastically decreased the drawdowns and helped identify a variety of systems with percentage of profitable trades above 50%. In short, the IFTStoch is a great foundation, but can do much better with the help of some effective supporting indicators.
StrataSearch users wishing to explore the IFTStoch even further can download a plugin from the Shared Area of the StrataSearch user forum. After installing the plugin, users can run an automated search for supporting indicators to see just how well the IFTStoch can perform.
See Figure 9 for a sample chart.
//************************************************
// Inverse Fisher Transform Stochastic Oscillator
//************************************************
stochper = parameter("Stoch Period");
slowing = parameter("Stoch Slowing");
MA=Mov(C,2,W); RBW=5*MA;
MA=Mov(MA,2,W); RBW=RBW+4*MA;
MA=Mov(MA,2,W); RBW=RBW+3*MA;
MA=Mov(MA,2,W); RBW=RBW+2*MA;
MA=Mov(MA,2,W); RBW=RBW+MA;
MA=Mov(MA,2,W); RBW=RBW+MA;
MA=Mov(MA,2,W); RBW=RBW+MA;
MA=Mov(MA,2,W); RBW=RBW+MA;
MA=Mov(MA,2,W); RBW=RBW+MA;
MA=Mov(MA,2,W); RBW=(RBW+MA)/20;
RBWStoch=(Sum(RBW- low(RBW, stochper ) , slowing ) /
(Sum(high(RBW,stochper)- low(RbW,stochper),slowing)+0.0001)*100);
x = .1*(RBWStoch-50);
IFTStoch=((Exp(2*x)-1)/(Exp(2*x)+1)+1)*50;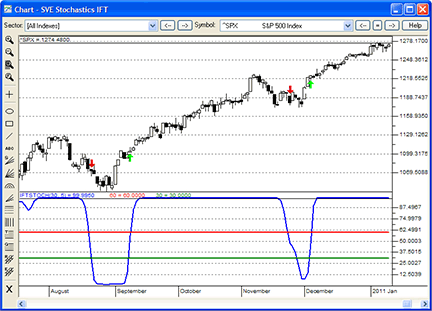
FIGURE 9: STRATASEARCH, INVERSE FISHER TRANSFORM STOCHASTIC OSCILLATOR (IFTSTOCH). A buy is triggered when the IFTStoch (blue line) crosses above 30 (green line). A sell is triggered when the IFTStoch crosses below 60 (red line).

NINJATRADER: FISHER TRANSFORM STOCHASTIC OSCILLATOR
The SveStochATS and the SveStochIFT indicators, as introduced in Sylvain Vervoort’s article in this issue (“Applying the Put/Call Ratio Indicator”), have now been implemented as an automated strategy and indicator available for download at www.ninjatrader.com/SC/June2011SC.zip.
Once you have downloaded it, from within the NinjaTrader Control Center window, select the menu File → Utilities → Import NinjaScript and select the downloaded file. This file is for NinjaTrader version 7 or greater.
You can review the strategy source code by selecting the menu Tools → Edit NinjaScript → Strategy from within the NinjaTrader Control Center window and selecting “SveStochATS.”
You can review the indicator source code by selecting the menu Tools → Edit NinjaScript → Indicator from within the NinjaTrader Control Center window and selecting “SveStochIFT.”
A sample chart implementing the SveStochIFT strategy is shown in Figure 10.
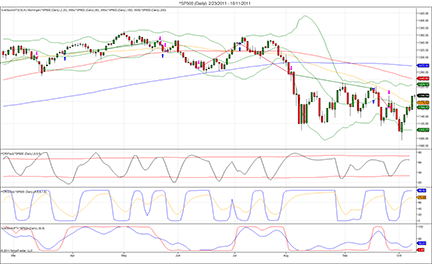
FIGURE 10: NINJATRADER, INVERSE FISHER TRANSFORM STOCHASTIC OSCILLATOR. This screenshot shows Sylvain Vervoort’s SveStochATS and related indicators, applied to a daily chart of the S&P 500 index (∧SP500).

TRADE NAVIGATOR: FISHER TRANSFORM STOCHASTIC OSCILLATOR
Trade Navigator users can use the TradeSense programming language to recreate the indicators introduced in Sylvain Vervoort’s article in this issue, “Applying The Put/Call Ratio Indicator.” The TradeSense code and step-by-step instructions are as follows:
First, open the Trader’s Toolbox, click on the Functions tab and click the New button.
Type in the following code for the inverse Fisher stochastic oscillator:
&ma1 := MovingAvgW (Close , 2)
&ma2 := MovingAvgW (&ma1 , 2)
&ma3 := MovingAvgW (&ma2 , 2)
&ma4 := MovingAvgW (&ma3 , 2)
&ma5 := MovingAvgW (&ma4 , 2)
&ma6 := MovingAvgW (&ma5 , 2)
&ma7 := MovingAvgW (&ma6 , 2)
&ma8 := MovingAvgW (&ma7 , 2)
&ma9 := MovingAvgW (&ma8 , 2)
&ma10 := MovingAvgW (&ma9 , 2)
&RBw := &ma1 * 5 + &ma2 * 4 + &ma3 * 3 + &ma4 * 2 + &ma5 + &ma6 + &ma7 + &ma8 + &ma9 + &ma10
&rainb := &RBw / 20
&RBWStoch := (MovingSum (&rainb - Lowest (&rainb , stochper) , slowing) / MovingSum (Highest (&rainb , stochper) - Lowest (&rainb , stochper) , slowing) + 0.0001) * 100
&x := 0.1 * (&RBWStoch - 50)
&IFTStoch := ((Power (2 , 2 * &x) - 1) / (Power (2 , 2 * &x) + 1) + 1) * 50
&IFTStoch
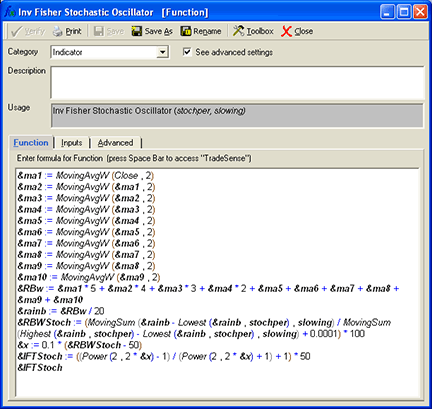
Click the Verify button.
The Add inputs window will pop up. Click “Add.” Change the values to the following:
stochper = 30
slowing = 10
When you are finished, click on the Save button, type a name for your new function, and click OK.
Creating a chart
Now that we have the function created, go to a daily chart and go to the Add to Chart window by clicking on the chart and typing A on the keyboard.
Click on the Indicators tab, find the Inv Fisher Stochastic Oscillator indicator in the list and either doubleclick on it or highlight the name and click the Add button.
Highlight the indicator and change it to the desired color in the chart settings window.
Click the Add button at the bottom of the Chart Settings window and select “Add Indicator – Add Indicator to Selected Pane.”
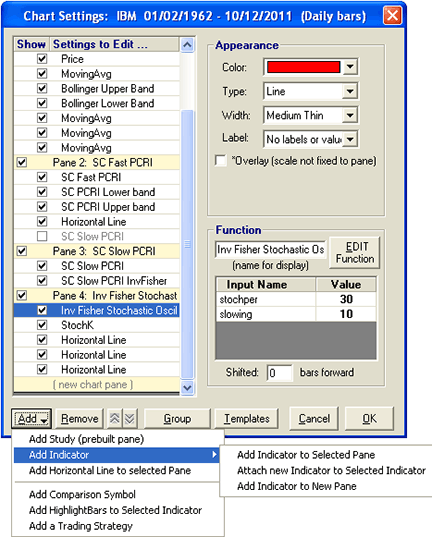
Scroll down, find and highlight the StochK, then click “Add.” Change the values for the StochK to:
Bars used in calculation = 30
%K smoothing = 5
Click the Add Button again and select “Add Horizontal Line” to selected Pane. Repeat to add two more horizontal lines. Set the horizontal lines to:
Value = 20
Value = 50
Value = 80
Click OK.
When you have them the way you want to see them, click on the Inv Fisher Stochastic Oscillator pane to highlight everything in that pane. Click on the Save Study button. Type “Inv Fisher Stochastic Oscillator” for the name and type a description if desired. Click Save.
You now have a study that you can add to any chart by typing the hot key “A” and selecting the study from the Studies tab.
In addition, Genesis Financial Technologies has provided a library called “SC Applying the PCRI,” which includes a template named “SC Applying the PCRI.” The template contains the custom indicator for Vervoort’s article as well as the indicators for Vervoort’s article from last month, which was the second part of the article series. You can download the file named “SC201112” from within Trade Navigator to get this library.
A sample chart is shown in Figure 11.
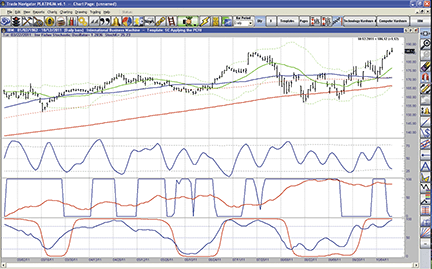
FIGURE 11: TRADE NAVIGATOR, INVERSE FISHER TRANSFORM STOCHASTIC OSCILLATOR

UPDATA: FISHER TRANSFORM STOCHASTIC OSCILLATOR
This tip is based on “Applying The Put/Call Ratio Indicator” by Sylvain Vervoort in this issue, which is the third and final article in his series.
This time, Vervoort presents a stochastic oscillator based on the inverse Fisher transform as applied to iteratively smoothed raw prices. Taken with the other indicators that Vervoort presented in this three-part series, a method of trade entry and exit is now provided.
Updata’s version of the indicator code has been generalized to allow for any number of rainbow average iterations.
The Updata code for this indicator (as well as for the other indicators described in this article series) has been provided in the Updata Library. It may be downloaded by clicking the custom menu and then clicking on either library. Those who cannot access the library due to a firewall may paste the code shown below into the Updata custom editor and save it.
A sample chart is shown in Figure 12.
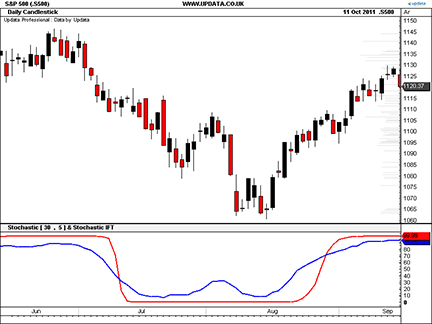
FIGURE 12: UPDATA, INVERSE FISHER TRANSFORM STOCHASTIC OSCILLATOR. Here, the inverse Fisher transform stochastic oscillator is applied to the daily S&P 500 index from May 2004.
'Inverse Fisher Transform Stochastic Oscillator
PARAMETER "Stochastic Period" #StochPeriod=30
PARAMETER "Stochastic Slowing" #StochSlowing=5
PARAMETER "RnBw Iterations" #Iteration=10
PARAMETER "Avg Period" #AvgPeriod=2
DISPLAYSTYLE 2LINES
INDICATORTYPE CHART
PLOTSTYLE THICK2 RGB(255,10,10)
PLOTSTYLE2 THICK2 RGB(10,10,255)
NAME "Stochastic [" #StochPeriod "," #StochSlowing "] & Stochastic IFT" ""
'Initialise Variables Assigned In Loop
@MovAvg=0
@RnBwAvg=0
@RnBwStoch=0
#i=0
#j=0
#x=0
@IFTStoch=0
@Stochastic=0
#SeriesSum=0
FOR #CURDATE=0 TO #LASTDATE
   For #i=0 TO (#Iteration-1)
      if #i=0
         #j=(#Iteration/2)
         @MovAvg=Sgnl(Close,#AvgPeriod,W)
         @RnBwAvg=#j*@MovAvg
      else
         #j=#j-1
         @MovAvg=Sgnl(@MovAvg,#AvgPeriod,W)
         @RnBwAvg=@RnBwAvg+Max(1,#j)*@MovAvg
      endif
   Next
   'Series Sum of 1+2+3+4+5....
   #SeriesSum=(1+#Iteration)*(#Iteration/2)+#Iteration
   @RnBwAvg=(@RnBwAvg+@MovAvg)/#SeriesSum
   @RnBwStoch=100*Sgnl(@RnBwAvg-PLow(@RnBwAvg,#StochPeriod),#StochSlowing,M)*#StochSlowing/(Sgnl(PHigh(@RnBwAvg,#StochPeriod)-PLow(@RnBwAvg,#StochPeriod),#StochSlowing,M)*#StochSlowing+0.001)
   #x=0.1*(@RnBwStoch-50)
   @IFTStoch=50*((Exp(2*#x)-1)/(Exp(2*#x)+1)+1)
   @Stochastic=StochD(#StochPeriod,#StochSlowing,M)
   @Plot=@IFTStoch
   @Plot2=@Stochastic
NEXT

VT TRADER: FISHER TRANSFORM STOCHASTIC OSCILLATOR
Our Traders’ Tip this month is based on “Applying The Put/Call Ratio Indicator” by Sylvain Vervoort in this issue. In this third part of Vervoort’s three-part series, he introduces the inverse Fisher transform stochastic oscillator (called the “SVE_Stoch_IFT”). Vervoort goes on to describe two trading systems that incorporate the SVE_Stoch_IFT indicator.
We’ll be offering the inverse Fisher transform stochastic oscillator for download in our VT client forums at https://forum.vtsystems.com along with hundreds of other precoded and free indicators and trading systems.
The step-by-step instructions and formula code are as follows:
- VT Trader’s Ribbon→Technical Analysis menu→Indicators group→Indicators Builder→[New] button
- In the General tab, type the following text into each corresponding text box:
Name: TASC - 12/2011 - Inverse Fisher Transform Stochastic Oscillator
Function Name Alias: tasc_SVE_Stoch_IFT
Label Mask: Inverse Fisher Transform Stochastic Oscillator (%stochper%,%slowing%) = %IFTStoch%
Placement: New Frame
Data Inspection Alias: SVE_Stoch_IFT
- In the Input Variable(s) tab, create the following variables:
[New] button...
Name: stochper
Display Name: Stochastic Osc. Periods
Type: integer
Default: 30

[New] button...
Name: slowing
Display Name: Stochastic Osc. Slowing Periods
Type: integer
Default: 5
- In the Output Variable(s) tab, create the following variables:
[New] button...
Var Name: IFTStoch
Name: (IFTStoch)
Line Color: dark blue
Line Width: slightly thicker
Line Type: solid
- In the Horizontal Line tab, create the following horizontal lines:
[New] button...
Value: +70
Line Color: red
Line Width: thin
Line Type: dashed

[New] button...
Value: +50
Line Color: gray
Line Width: thin
Line Type: dashed

[New] button...
Value: +30
Line Color: red
Line Width: thin
Line Type: dashed
- In the Formula tab, copy and paste the following formula:
{Provided By: Capital Market Services, LLC & Visual Trading Systems, LLC} {Copyright: 2011} {Description: TASC, December 2011 - Applying the Put/Call Ratio Indicator (part 3 or 3)" by Sylvain Vervoort} {File: tasc_SVE_Stoch_IFT.vtscr - Version 1.0} MA:= Mov(C,2,W); RBW:=5*MA; MA:= Mov(MA,2,W); RBW:=RBW+4*MA; MA:= Mov(MA,2,W); RBW:=RBW+3*MA; MA:= Mov(MA,2,W); RBW:=RBW+2*MA; MA:= Mov(MA,2,W); RBW:=RBW+MA; MA:= Mov(MA,2,W); RBW:=RBW+MA; MA:= Mov(MA,2,W); RBW:=RBW+MA; MA:= Mov(MA,2,W); RBW:=RBW+MA; MA:= Mov(MA,2,W); RBW:=RBW+MA; MA:= Mov(MA,2,W); RBW:=(RBW+MA)/20; RBWStoch:= (Sum(RBW-LLV(RBW,stochper),slowing)/ (Sum(HHV(RBW,stochper)- LLV(RbW,stochper),slowing)+0.0001)*100); x:= 0.1*(RBWStoch-50); IFTStoch:= ((Exp(2*x)-1)/(Exp(2*x)+1)+1)*50; - Click the “Save” icon in the toolbar to finish building the inverse Fisher transform stochastic oscillator.
To attach the indicator to a chart, click the right mouse button within the chart window and then select “Add Indicator” → “TASC - 12/2011 - Inverse Fisher Transform Stochastic Oscillator” from the indicator list.
A sample chart is shown in Figure 13.
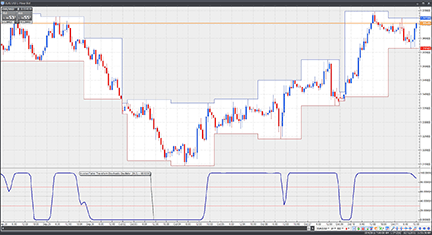
FIGURE 13: VT TRADER, INVERSE FISHER TRANSFORM STOCHASTIC OSCILLATOR. Here, the SVE_Stoch_IFT indicator is attached to a EUR/USD one-hour candlestick chart.
Risk disclaimer: Past performance is not indicative of future results. Forex trading involves a substantial risk of loss and may not be suitable for all investors.
MICROSOFT EXCEL: FISHER TRANSFORM STOCHASTIC OSCILLATOR
In this issue, Sylvain Vervoort presents the third article of his three-part series. This time, he adds Bollinger Bands and stochastics to our indicator toolbox and then describes trading scenarios using the tools developed over the course of the three articles.
The Microsoft Excel workbook I based on this article extends the foundation developed in the Excel workbook I built for Vervoort’s previous article in the November 2011 issue. This workbook adds the Bollinger Band, the stochastic, and the SVE_Stochastic_IFT calculations, and also plots the 50-, 100-, and 20-day simple moving averages of the close.
See the “transactions” tab in the workbook for a very simple simulation of Vervoort’s SVE_Stoch_IFT trading system using the rule set provided in the article. A sample chart is shown in Figure 14.
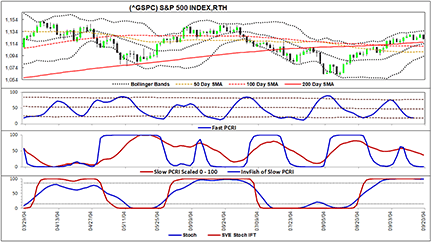
FIGURE 14: MICROSOFT EXCEL, PUT/CALL RATIO STOCHASTIC INDICATORS
For those who would like to set the beginning and ending points on the chart based on specific dates within the available input data, use the CalculationsAndCharts tab, cells C23:C24, to specify your target dates. Cells D23:D24 calculate the corresponding “offset” and “points to plot” values that you should then enter into cells A11:A12 to set the charts to window the data for the time frame you wish to see.
The Excel file “ApplyingThePutCallRatioIndicator.xls” is available for download here.

METASTOCK: INVERSE FISHER TRANSFORM STOCHASTIC OSCILLATOR — VERVOORT ARTICLE CODE
Can the put/call ratio and open interest be used to build a leading indicator? Yes, it can. In part 1, I defined the put/call ratio. In the second part of this three-part series, I discussed how you can create the put/call ratio indicator (PCRI). Now, here’s how you can apply the three put/call ratio indicators.
Metastock formula for inverse fisher transform stochastic oscillator
{SVE_Stoch_IFT}
stochper := Input("Stochastic Period?",2,100,30);
slowing:= Input("Stochastic Slowing?",1,10,5);
MA:=Mov(C,2,W); RBW:=5*MA;
MA:=Mov(MA,2,W); RBW:=RBW+4*MA;
MA:=Mov(MA,2,W); RBW:=RBW+3*MA;
MA:=Mov(MA,2,W); RBW:=RBW+2*MA;
MA:=Mov(MA,2,W); RBW:=RBW+MA;
MA:=Mov(MA,2,W); RBW:=RBW+MA;
MA:=Mov(MA,2,W); RBW:=RBW+MA;
MA:=Mov(MA,2,W); RBW:=RBW+MA;
MA:=Mov(MA,2,W); RBW:=RBW+MA;
MA:=Mov(MA,2,W); RBW:=(RBW+MA)/20;
RBWStoch:=(Sum(RBW-LLV(RBW,stochper),slowing)/(Sum(HHV(RBW,stochper)- LLV(RbW,stochper),slowing)+0.0001)*100);
x:= .1*(RBWStoch-50);
IFTStoch:=((Exp(2*x)-1)/(Exp(2*x)+1)+1)*50;
IFTStoch