INDICATORS
Part 3 Of 3
Applying The Put/Call Ratio Indicator 
In this third part of the series, you will find a trading method based on using the three put/call ratio indicators introduced in part 2.
Can the put/call ratio and open interest be used to build a leading indicator? Yes, it can. In part 1, I defined the put/call ratio. In the second part of this three-part series, I discussed how you can create the put/call ratio indicator (Pcri). Now, here’s how you can apply the three put/call ratio indicators.
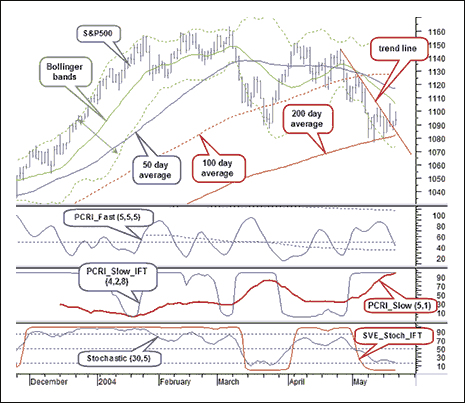
Figure 1 shows my charting template for trading based on the put/call ratio indicators. The window at the top holds the Standard & Poor’s 500 daily data with three simple moving averages: 50 days (blue), 100 days (red dashed), and 200 days (red). These are typical averages useful as dynamic support and resistance levels. For the shorter-term dynamic support and resistance, I am using standard 20-period Bollinger Bands. Finally, I will be using support and resistance levels and trendlines in this window to look for line breaks.

Figure 1: the pcri chart trading template. Here you see the chart of the S&P 500 with the 50-day, 100-day, and 200-day average. You also see the 20-period Bollinger Bands. The subcharts display the fast and slow put/call ratio indicator and the inverse Fisher transform of the slow PCRI.
The second and third windows display the fast and slow put/call ratio indicator and the inverse Fisher transform of the slow Pcri. These were discussed in the first and second parts of this series. In the fourth window, I use a standard stochastic 30-period oscillator with a five-day slowdown. In the same window you can see a smoothed inverse Fisher transform stochastic. This will help you stay in a trade or ultimately get you out of one if other signals fail.