TRADING TECHNIQUES
A Series Of Indicators Used As One
Trade Breakouts And Retracements With TMV 
Making good trading decisions involves finding indicators that cut through the market noise. But how do you do it without collapsing under the weight of information?
Chart analysis is a multidimensional affair; no single indicator can tell the entire story. After spending years cluttering my screen with multiple indicators, I discovered that more is not necessarily better because they sometimes present conflicting information. Often, it takes longer to analyze the information needed to make decisions.
The goal is to integrate the knowledge that indicators provide in order to evaluate the situation that leads to making good trading decisions. That means each trader needs to find those indicators that cut through the market news (and noise) in a way that makes most sense to him or her without collapsing from information overload. Here’s a method I have found useful.
The first step is to determine the categories from which to draw the indicators. For me, that includes trend, momentum, volatility, and volume (TMV). These present a multi-dimensional view of price behavior to supply a more complete picture.
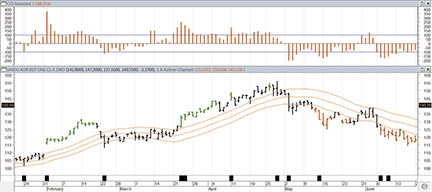
The second step is to determine which indicators in those categories best fit our own personal trading styles. The TMV indicators I use are taken from technical tools found in most major charting packages: Keltner channels, the commodity channel index (CCI), the average directional movement index (ADX), and a volume oscillator. When combined, they reduce the clutter and offer the most bang for the informational buck (Figure 1).

FIGURE 1: TREND, MOMENTUM, VOLATILITY AND VOLUME. The template on this daily chart of BIDU exemplifies the trend, momentum, volatility, and volume (TMV) indicators chosen for this article. The CCI occupies the upper panel, Keltner channels are on the price bars, and a volume oscillator identifies volume spikes, which are presented as black bars in the narrow panel below price. A rising ADX in relation to a short-term moving average causes the price bars to turn green or red.
The third and final step is to apply the chosen TMV indicators to trading. Because my preference is to trade in the direction of a trend, my examples will show how the indicators can be applied to trading price breakouts and retracements using either intraday or end-of-day data.
Volatility and trend
The Keltner channels overlaid on price serve to identify both trend and volatility. Originally known as the 10-day moving average trading rule, Keltner channels were developed more than 50 years ago by Chester Keltner. In his formulation, the middle channel line was based on a 10-day simple moving average of the typical price (high+low+close/3) rather than the closing price.