TRADERS’ TIPS
February 2012
Here is this month’s selection of Traders’ Tips, contributed by various developers of technical analysis software to help readers more easily implement some of the strategies presented in this and other issues.
Other code appearing in articles in this issue is posted in the Subscriber Area of our website at https://technical.traders.com/sub/sublogin.asp. Login requires your last name and subscription number (from mailing label). Once logged in, scroll down to beneath the “Optimized trading systems” area until you see “Code from articles.” From there, code can be copied and pasted into the appropriate technical analysis program so that no retyping of code is required for subscribers.
You can copy these formulas and programs for easy use in your spreadsheet or analysis software. Simply “select” the desired text by highlighting as you would in any word processing program, then use your standard key command for copy or choose “copy” from the browser menu. The copied text can then be “pasted” into any open spreadsheet or other software by selecting an insertion point and executing a paste command. By toggling back and forth between an application window and the open web page, data can be transferred with ease.
This month’s tips include formulas and programs for:
- TRADESTATION: TREND, MOMENTUM, VOLATILITY, AND VOLUME (TMV)
- BLOOMBERG: TREND, MOMENTUM, VOLATILITY, AND VOLUME (TMV)
- THINKORSWIM.COM: TREND, MOMENTUM, VOLATILITY, AND VOLUME (TMV)
- eSIGNAL: TREND, MOMENTUM, VOLATILITY, AND VOLUME (TMV)
- WORDEN BROTHERS TC2000: TREND, MOMENTUM, VOLATILITY, AND VOLUME (TMV)
- WEALTH-LAB: TREND, MOMENTUM, VOLATILITY, AND VOLUME (TMV)
- AMIBROKER: TREND, MOMENTUM, VOLATILITY, AND VOLUME (TMV)
- NEUROSHELL TRADER: TREND, MOMENTUM, VOLATILITY, AND VOLUME (TMV)
- AIQ: TREND, MOMENTUM, VOLATILITY, AND VOLUME (TMV)
- TRADERSSTUDIO: TRADE BREAKOUTS AND RETRACEMENTS WITH TMV
- NINJATRADER: TREND, MOMENTUM, VOLATILITY, AND VOLUME (TMV)
- TRADECISION: TREND, MOMENTUM, VOLATILITY, AND VOLUME (TMV)
- TRADINGSOLUTIONS: TRADE BREAKOUTS AND RETRACEMENTS WITH TMV
- TRADE NAVIGATOR: TRADE BREAKOUTS AND RETRACEMENTS
- VT TRADER: TREND, MOMENTUM, VOLATILITY, AND VOLUME (TMV)
- TRADESIGNAL: TREND, MOMENTUM, VOLATILITY, AND VOLUME (TMV)
- METASTOCK: TREND, MOMENTUM, VOLATILITY, AND VOLUME (TMV) — STAR ARTICLE CODE

TRADESTATION: TREND, MOMENTUM, VOLATILITY, AND VOLUME (TMV)
In “Trade Breakouts And Retracements With TMV” in this issue, author Barbara Star describes the use of several common indicators to analyze market trend, momentum, volatility, and volume (TMV). These indicators include Keltner channels, the commodity channel index (CCI), the average directional movement index (ADX), and a volume oscillator.
EasyLanguage code for a combined indicator (all but CCI) is presented here. The indicator code plots the Keltner channel and colors the bars based on the ADX and the relationship of the bar’s closing price to an eight-bar simple moving average. It also plots a dot marker based on volume surges. Details of the conditions required for painting the bars and plotting the dot markers can be found in Star’s article.
The CCI can be plotted using the TradeStation built-in indicator called Comm Channel Index. Also shown here is some strategy code for a breakout strategy that enters long when CCI is greater than zero and the close is greater than the upper Keltner band; it enters short when CCI is less than zero and the close is less than the lower Keltner band. A long position is exited when price closes below the upper Keltner band or CCI goes below zero. A short position is exited when price closes above the lower Keltner band or CCI goes above zero.
To download the EasyLanguage code for the indicator and strategy, first navigate to the EasyLanguage FAQs and Reference Posts Topic in the EasyLanguage Support Forum (https://www.tradestation.com/Discussions/Topic.aspx?Topic_ID=47452), scroll down, and click on the link labeled “Traders’ Tips, TASC.” Then select the appropriate link for the month and year. The ELD filename is “_TMV.ELD.”
EasyLanguage code for the combined indicator (trend, momentum, volatility, and volume)

_TMV_Ind_TASC (Indicator)
{ TASC - February 2012 }
{ Trade Breakouts And Retracements With TMV }
{ Barbara Star, PhD }

inputs:
	PlotKeltner( true ),
         PlotColorBarsADX( true ),
	PlotVolOscMarkers( true ),
	Price( TypicalPrice ),
	KeltnerLength( 20 ),
	NumATRs( 1 ),
	ADXLength( 10 ),
	UpColor( Cyan ),
	DownColor( Red ),
	VolOscDotColor( Yellow ),
	DotOffsetTicks( 3 ),
	VolOscFastLen( 1 ),
	VolOscSlowLen( 20 ) ;

variables:
	OneTick( MinMove / PriceScale ),
	Avg( 0 ),
	Shift( 0 ),
	LowerBand( 0 ),
	UpperBand( 0 ),
	Trend_ADX( 0 ),
	BarColor( 0 ),
	Vol( 0 ),
	VolAvg( 0 ),
	VolOsc( 0 ) ;

Trend_ADX = ADX( ADXLength ) ;

if BarType >= 2 and BarType < 5 then
	VolAvg = Average( Volume, VolOscSlowLen )
else
	VolAvg = Average( Ticks, VolOscSlowLen ) ;


if PlotKeltner then
	begin
	Avg = Average( Price, KeltnerLength ) ;
	Shift = NumATRs * AvgTrueRange( KeltnerLength ) ;
	UpperBand = Avg + Shift ;
	LowerBand = Avg - Shift ;

	Plot1( UpperBand, "UpperBand" ) ;
	Plot2( LowerBand, "LowerBand" ) ;
	Plot3( Avg, "MidLine" ) ;
	end ;

{ Paint Bars based on ADX and 8 SMA }
if Trend_ADX > Trend_ADX[1] and PlotColorBarsADX then
	begin
	if Close > Average( Close, 8 ) then
		BarColor = UpColor
	else if Close < Average( Close, 8 ) then
		BarColor = DownColor ;
 	Plot4( High, "BarHigh", BarColor ) ;
	Plot5( Low, "BarLow", BarColor ) ;
	Plot6( Open, "BarOpen", BarColor ) ;
	Plot7( Close, "BarClose", BarColor ) ;
	end
else
	begin
	NoPlot( 4 ) ;
	NoPlot( 5 ) ;
	NoPlot( 6 ) ;
	NoPlot( 7 ) ;
	end ;

{ Volume Oscillator and Markers }
if PlotVolOscMarkers then
	begin
	VolOsc = VolumeOsc( VolOscFastLen,VolOscSlowLen ) ;
	if VolAvg > 0 then
		if VolOsc / VolAvg > 0.5 then
			Plot8( Low - DotOffsetTicks * OneTick,
			"VolOsc", VolOscDotColor ) ;
	end ;


_TMV_Strategy_TASC (Strategy)

{ TASC - February 2012 }
{ Trade Breakouts And Retracements With TMV }
{ Barbara Star, PhD }
[IntrabarOrderGeneration = false]

inputs:
	Price( TypicalPrice ),
	KeltnerLength( 20 ),
	NumATRs( 1 ),
	ADXLength( 10 ),
	CCILen( 13 ) ;

variables:
	MP( 0 ),
	MyCCI( 0 ),
	Avg( 0 ),
	Shift( 0 ),
	LowerBand( 0 ),
	UpperBand( 0 ),
	Trend_ADX( 0 ),
	TrendInd( 0 ) ;

MP = MarketPosition ;
Trend_ADX = ADX( ADXLength ) ;
MyCCI = CCI( CCILen ) ;
Avg = Average( Price, KeltnerLength ) ;
Shift = NumATRs * AvgTrueRange( KeltnerLength ) ;
UpperBand = Avg + Shift ;
LowerBand = Avg - Shift ;

if Trend_ADX > Trend_ADX[1] then
	begin
	if Close > Average( Close, 8 ) then
		TrendInd = 1
	else if Close < Average( Close, 8 ) then
		TrendInd = -1 ;
	end
else
	TrendInd = 0 ;

{ Entry }
if Close > UpperBand and MyCCI > 0 then
	Buy ( "TMV LE" ) next bar market ;

if Close < LowerBand and MyCCI < 0 then
	SellShort ( "TMV SE" ) next bar market ;


{ Exit }
if MP = 1 and ( MyCCI < 0 or Close < UpperBand ) then
	Sell ( "TMV LX" ) next bar market ;

if MP = -1 and ( MyCCI > 0 or Close > LowerBand ) then
	BuyToCover( "TMV SX" ) next bar market ;
The EasyLanguage code is also shown below. A sample chart is shown in Figure 1.
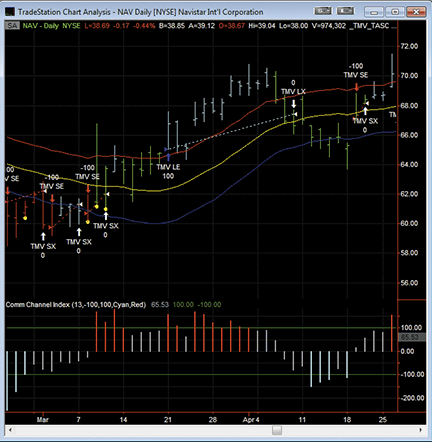
Figure 1: TRADESTATION, TMV INDICATORS. A daily chart of NAV is shown here along with the TMV indicators based on Barbara Star’s article in this issue. The red and cyan bars show the ADX and eight-bar SMA/close relationship described in Star’s article, and the yellow dot markers show Star’s volume surge criteria.
This article is for informational purposes. No type of trading or investment recommendation, advice, or strategy is being made, given, or in any manner provided by TradeStation Securities or its affiliates.

BLOOMBERG: TREND, MOMENTUM, VOLATILITY, AND VOLUME (TMV)
In this issue, author Barbara Star introduces a method of using multiple types of indicators together to gain a better overall picture of the market’s action. We have included a chart of NYMEX RBOB in a bull market from summer 2010 through spring 2011 (see Figure 2). This was a major bull run in that market, and the indicators in Star’s TMV trading template help confirm the strength of this trend.
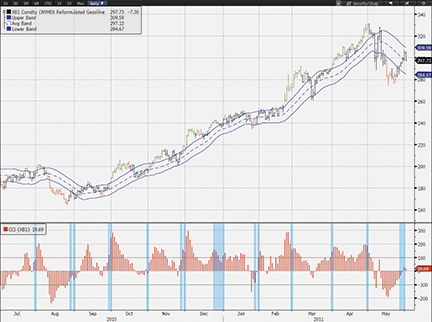
FIGURE 2: BLOOMBERG, PAINT BARS, KELTNER BANDS, AND CCI. Here is a daily bar chart showing RBOB unleaded gas from July 2010 through May 2011. The chart includes paint bars determined by ADX and an eight-period simple moving average, as well as Keltner bands around a 20-period simple moving average. The panel below the price chart combines a CCI output as a histogram, with overlaid rectangles based on the value of the volume oscillator included in the study code, but not actually output as part of the study.
In Figure 2, you can see that many of the green bars on the chart coinciding with bullish signals for each breakout above the channel are also accompanied by overlaid rectangles signaling that the volume oscillator component of the TMV is above its threshold setting, in this case a value of 50. During this period, the CCI rarely went below zero, continually reaching extreme highs over 200. You can see that the first time a major low in the CCI was realized in May 2011 — coinciding with the red bars below the lower channel band — began the change in the market to a consolidation mode.
Using the CS.NET framework within the STDY<GO> function on the Bloomberg Terminal, C# or Visual Basic code can be written to display the TMV trading template based on Star’s article. In addition to including all parts of the template in one indicator, we have chosen to overlay the rectangles on the CCI, since it allows the user to look in one place to see two of the components of the TMV. The C# code for this indicator is shown below.
All Bloomberg code contributions to Traders’ Tips can also be found in the sample files provided with regular SDK updates, and the studies will be included in the Bloomberg global study list.
BLOOMBERG CODE:

using System;
using System.Collections.Generic;
using System.Text;
using System.Drawing;
using Bloomberg.Study.API;
using Bloomberg.Study.CoreAPI;
using Bloomberg.Study.Util;
using Bloomberg.Study.TA;
using Bloomberg.Math;

namespace TMV
{

    public partial class TMV
    {
        // Allow changing of data source defaulting to the 'Typical Price' as defined in S&C Article
        public StudyPriceProperty KeltnerSource = new StudyPriceProperty(PriceType.HLCAvg);

        // Adding input for Keltner Period, defaulting to 20 as in text, not 13 as in code example window
        public StudyIntegerProperty KeltnerPeriod = new StudyIntegerProperty(20, 2, 500);

        // Adding input for ADX Period
        public StudyIntegerProperty ADXPeriod = new StudyIntegerProperty(10, 2, 500);

        // Allow user to change Volume Oscillator Threshold; author uses 50 as default, but also suggests
        // that this value can be raised to 75 at times, per user choice.
        public StudyIntegerProperty VolOscLevel = new StudyIntegerProperty(50);

        private void Initialize()
        {
            // Setup Keltner Bands to be output on chart
            Output.Add("UpperBand", new TimeSeries());
            StudyLine upper = new StudyLine("UpperBand", Color.Blue);
            upper.Style = LineStyle.Solid;
            upper.Width = 1;
            ParentPanel.Visuals.Add("UpperBand", upper);

            Output.Add("AvgBand", new TimeSeries());
            StudyLine avg = new StudyLine("AvgBand", Color.Blue);
            avg.Style = LineStyle.Dash;
            avg.Width = 1;
            ParentPanel.Visuals.Add("AvgBand", avg);

            Output.Add("LowerBand", new TimeSeries());
            StudyLine lower = new StudyLine("LowerBand", Color.Blue);
            lower.Style = LineStyle.Solid;
            lower.Width = 1;
            ParentPanel.Visuals.Add("LowerBand", lower);

            // Create Green Paintbar to signal ADX rising and close > MA
            Output.Add("GreenBar", new TimeSeries());
            StudySignal greenbar = new StudySignal("GreenBar");
            greenbar.Marker = new PaintBar(Color.Green);
            ParentPanel.Visuals.Add("GreenBar", greenbar);

            // Create Red Paintbar to signal ADX rising and close < MA
            Output.Add("RedBar", new TimeSeries());
            StudySignal redbar = new StudySignal("RedBar");
            redbar.Marker = new PaintBar(Color.Red);
            ParentPanel.Visuals.Add("RedBar", redbar);

            // Create panel "CCIPanel" that will display both the CCI
            // and the Rectangles superimposed on the histogram
            Panels.Add("CCIPanel", new StudyPanel());

            // Create CCI Line for output and add to panel
            Output.Add("CCI", new TimeSeries());
            StudyLine CCI = new StudyLine("CCI", Color.Red);
            CCI.Style = LineStyle.Histogram;
            Panels["CCIPanel"].Visuals.Add("CCI", CCI);

            // Add standard +100 and -100 horizontal lines to CCI
            StudyHorizontalLine Line100 = new StudyHorizontalLine(100, Color.Red, VisualLineStyle.Solid);
            Panels["CCIPanel"].Visuals.Add("pos100", Line100);
            StudyHorizontalLine Line100neg = new StudyHorizontalLine(-100, Color.Green, VisualLineStyle.Solid);
            Panels["CCIPanel"].Visuals.Add("neg100", Line100neg);

            // Create rectangle to be output on top of the CCI Histogram
            StudyRectangle voloscR = new StudyRectangle("VolOscRectangle", Color.DeepSkyBlue);
            Output.Add("VolOscRectangle", new MultiPointSeries(2));
            Panels["CCIPanel"].Visuals.Add("VolOscRectangle", voloscR);

            // Pull in Volume data to be used in the Volume Oscillator
            DataField volumeData = new DataField("PX_VOLUME");
            Input.Add("Volume", volumeData);
        }


        public override void Calculate()
        {
            // Keltner Channel
            TimeSeries keltnersource = Input[KeltnerSource.Value];
            TimeSeries volume = Input["Volume"];
            TimeSeries high = Input.High;
            TimeSeries low = Input.Low;
            TimeSeries close = Input.Close;
            TimeSeries KeltnerMA = Indicator.SMAvg(keltnersource, KeltnerPeriod.Value);
            TimeSeries Bandwith = Indicator.SMAvg((high - low), KeltnerPeriod.Value);
            TimeSeries KeltnerUpper = KeltnerMA + Bandwith;
            TimeSeries KeltnerLower = KeltnerMA - Bandwith;

            // Moving Average used to determine color of bars
            TimeSeries MA = Indicator.SMAvg(close, 8);

            // Create ADX to be used within code
            DMI adx = Indicator.DMI(high, low, close, ADXPeriod.Value);

            // Conditions for output. Using the above 'adx' that was built,
            // access the ADX output of the DMI indicator and confirm it is rinsing
            // then use in conjunction with MA to determine bar color
            TimeSeries Rising = adx.ADX.IsRising().And(close > MA);
            TimeSeries Falling = adx.ADX.IsRising().And(close < MA);

            // Create CCI to output
            TimeSeries cci = Indicator.CCI(keltnersource, KeltnerPeriod.Value);

            // Volume Oscillator & Rectangles
            int startIndex = 0;
            MultiPointSeries rectData = new MultiPointSeries(2);
            TimeSeries VolOsc = ((Indicator.SMAvg(volume, 20) - Indicator.SMAvg(volume, 1))
                    / Indicator.SMAvg(volume, 20) * 100);

            // Determine the indices where the Volume Oscillator crosses the specified level
            TimeSeries VolOscCrossAbove = VolOsc.IsCrossingAbove(VolOscLevel.Value);
            TimeSeries VolOscCrossBelow = VolOsc.IsCrossingBelow(VolOscLevel.Value);
            for (int ii = 0; ii < close.Count; ii++)
            {
                int endIndex = 0;
                if (VolOscCrossAbove[ii] == 1)
                {
                    startIndex = ii;
                }
                if (VolOscCrossBelow[ii] == 1)
                {
                    endIndex = ii - 1;

                    // Next find start and end points of rectangles along with
                    // setting top and bottom values of the rectangles.
                    // Top and bottom set to 1000 & -1000 on CCI scale in order to
                    // always have rectangle fill the bottom panel
                    // from top to bottom no matter the value of the CCI
                    ChartPoint rectStart = new ChartPoint(startIndex, 1000.0);
                    ChartPoint rectEnd = new ChartPoint(endIndex, -1000.0);
                    // Append this rectangle to the full list of rectangles
                    rectData.Append(new MultiPoint(rectStart, rectEnd));
                }
            }

            Output.Update("UpperBand", KeltnerUpper);
            Output.Update("AvgBand", KeltnerMA);
            Output.Update("LowerBand", KeltnerLower);
            Output.Update("GreenBar", Rising);
            Output.Update("RedBar", Falling);
            Output.Update("CCI", cci);
            Output.Update("VolOscRectangle", rectData);
        }

    }

}

THINKORSWIM.COM: TREND, MOMENTUM, VOLATILITY, AND VOLUME (TMV)
This month’s Traders’ Tip showcases the TMV indicator described by Barbara Star in her article in this issue, “Trade Breakouts And Retracements With TMV.” This compact study combines aspects of trend, momentum, volatility, and volume using several well-known and well-loved studies to give insight into a securities movement without unnecessary clutter (no paralysis by analysis!). By using a combination of channels, variable bar colors, and point indicators, the TMV study gives a large amount of information while saving valuable charting real estate (Figure 3).
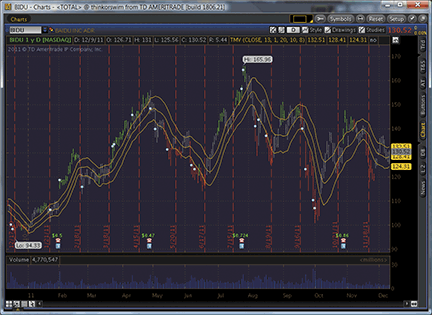
FIGURE 3: THINKORSWIM, TMV INDICATORS. By using a combination of channels, variable bar colors, and point indicators, the TMV study provides a large amount of information in a compact space.
The code for each study is shown here along with instructions for application.
- From our TOS charts, select Studies → Edit studies.
- Select the studies tab in the upper left-hand corner.
- Select New in the lower left-hand corner.
- Name the study (for example, “TMV”).
- Click in the script editor window, remove “plot Data = close;” and paste in the following code:
input price = close;
input KeltnerLength = 13;
input VolumeFastLength = 1;
input VolumeSlowLength = 20;
input ADXLength = 10;
input SMALength = 8;

def KeltnerSMA = Average(hlc3, KeltnerLength);
def AvgRange = Average(high - low, KeltnerLength);
def VolumeOsc = (Average(volume, VolumeFastLength) - Average(volume, VolumeSlowLength)) / Average(volume, VolumeSlowLength);
def ADX = reference ADX(length = ADXLength);
def SMA = Average(price, SMALength);

plot KeltnerHigh = KeltnerSMA + AvgRange;
plot KeltnerMid = KeltnerSMA;
plot KeltnerLow = KeltnerSMA - AvgRange;
plot VolumeSpike = VolumeOsc > 0.5;

KeltnerHigh.SetDefaultColor(GetColor(4));
KeltnerMid.SetDefaultColor(GetColor(4));
KeltnerLow.SetDefaultColor(GetColor(4));
VolumeSpike.SetDefaultColor(GetColor(1));
VolumeSpike.SetLineWeight(3);
VolumeSpike.SetPaintingStrategy(PaintingStrategy.BOOLEAN_POINTS);

DefineGlobalColor("Up", Color.UPTICK);
DefineGlobalColor("Neutral", Color.GRAY);
DefineGlobalColor("Down", Color.DOWNTICK);
AssignPriceColor( if ADX > ADX[1] and price > SMA then globalColor("Up") else if ADX > ADX[1] and price < SMA then globalColor("Down") else globalColor("Neutral"));
- Click OK, and you are good to go!

eSIGNAL: TREND, MOMENTUM, VOLATILITY, AND VOLUME (TMV)
For this month’s Traders’ Tip, we’ve provided two formulas, ADX_MA_Price_Relation.efs and Volume_Peaks.efs, based on the formula code from Barbara Star’s article in this issue, “Trade Breakouts And Retracements With TMV.” The article also makes use of the CCI and Keltner studies, which are common studies provided within the eSignal application. The CCI can be found as a built-in study or EFS under the Formulas\Built-in Studies\ folder. For the Keltner, please use QCharts_Keltner.efs found in the Formulas\Bands and Channels\ folder.
The ADX study contains formula parameters to set the values for the ADX period, ADX smoothing, MA period and MA type, which may be configured through the Edit Chart window (right-click on the chart and select Edit Chart). The volume peaks study also contains formula parameters (short volume average period, long volume average period, and level %) that may be customized through the Edit Chart window as well.
To discuss this study or download complete copies of the formula code, please visit the EFS Library Discussion Board forum under the forums link from the support menu at www.esignal.com or visit our EFS KnowledgeBase at www.esignal.com/support/kb/efs/. The eSignal formula scripts (EFS) are also available for copying and pasting below.
ADX_MA_Price_Relation.efs

/*********************************
Provided By:
    Interactive Data Corporation (Copyright © 2011)
    All rights reserved. This sample eSignal Formula Script (EFS)
    is for educational purposes only. Interactive Data Corporation
    reserves the right to modify and overwrite this EFS file with
    each new release.

Description:
    Trade Breakouts And Retracements With TMV

Version:            1.00  8/11/2011

Formula Parameters:                     Default:
ADX Period                              10
ADX Smoothing                           10
MA Period                               8
MA Type                                 Simple

Notes:
    The related article is copyrighted material. If you are not a subscriber
    of Stocks & Commodities, please visit www.traders.com.

**********************************/
var fpArray = new Array();

function preMain()
{
    setPriceStudy(true);

    setColorPriceBars(true);
    setDefaultPriceBarColor(Color.grey);

    setStudyTitle("ADX_MA_Price_Relation");

    var x=0;
    fpArray[x] = new FunctionParameter("adxPeriod", FunctionParameter.NUMBER);
    with(fpArray[x++])
    {
	setName("ADX Period");
	setLowerLimit(1);
        setUpperLimit(1000);
        setDefault(10);
    }

    fpArray[x] = new FunctionParameter("adxSmoothing", FunctionParameter.NUMBER);
    with(fpArray[x++])
    {
	setName("ADX Smoothing");
	setLowerLimit(1);
        setUpperLimit(1000);
        setDefault(10);
    }

    fpArray[x] = new FunctionParameter("maPeriod", FunctionParameter.NUMBER);
    with(fpArray[x++])
    {
	setName("MA Period");
	setLowerLimit(1);
        setUpperLimit(1000);
        setDefault(8);
    }

    fpArray[x] = new FunctionParameter("maType", FunctionParameter.STRING);
    with(fpArray[x++])
    {
	setName("MA Type");
        addOption("Simple");
        addOption("Exponential");
        addOption("Weighted");
        addOption("Volume Weighted");
        setDefault("Simple");
    }
}

var bInit = false;
var bVersion = null;

var xADX = null;
var xMA = null;

function main(adxPeriod, adxSmoothing, maPeriod, maType)
{
    if (bVersion == null) bVersion = verify();
    if (bVersion == false) return;

    if (!bInit)
    {
        switch (maType)
        {
            case "Simple" :
                xMA = sma(maPeriod);
                break;
            case "Exponential" :
                xMA = ema(maPeriod);
                break;
            case "Weighted" :
                xMA = wma(maPeriod);
                break;
            case "Volume Weighted" :
                xMA = vwma(maPeriod);
                break;
            default : return;
        }

        xADX = adx(adxPeriod, adxSmoothing);

        bInit = true;
    }

    var nMA = xMA.getValue(0);

    var nADX = xADX.getValue(0);
    var nnADX = xADX.getValue(-1);

    if (nMA == null || nADX == null)
        return;

    if (nADX > nnADX)
    {
        if (close(0) > nMA)
            setPriceBarColor(Color.green);
        else if (close(0) < nMA)
            setPriceBarColor(Color.red);
    }

    return;
}


// verify version
function verify() {
    var b = false;
    if (getBuildNumber() < 779) {
        drawTextAbsolute(5, 35, "This study requires version 8.0 or later.",
            Color.white, Color.blue, Text.RELATIVETOBOTTOM|Text.RELATIVETOLEFT|Text.BOLD|Text.LEFT,
            null, 13, "error");
        drawTextAbsolute(5, 20, "Click HERE to upgrade.@URL=https://www.esignal.com/download/default.asp",
            Color.white, Color.blue, Text.RELATIVETOBOTTOM|Text.RELATIVETOLEFT|Text.BOLD|Text.LEFT,
            null, 13, "upgrade");
        return b;
    } else {
        b = true;
    }
    return b;
}
Volume_Peaks.efs
/*********************************
Provided By:
    Interactive Data Corporation (Copyright © 2011)
    All rights reserved. This sample eSignal Formula Script (EFS)
    is for educational purposes only. Interactive Data Corporation
    reserves the right to modify and overwrite this EFS file with
    each new release.

Description:
    Trade Breakouts And Retracements With TMV

Version:            1.00  8/11/2011

Formula Parameters:                     Default:
Short Volume Average Period             1
Long Volume Average Period              20
Level, %                                50

Notes:
    The related article is copyrighted material. If you are not a subscriber
    of Stocks & Commodities, please visit www.traders.com.

**********************************/
var fpArray = new Array();

function preMain()
{
    setPriceStudy(true);

    setStudyTitle("Volume Peaks");

    setShowSeries(false, 0);

    var x=0;
    fpArray[x] = new FunctionParameter("shortVolPeriod", FunctionParameter.NUMBER);
    with(fpArray[x++])
    {
	setName("Short Volume Average Period");
	setLowerLimit(1);
        setUpperLimit(1000);
        setDefault(1);
    }

    fpArray[x] = new FunctionParameter("longVolPeriod", FunctionParameter.NUMBER);
    with(fpArray[x++])
    {
	setName("Long Volume Average Period");
	setLowerLimit(1);
        setUpperLimit(1000);
        setDefault(20);
    }

    fpArray[x] = new FunctionParameter("level", FunctionParameter.NUMBER);
    with(fpArray[x++])
    {
	setName("Level, %");
	setLowerLimit(1);
        setUpperLimit(100);
        setDefault(50);
    }
}

var bInit = false;
var bVersion = null;

var xShortVolAvg = null;
var xLongVolAvg = null;
var xVol = null;

function main(shortVolPeriod, longVolPeriod, level)
{
    if (bVersion == null) bVersion = verify();
    if (bVersion == false) return;

    if (!bInit)
    {
        xVol = volume();

        xShortVolAvg = sma(shortVolPeriod, xVol);
        xLongVolAvg = sma(longVolPeriod, xVol);

        bInit = true;
    }

    var nShortVolAvg = xShortVolAvg.getValue(0);
    var nLongVolAvg = xLongVolAvg.getValue(0);

    if (nLongVolAvg == null)
        return;

    var res = (nShortVolAvg - nLongVolAvg) * 100 / nLongVolAvg;

    if (res > level)
    {
        drawShape(Shape.TRIANGLE, BottomRow2, Color.red);

        setBarFgColor(Color.red, 0);

        return res;
    }

    return;
}


// verify version
function verify() {
    var b = false;
    if (getBuildNumber() < 779) {
        drawTextAbsolute(5, 35, "This study requires version 8.0 or later.",
            Color.white, Color.blue, Text.RELATIVETOBOTTOM|Text.RELATIVETOLEFT|Text.BOLD|Text.LEFT,
            null, 13, "error");
        drawTextAbsolute(5, 20, "Click HERE to upgrade.@URL=https://www.esignal.com/download/default.asp",
            Color.white, Color.blue, Text.RELATIVETOBOTTOM|Text.RELATIVETOLEFT|Text.BOLD|Text.LEFT,
            null, 13, "upgrade");
        return b;
    } else {
        b = true;
    }
    return b;
}
A sample chart is shown in Figure 4.
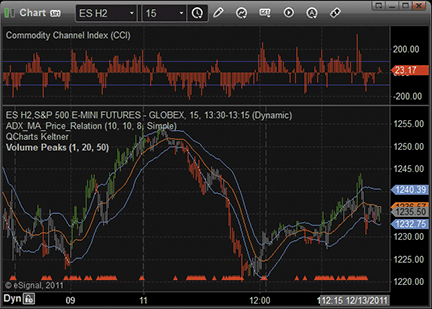
FIGURE 4: ESIGNAL, TMV INDICATORS

WORDEN BROTHERS TC2000: TREND, MOMENTUM, VOLATILITY, AND VOLUME (TMV)
You can combine the charting, scanning, and sorting features found in TC2000 version 12 to apply the TMV method discussed in Barbara Star’s article in this issue, “Trade Breakouts and Retracements with TMV.”
Figure 5 shows the results of a scan applied to the S&P 500 components to find stocks where ADX is rising, CCI is above its zero line, and price is above the upper Keltner channel. The scan returned 81 stocks that were in strong trends. The green and red checks in the watchlist columns tell you when price is above (green) or below (red) its eight-period moving average.
Note: Keltner channels in TC2000.com use the Raschke method, where channel width is a multiple of average true range. But the channels can also be plotted as described in Star’s article by adding a custom PCF channel indicator to the price pane. The indicator line formula for typical price is (H+L+C)/3 and the channel width formula is H-L, with the smoothing period set to 20.
The third watchlist column marks stocks where the percent volume oscillator (short period 1, long period 20) is spiking above 50, so you can see stocks with unusual volume activity like URBN and VMC.
Using the new alert monitoring service, you can be alerted when a stock passes a TMV scan; is breaking above the upper Keltner channel on unusual volume; is pulling back into the channel; and so on. You can set alerts on price or any indicator on the chart and have it monitored while you’re away from your computer. You can be alerted by email or text message sent to your mobile device. Alerts can be set on individual stocks or on lists of stocks.
For more information on TC2000 or to start a free trial, visit www.TC2000.com.
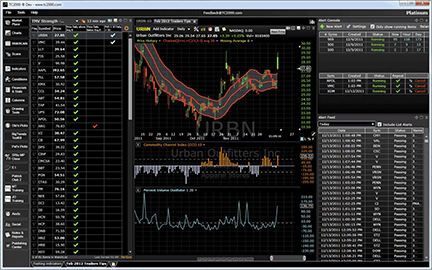
FIGURE 5: TC2000, TMV. A scan of the S&P 500 using the TMV upside scan returned 81 stocks. Sort columns in the watchlist show where price is above (green checks) and below (red checks) its eight-period SMA. A column for “percent volume oscillator > 50” marks stocks (in cyan) with unusually high volume, such as URBN and VMC in this example.

WEALTH-LAB: TREND, MOMENTUM, VOLATILITY, AND VOLUME (TMV)
Provided here is the C# code for Wealth-Lab 6 that plots the indicators and performs the color highlighting described by Barbara Star in her article in this issue, “Trade Breakouts And Retracements With TMV.”
The Wealth-Lab strategy is available for instant download from Wealth-Lab’s Open Strategy dialog. Keep in mind that the breakout and retracement opportunities suggested by the template are to be found in trending markets.
A sample chart implementation is shown in Figure 6.
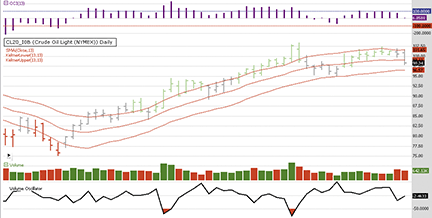
FIGURE 6: WEALTH-LAB, COLOR-CODED PRICE BARS. This sample Wealth-Lab 6.3 chart displays the highlighting according to the TMV template using daily data of crude oil futures. The bottom pane shows the volume oscillator (OscV) presented in Barbara Star’s article in this issue.
C# code:

using System;
using System.Collections.Generic;
using System.Text;
using System.Drawing;
using WealthLab;
using WealthLab.Indicators;

namespace WealthLab.Strategies
{
	public class TMV_1202Star : WealthScript
	{
		protected override void Execute()
		{
			DataSeries K1 = KeltnerLower.Series( Bars, 13, 13 );
			DataSeries K2 = KeltnerUpper.Series( Bars, 13, 13 );
			ADX adx = ADX.Series( Bars,10 );
			SMA sma = SMA.Series( Close,8 );
			DataSeries OscV =
				(SMA.Series( Volume,20 ) - Volume)/SMA.Series( Volume,20 ) * 100;
			OscV.Description = "Volume Oscillator";
			DataSeries cci = CCI.Series( Bars, 13 );

			ChartPane cPane = CreatePane( 30, true, true );
			ChartPane oPane = CreatePane( 30, false, true );
			SetBarColors( Color.DarkGray,Color.DarkGray );
			PlotSeries( PricePane, SMA.Series( Close,13 ), Color.Red, LineStyle.Solid, 1);
			PlotSeriesFillBand( PricePane, K1, K2, Color.Red, Color.Empty, 						LineStyle.Solid, 1);
			PlotSeriesOscillator( oPane, OscV, 50, -50, Color.Blue, Color.Red,
				Color.Empty, LineStyle.Histogram, 2);
			PlotSeries( oPane, OscV, Color.Black, LineStyle.Solid, 2);
			PlotSeries( cPane, cci, Color.Purple, LineStyle.Histogram, 3 );
			DrawHorzLine( cPane, -100, Color.Red, LineStyle.Dashed, 1 );
			DrawHorzLine( cPane, 100, Color.Blue, LineStyle.Dashed, 1 );

			for(int bar = GetTradingLoopStartBar(30); bar < Bars.Count; bar++)
			{
				bool adxPriceRising = adx[bar] > adx[bar-1] && Close[bar] > sma[bar];
				bool adxPriceFalling = adx[bar] > adx[bar-1] && Close[bar] < sma[bar];

				if( adxPriceRising )
					SetBarColor( bar, Color.LightGreen );
				else
					if( adxPriceFalling )
					SetBarColor( bar, Color.Red );
			}
		}
	}
}

AMIBROKER: TREND, MOMENTUM, VOLATILITY, AND VOLUME (TMV)
In “Trade Breakouts And Retracements With TMV” in this issue, author Barbara Star presents a simple trading template consisting of Keltner channels, CCI, and color-coded price bars.
A ready-to-use formula based on the article is presented here. To use it, enter the formula in the AFL Editor and then press the Insert Indicator button to see the chart. Right-click on the chart and select “parameters” to adjust the smoothing period.
Periods = Param("Periods", 13, 2, 300, 1 );

P = ( H + L + C )/3;

CenterLine = MA( P, Periods );
KTop = CenterLine + MA( H - L, Periods );
KBot = CenterLine - MA( H - L, Periods );

Plot( CenterLine, "MA" + _PARAM_VALUES(), colorRed );
Plot( KTop, "KBTop" + _PARAM_VALUES(), colorRed );
Plot( KBot, "KBBot" + _PARAM_VALUES(), colorRed );

Color = IIf( ADX( 10 ) > Ref( ADX( 10 ), -1 ) AND C < MA( C, 8 ), colorGreen,
IIf( ADX( 10 ) > Ref( ADX( 10 ), -1 ) AND C < MA( C, 8 ), colorRed, colorBlack ) );

Plot( C, "Price", Color, styleBar | styleThick );
A sample chart is shown in Figure 7.
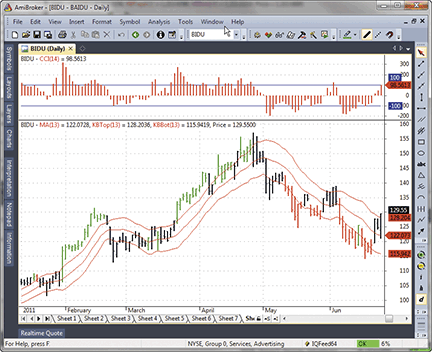
FIGURE 7: AMIBROKER, KELTNER CHANNEL AND CCI. Here is a daily chart of BIDU with a Keltner channel overlay and color-coded price bars in the lower pane and CCI in the upper pane.

NEUROSHELL TRADER: TREND, MOMENTUM, VOLATILITY, AND VOLUME (TMV)
The TMV indicators described by Barbara Star in her article in this issue, “Trade Breakouts And Retracements With TMV,” can be easily implemented with a few of NeuroShell Trader’s 800+ indicators. Simply select “New Indicator” from the Insert menu and use the Indicator Wizard to set up the following indicators:
Keltner channel middle line:
MovAvg( Divide( Add3( High, Low, Close), 3), 13)

Keltner channel upper line:
Add2( MovAvg( Divide( Add3( High, Low, Close), 3), 13), MovAvg(Sub( High, Low), 13) )

Keltner channel lower line:
Sub( MovAvg( Divide( Add3( High, Low, Close), 3), 13), MovAvg(Sub( High, Low), 13) )

ADX price rising:
And2( A>B( Momentum( ADX(High, Low, Close, 10, 10), 1), 0 ), A>B( Close, MovAvg(Close,8) ) )

ADX price falling:
And2( A>B( Momentum( ADX(High, Low, Close, 10, 10), 1), 0 ), A<B( Close, MovAvg(Close,8) ) )

	CCI
	CCI( High, Low, Close, 13, 0.015 )

Volume oscillator
Multiply2( 100, Sub(Divide(Volume, MovAvg(Volume,20)), 1) )
Users of NeuroShell Trader can go to the Stocks & Commodities section of the NeuroShell Trader free technical support website to download a copy of this or any previous Traders’ Tips.
A sample chart is shown in Figure 8.
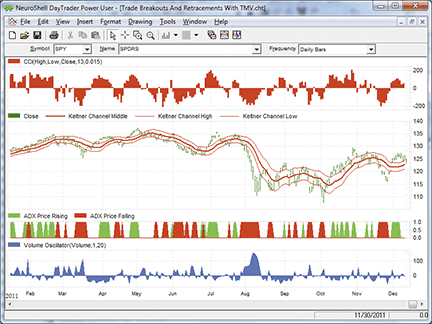
FIGURE 8: NEUROSHELL TRADER, ADX, CCI, AND KELTNER CHANNELS. This sample NeuroShell Trader chart shows the TMV indicators.

AIQ: TREND, MOMENTUM, VOLATILITY, AND VOLUME (TMV)
The AIQ code and EDS file based on Barbara Star’s article in this issue, “Trade Breakouts And Retracements With TMV,” is provided at www.TradersEdgeSystems.com/traderstips.htm. The code is also shown below.
!TRADE BREAKOUTS AND RETRACEMENTS WITH TMV
!Author: Barbara Star,PhD, TASC February 2012
!Coded by: Richard Denning 12/9/2011
!www.TradersEdgeSystems.com

!CODING ABREVIATIONS:
   C is [close].
   C1 is valresult(C,1).
   O is [open].
   H is [high].
   L is [low].
   H1 is valresult(H,1).
   L1 is valresult(L,1).
   V is [volume].

!KELTNER CHANNEL
   !INPUT:
      keltLen is 20.
   !KELTNER CHANNEL UDFs:
   typ is (H+L+C)/3.
   rangeAvg is simpleavg(H-L,keltLen).
   !Plot the following three functions on price chart
   !as three separte indicators:
      midKelt is simpleavg(typ,keltLen).
      upperKelt is midKelt + rangeAvg.
      lowerKelt is midKelt - rangeAvg.

!ADX
   !INPUT:
      WilderLen is 10.
      !NOTE: Wilder to expontential averaging the formula is:
        !Wilder length * 2 -1 = exponential averaging length

	!USED FOR DMI, ATR, ADX, ADX RATE
  	   avgLen is WilderLen * 2 - 1.

   !AVERAGE TRUE RANGE:
	TR  is Max(H-L,max(abs(C1-L),abs(C1-H))).
	ATR  is expAvg(TR,avgLen).
	ATRpct is expavg(TR / C,avgLen) * 100.

   !+DM -DM CODE:
	rhigh is (H-H1).
	rlow is (L1-L).
        DMplus is iff(rhigh > 0 and rhigh > rlow, rhigh, 0).
        DMminus is iff(rlow > 0 and rlow >= rhigh, rlow, 0).
	AvgPlusDM is expAvg(DMplus,avgLen).
        AvgMinusDM is expavg(DMminus,avgLen).

   !DMI CODE:
	PlusDMI is (AvgPlusDM/ATR)*100.	!PLOT  (2 lines)
	MinusDMI is AvgMinusDM/ATR*100.	!PLOT  (2 lines).
	DirMov is PlusDMI - MinusDMI.
	DirMovAIQ is [dirMov].

   !ADX INDICATOR as defined by Wells Wilder
     !PLOT DIdiff as historigram is same as DirMov (AIQ built in indicator):
	DIdiff is PlusDMI-MinusDMI.
        ZERO if PlusDMI = 0 and MinusDMI =0.
	DIsum is PlusDMI+MinusDMI.
	DX is iff(ZERO,100,abs(DIdiff)/DIsum*100).
     !PLOT ADX as single line indicator with support at 24:
	ADX is expavg(DX,avgLen).

!VOLUME OSCILLATOR:
   !INPUTS:
	volLen1 is 1.
	volLen2 is 20.
	pctChgLvl is 50.
   !VOLUME OSCILLATOR UDFs:
	volAvg1 is simpleavg(V,volLen1).
	volAvg2 is simpleavg(V,volLen2).
    	pctChgV is (volAvg1 / volAvg2 -1) * 100.
	volOsc  is iff(abs(pctChgV)>pctChgLvl,1,0). !PLOT

!CCI INDICATOR:
   !INPUTS:
	cciLen is 13.
   !CCI UDFs:
   	typAvg is simpleavg(typ,cciLen).
   	absdiff is abs(typ-typAvg).
   	sumD is sum(absdiff,cciLen)/ cciLen.
   	CCI is (typ - typAvg) / (0.015 * sumD). !PLOT WITH +100 -100 LINES

!COLOR BAR RULES:
   !INPUT:
	trndLen is 8.
   Green if ADX > valresult(ADX,1) and C > simpleavg(C,trndLen).
   Red if ADX > valresult(ADX,1) and C < simpleavg(C,trndLen).
Figure 9 shows a chart of Noble Energy along with the TMV indicators.
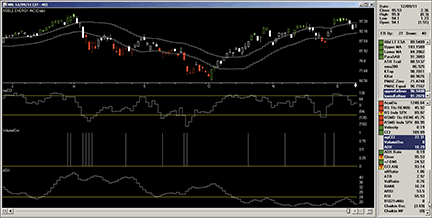
FIGURE 9: AIQ SYSTEMS, KELTNER CHANNELS, CCI, AND COLOR-CODED PRICE BARS. Here’s a sample chart of Noble Energy with the TMV indicators.

TRADERSSTUDIO: TRADE BREAKOUTS AND RETRACEMENTS WITH TMV
The TradersStudio code for Barbara Star’s article in this issue, “Trade Breakouts And Retracements With TMV,” is provided at www.TradersEdgeSystems.com/traderstips.htm. The download includes the following code files:
- Function: “VOLUME_OSC” computes the indicator values for the volume oscillator.
- Indicator Plot: “VOLUME_OSC_IND” for displaying the volume oscillator indicator.
- Indicator Plot: “theADX” for displaying the ADX indicator with a fixed level of 24.
- Indicator Plot: “KELTNER_BANDS” for displaying the Keltner bands.
- Indicator Plot: “TMV_COLOR_BAR_IND” for coloring the bars green or red per the author’s trend direction and ADX change criteria.
In Figure 10, I show a chart of the NASDAQ 100 ETF (QQQQ) from April to December 2006. During this period, we have both a downtrend and an uptrend.
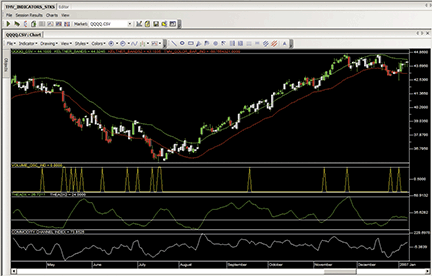
FIGURE 10: TRADERSSTUDIO, KELTNER CHANNELS, CCI, AND COLOR-CODED PRICE BARS. This chart shows the TMV indicators on a chart of QQQQ from April to December 2006.
The TradersStudio code is also shown here:
'TRADE BREAKOUTS AND RETRACEMENTS WITH TMV
'Author: Barbara Star,PhD, TASC February 2012
'Coded by: Richard Denning 12/9/2011
'www.TradersEdgeSystems.com

'-----------------------------------------------------
'VOLUME OSCILLATOR
Function VOLUME_OSC(volLen1,volLen2,pctChgLevel)
Dim volAvg1 As BarArray
Dim volAvg2 As BarArray
Dim pctChgV As BarArray
volAvg1 = Average(V,volLen1)
volAvg2 = Average(V,volLen2)
If volAvg2<>0 Then pctChgV = (volAvg1/volAvg2-1)*100
VOLUME_OSC = IIF(Abs(pctChgV)>pctChgLevel,1,0)
End Function
'-----------------------------------------------------
'VOLUME OSCILLATOR INDICATOR
Sub VOLUME_OSC_IND(volLen1,volLen2,pctChgLevel)
plot1(VOLUME_OSC(volLen1,volLen2,pctChgLevel))
End Sub
'-----------------------------------------------------
'ADX INDICATOR (CUSTOM)
sub theADX(adxLen)
plot1(adx(adxLen,0))
Plot2(24)
End Sub
'-----------------------------------------------------
'KELTNER BANDS
Sub KELTNER_BANDS(kLen)
Dim typ As BarArray
Dim avgRange As BarArray
Dim midKeltner As BarArray
Dim upperKeltner As BarArray
Dim lowerKeltner As BarArray
typ = (H+L+C)/3
avgRange = Average(H-L,kLen)
midKeltner = Average(typ,kLen)
upperKeltner = midKeltner + avgRange
lowerKeltner = midKeltner - avgRange
plot1(upperKeltner)
plot2(lowerKeltner)
End Sub
'-----------------------------------------------------
'TMV COLOR BAR INDICATOR
Sub TMV_COLOR_BAR_IND(adxLen,trendLen)
Dim myADX As BarArray
myADX = ADX(adxLen,0)
If myADX > myADX[1] And C > Average(C,trendLen) Then
    BarColor(0) = vbGreen
End If
If myADX > myADX[1] And C < Average(C,trendLen) Then
    BarColor(0) = vbRed
End If
End Sub
'-----------------------------------------------------

NINJATRADER: TREND, MOMENTUM, VOLATILITY, AND VOLUME (TMV)
The TMV trading template, as presented in “Trade Breakouts And Retracements With TMV” by Barbara Star in this issue, has been implemented as an indicator available for download at www.ninjatrader.com/SC/February2012SC.zip.
Once you have downloaded it, from within the NinjaTrader Control Center window, select the menu File → Utilities → Import NinjaScript and select the downloaded file. This file is for NinjaTrader version 7 or greater.
You can review the indicator source code by selecting the menu Tools → Edit NinjaScript → Indicator from within the NinjaTrader Control Center window and selecting TMV.
NinjaScript uses compiled DLLs that run native, not interpreted, which provides you with the highest performance possible.
A sample chart implementing the strategy is shown in Figure 11.
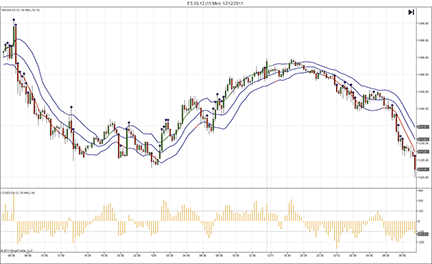
FIGURE 11: NINJATRADER, TREND, MOMENTUM, VOLATILITY, AND VOLUME (TMV). This sample NinjaTrader chart shows the TMV indicator applied to a 15-minute chart of emini S&P (ES 03–12).

TRADECISION: TREND, MOMENTUM, VOLATILITY, AND VOLUME (TMV)
The article by Barbara Star in this issue, “Trade Breakouts And Retracements With TMV,” demonstrates how to combine trend, momentum, volatility, and volume indicators to cut through the market noise. Since Tradecision does not support bar highlighting functionality, we developed a trading strategy to visualize the TMV technique that includes ADX and moving average movements.
Using Tradecision’s Indicator Builder, create the following indicators:
KELTNER indicator:
input
Length:"Number of Periods:", 13,2,500;
end_input

var
Keltner:=0;
end_var

Keltner:= Mov((H+L+C)/3,Length,S);

return Keltner;

KELTNER top:

input
Length:"Number of Periods:", 13,2,500;
end_input

var
Keltner:=0;
end_var

Keltner:= Mov((H+L+C)/3,Length,S)+ Mov((H-L),Length,S) ;

return Keltner;

KELTNER bottom:

input
Length:"Number of Periods:", 13,2,500;
end_input

var
Keltner:=0;
end_var

Keltner:= Mov((H+L+C)/3,Length,S) - Mov((H-L),Length,S) ;

return Keltner;

Volume Oscillator:

return iff(OSCV(1,20,S,PERCENT)>50,1,0);
Using Tradecision’s Strategy Builder, create the TMV strategy using the following formulas:
Entry Long:
return ADX(10)>ADX(10)\1\ AND C>Mov(C,8,S);

Exit Long:
return ADX(10)>ADX(10)\1\ AND C>Mov(C,8,S);

Entry Short:
return ADX(10)>ADX(10)\1\ AND C<=Mov(C,8,S);
To import the strategy into Tradecision, visit the area “Traders’ Tips from TASC Magazine” at www.tradecision.com/support/tasc_tips/tasc_traders_tips.htm or copy the code from above.
A sample chart is shown in Figure 12.
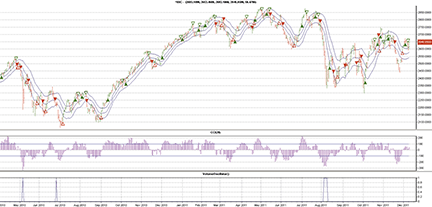
FIGURE 12: TRADECISION, NASDAQ COMPOSITE INDEX WITH THE TMV STRATEGY. The Keltner channel, commodity channel index, TMV strategy, and volume oscillator are plotted here on a daily ∧IXIC chart. The volume oscillator is above zero when its value is higher than 50%.

TRADINGSOLUTIONS: TRADE BREAKOUTS AND RETRACEMENTS WITH TMV
In “Trade Breakouts And Retracements With TMV” in this issue, author Barbara Star provides an overview of the indicators she uses for chart analysis.
These functions are described below in TradingSolutions formula language and are also available as a function file that can be downloaded from the TradingSolutions website (www.tradingsolutions.com) in the Free Systems section. As with many indicators, these functions could make good inputs to neural network predictions.
Function Name: Keltner Channel (Middle, Original Version)
Short Name: OrigKeltner Middle
Inputs: Close, High, Low, Period
MA (Typical (Close, High, Low), Period)

Function Name: Keltner Channel (Top, Original Version)
Short Name: OrigKeltner Top
Inputs: Close, High, Low, Period
Add (MA (Typical (Close, High, Low), Period), MA (Sub (High, Low), Period))

Function Name: Keltner Channel (Bottom, Original Version)
Short Name: OrigKeltner Bottom
Inputs: Close, High, Low, Period
Subtract (MA (Typical (Close, High, Low), Period), MA (Sub (High, Low), Period))

Function Name: ADX Price Rising
Short Name: ADXRising
Inputs: Close, High, Low
And (Inc (ADX (Close, High, Low, 10, 10)), GT (Close, MA (Close, 8)))

Function Name: ADX Price Falling
Short Name: ADXFalling
Inputs: Close, High, Low
And (Inc (ADX (Close, High, Low, 10, 10)), LT (Close, MA (Close, 8)))

Function Name: Volume Oscillator
Short Name: OscV
Inputs: Volume
GT (Osc (Volume, 1, 20, 1), 50)

TRADE NAVIGATOR: TRADE BREAKOUTS AND RETRACEMENTS
Trade Navigator offers everything needed for recreating the indicators discussed by author Barbara Star in “Trade Breakouts And Retracements With TMV” in this issue, and some of the indicators and highlight bars come standard with Trade Navigator.
You can recreate the custom indicators and highlight bars in Trade Navigator using the following TradeSense code.
First, open the Trader’s Toolbox, click on the Functions tab, and click the New button.
For the ADX price rising indicator, input the following code:
ADX price rising
ADX (10 , False) > ADX (10 , False).1 And Close > MovingAvg (Close , 8)
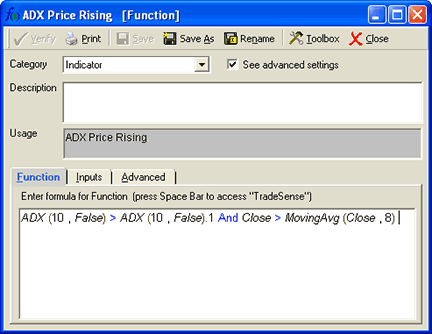
Click the verify button. When you are finished, click the save button, type a name for your new function, and click OK.
Repeat these steps for the ADX price falling, Linda Raschke lower line, Linda Raschke upper line, and Linda Raschke middle line indicators.
ADX price falling
ADX (10 , False) > ADX (10 , False).1 And Close < MovingAvg (Close , 8)

Linda Raschke lower line
MovingAvgX (Close , 20 , False) - (2.5 * Avg True Range (10))

Linda Raschke upper line
MovingAvgX (Close , 20 , False) + (2.5 * Avg True Range (10))

Linda Raschke middle line
MovingAvgX (Close , 20 , False)
Now that we have created the function, go to a daily chart and go to the Add to Chart window by clicking on the chart and typing A on the keyboard.
Click on the Indicators tab, find the indicators in the list, and either double-click on them or highlight the name and click the Add button.
Note you can add more than one indicator at a time: click the name of an indicator to highlight it. Then holding the Ctrl key down on the keyboard, click the names of other indicators to add, and click the Add button when you have all the desired indicators highlighted.
Indicators to add to the chart are:
CCI
MovingAvg
Keltner Upper Band
Keltner Lower Band
Linda Raschke Lower Line
Linda Raschke Middle Line
Linda Raschke Upper Line
To add the Highlight Bars, go to a daily chart and go to the Add to Chart window by clicking on the chart and typing A on the keyboard.
Click on the HighlightBars tab, find the Highlight Bars in the list, and either double-click on them or highlight the name and click the Add button.
Highlight bars to add to this chart are:
ADX Price Falling
ADX Price Rising
On the chart, click and drag the labels for MovingAvg, Keltner Upper Band, Keltner Lower Band, Linda Raschke Lower Line, Linda Raschke Middle Line and Linda Raschke Upper Line into the same pane as the price bars.
You will need to adjust the values for the CCI, MovingAvg, Keltner Upper Band and Keltner Lower Band.
Click on the chart and type E. Highlight the desired indicator and change it to the desired values and color in the chart settings window.
Change the CCI period to 21.
Change the MovingAvg, Keltner Upper Band and Keltner Lower Band bars used in average to 18 for each.
Chart settings:
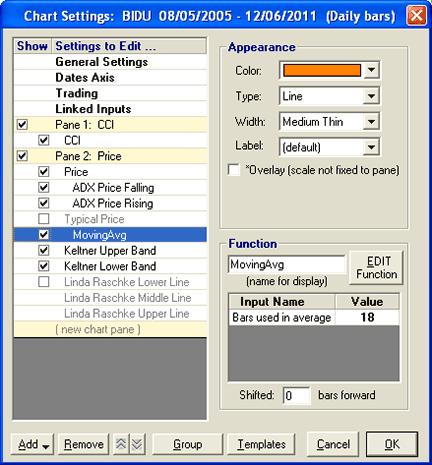
Click and drag the Pane 1: Price below the Pane 2: CCI and click the OK button.
When you have them the way you want to see them, click on the Templates button, click <Manage chart templates>. Then click on the New button, type a name for the template and click the OK button.
You now have a template that you can add to any chart by selecting it from the Templates button menu. See Figure 13.
Genesis Financial Technologies has provided a library named “Trade Breakouts And Retracements With TMV” that includes a template named “SC Trade Breakouts And Retracements With TMV,” which contains the custom indicators and highlight bars from discussed here. You can download a special file named “SC201202,” downloadable through Trade Navigator, to get this library.
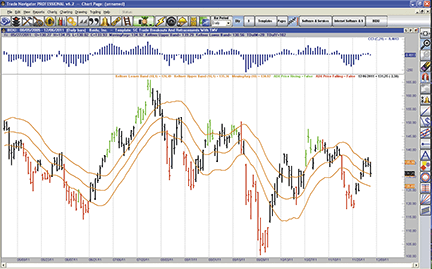
FIGURE 13: TRADE NAVIGATOR, TMV

VT TRADER: TREND, MOMENTUM, VOLATILITY, AND VOLUME (TMV)
Our Traders’ Tip this month is based on Barbara Star’s article in this issue, “Trade Breakouts And Retracements With TMV.”
This trading system template based on the one described in Star’s article combines trend, momentum, and volatility indicators into an easy-to-use format, providing the trader with a multidimensional perspective of price behavior.
Our version of the TMV includes Keltner bands, CCI, and ADX. The volume oscillator was not included. Since the TMV is an analytic template made up of a series of indicators, traders are encouraged to experiment with their own mix of indicators. For additional information regarding the use of TMV, please refer to Star’s article.
We’ll be offering the TMV analytic template for download in our VT client forums at https://forum.vtsystems.com along with hundreds of other precoded and free indicators and trading systems. The VT Trader step-by-step instructions for recreating this analytic template are as follows:
- Ribbon → Technical Analysis menu → Trading Systems group → Trading Systems Builder command → [New] button
- In the General tab, input the following text for each field:
Name: TASC - 02/2012 - TMV Analytic Template
Function Name Alias: tasc_TMVTemplate
Label Mask: TASC - 02/2012 - TMV Analytic Template
- In the Input Variable(s) tab, set up the following variables:
[New] button...
Name: KcPr
Display Name: Keltner Channel Periods
Type: integer
Default: 13

[New] button...
Name: cciperiods
Display Name: CCI Periods
Type: integer
Default: 13

[New] button...
Name: AdxPeriods
Display Name: ADX Periods
Type: integer
Default: 10
- In the Output Variable(s) tab, set up the following variables:
[New] button...
Var Name: MidKC
Name: Middle Keltner Channel
* Checkmark: Indicator Output
Select Indicator Output Tab
Line Color: dark blue
Line Width: 1
Ling Style: dashed
Placement: Price Frame
[OK] button...

[New] button...
Var Name: UpperKC
Name: Upper Keltner Channel
* Checkmark: Indicator Output
Select Indicator Output Tab
Line Color: purple
Line Width: 1
Ling Style: solid
Placement: Price Frame
[OK] button...

[New] button...
Var Name: LowerKC
Name: Lower Keltner Channel
* Checkmark: Indicator Output
Select Indicator Output Tab
Line Color: purple
Line Width: 1
Ling Style: solid
Placement: Price Frame
[OK] button...

[New] button...
Var Name: CCIndex
Name: CCIndex
* Checkmark: Indicator Output
Select Indicator Output Tab
Line Color: red
Line Width: 2
Ling Style: histogram
Placement: Additional Frame 1
[OK] button...

[New] button...
Var Name: CCIUpExtreme
Name: CCIUpExtreme
* Checkmark: Indicator Output
Select Indicator Output Tab
Line Color: black
Line Width: 1
Ling Style: dashed
Placement: Additional Frame 1
[OK] button...

[New] button...
Var Name: CCIDownExtreme
Name: CCIDownExtreme
* Checkmark: Indicator Output
Select Indicator Output Tab
Line Color: black
Line Width: 1
Ling Style: dashed
Placement: Additional Frame 1
[OK] button...

[New] button...
Var Name: CCIZero
Name: CCIZero
* Checkmark: Indicator Output
Select Indicator Output Tab
Line Color: black
Line Width: 1
Ling Style: dashed
Placement: Additional Frame 1
[OK] button...

[New] button...
Var Name: AdxPriceRising
Name: AdxPriceRising
* Checkmark: Highlights Enabled
Select Highlights Tab
Color: green
[OK] button...

[New] button...
Var Name: AdxPriceFalling
Name: AdxPriceFalling
* Checkmark: Highlights Enabled
Select Highlights Tab
Color: pink
[OK] button...
- In the Formula tab, input the following formula via copy and paste:
{Keltner Channels}

MidKC:= Mov(TP(),KcPr,S);
UpperKC:= MidKC + Mov((H-L),KcPr,S);
LowerKC:= MidKC - Mov((H-L),KcPr,S);

{Commodity Channel Index}

CCIndex:= CCI(cciperiods);
CCIUpExtreme:= 100;
CCIDownExtreme:= -100;
CCIZero:= 0;

{Average Directional Movement Index (ADX)}

TH:= if(Ref(C,-1)>H,Ref(C,-1),H);
TL:= if(Ref(C,-1)<L,Ref(C,-1),L);
TR:= TH-TL;

PlusDM:= if(H>Ref(H,-1) AND L>=Ref(L,-1), H-Ref(H,-1),
         if(H>Ref(H,-1) AND L<Ref(L,-1) AND H-Ref(H,-1)>Ref(L,-1)-L, H-Ref(H,-1),
         0));

PlusDI:= 100 * Wilders(PlusDM,AdxPeriods)/Wilders(Tr,AdxPeriods);

MinusDM:= if(L<Ref(L,-1) AND H<=Ref(H,-1), Ref(L,-1)-L,
          if(H>Ref(H,-1) AND L<Ref(L,-1) AND H-Ref(H,-1)<Ref(L,-1)-L, Ref(L,-1)-L,
          0));

MinusDI:= 100 * Wilders(MinusDM,AdxPeriods)/Wilders(Tr,AdxPeriods);

DIDif:= Abs(PlusDI-MinusDI);
DISum:= PlusDI + MinusDI;

_ADX:= 100 * Wilders(DIDif/DISum,AdxPeriods);

{ADX/Price Paint Bars Conditions}

AdxPriceRising:= _ADX>ref(_ADX,-1) AND C>Mov(C,8,S);
AdxPriceFalling:= _ADX>ref(_ADX,-1) AND C<Mov(C,8,S);
- Click the “Save” icon to finish building the trading system.
To attach the trading system to a chart (Figure 14), select the “Add trading system” option from the chart’s contextual menu, select “TASC - 02/2012 - TMV Analytic Template” from the trading systems list, and click the [Add] button.
To learn more about VT Trader, visit www.vtsystems.com.
Risk disclaimer: Forex trading involves a substantial risk of loss and may not be suitable for all investors.
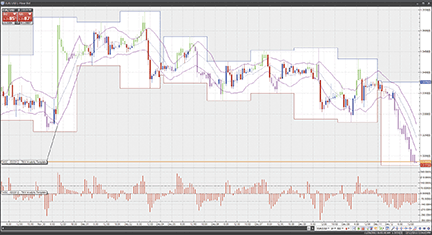
FIGURE 14: VT TRADER, ADX, CCI, AND KELTNER BANDS. Here is the TMV template attached to a EUR/USD one-hour candlestick chart.

TRADESIGNAL: TREND, MOMENTUM, VOLATILITY, AND VOLUME (TMV)
The indicators discussed in “Trade Breakouts And Retracements With TMV” by Barbara Star in this issue can be used with our online charting tool at www.tradesignalonline.com. Check the Infopedia section for our Lexicon. There you will see the indicator and functions that you can make available for your personal account. Click on an indicator and select “Open script.” The indicator will immediately be available for you to apply on any chart. (See Figure 15.)
The source code is displayed below.
TradeSignalOnline source code for the "eKeltner Channel" indicator:
Meta:
	Synopsis("This original Keltner Channel was derived from Barbara Stars Article 'Trading with TMV' in the 02/2012 Issue of Technical Analysis of Stocks & Commodities"),
	Weblink("https://www.tradesignalonline.com/lexicon/view.aspx?id=Trade%20Breakouts%20and%20Retracements%20with%20TMV"),
	Subchart( False );

Inputs:
	Period( 20 ),
	Factor_ATR( 2.5 );

Vars:
	midLine, atrValue, upperLine, lowerLine;

midLine = XAverage( TypicalPrice, 20 );
atrValue = Average( TrueRAnge, 20 );
upperLine = midLine + atrValue * Factor_ATR;
lowerLine = midLine - atrValue * Factor_ATR;

DrawLine( midLine, "Mid Line", StyleDash, 1, Black );
DrawLine( upperLine, "Upper Line", StyleSolid, 1, Black );
DrawLine( lowerLine, "Lower Line", StyleSolid, 1, Black );


// *** Copyright tradesignal GmbH ***

// *** www.tradesignal.com ***
TradeSignalOnline source code for the "Volume Oscillator" indicator
Meta:
	Synopsis("This Indicator was derived from Barbara Stars Article 'Trading with TMV' in the 02/2012 Issue of Technical Analysis of Stocks & Commodities"),
	Weblink("https://www.tradesignalonline.com/lexicon/view.aspx?id=Trade%20Breakouts%20and%20Retracements%20with%20TMV"),
	Subchart( True );

Inputs:
	Fast_Period( 1 , 1 ),
	Slow_Period( 20 , 1 ),
	Peak_Level( 50 , 1 );


Vars:
	volValue, fastAvgValue, slowAVGValue;

fastAvgValue = AverageFC( Volume, Fast_Period );
slowAVGValue = AverageFC( Volume, Slow_Period );

volValue = ( ( fastAvgValue - slowAVGValue ) / ( fastAvgValue + slowAVGValue ) ) * 100;

If volValue > Peak_Level Then
	DrawForest( 0, volValue, "Zero", "Vol OSc", Thick, Black );

DrawLine( 0, "Baseline", StyleDash, 1, Black );


// *** Copyright tradesignal GmbH ***

// *** www.tradesignal.com ***
TradeSignalOnline source code for the "sKeltner Channel" indicator:
Meta:
	Synopsis("This Keltner Channel Variation was derived from Barbara Stars Article 'Trading with TMV' in the 02/2012 Issue of Technical Analysis of Stocks & Commodities"),
	Weblink("https://www.tradesignalonline.com/lexicon/view.aspx?id=Trade%20Breakouts%20and%20Retracements%20with%20TMV"),
	Subchart( False );

Inputs:
	Period( 20 );

Vars:
	midLine, atrValue, upperLine, lowerLine;

midLine = AverageFC( TypicalPrice, 20 );
atrValue = Average( Range, 20 );
upperLine = midLine + atrValue;
lowerLine = midLine - atrValue;

DrawLine( midLine, "Mid Line", StyleDash, 1, Black );
DrawLine( upperLine, "Upper Line", StyleSolid, 1, Black );
DrawLine( lowerLine, "Lower Line", StyleSolid, 1, Black );


// *** Copyright tradesignal GmbH ***

// *** www.tradesignal.com ***
TradeSignalOnline source code for the "ADX Color Bars":
Meta:
	Synopsis("This Indicator was derived from Barbara Stars Article 'Trading with TMV' in the 02/2012 Issue of Technical Analysis of Stocks & Commodities"),
	Weblink("https://www.tradesignalonline.com/lexicon/view.aspx?id=Trade%20Breakouts%20and%20Retracements%20with%20TMV"),
	Subchart( False );

Inputs:
	ADX_Period( 10 , 1 ),
	SMA_Period( 8 , 1 ),
	Color_Bullish( DarkGreen ),
	Color_Bearish( Red ),
	Color_Neutral( White );

Vars:
	longCond, shortCond, barColor, adxValue, smaValue;

adxValue = ADX( ADX_Period );
smaValue = Average( Close, SMA_Period );

longCond = adxValue > adxValue[1] And Close > smaValue;
shortCond = adxValue < adxValue[1] And Close < smaValue;

barColor = Color_Neutral;

if longCond Then
	barColor = Color_Bullish
Else If shortCond Then
	barColor = Color_Bearish;

DrawCandleStick( Open, High, Low, Close, barColor, barColor, DarkGray );


// *** Copyright tradesignal GmbH ***

// *** www.tradesignal.com ***
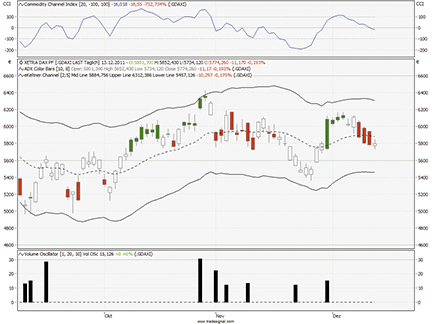
FIGURE 15: TRADESIGNALONLINE.COM, KELTNER CHANNEL AND VOLUME OSCILLATOR. Here is an example chart from Tradesignal Online displaying the eKeltner channel and volume oscillator indicator on a daily chart of the S&P 500 index.
METASTOCK: TREND, MOMENTUM, VOLATILITY, AND VOLUME (TMV) — STAR
ARTICLE CODE
Metastock code for the TMV indicator template provided in Barbara Star’s article in this issue is available in our Subscriber’s Area.