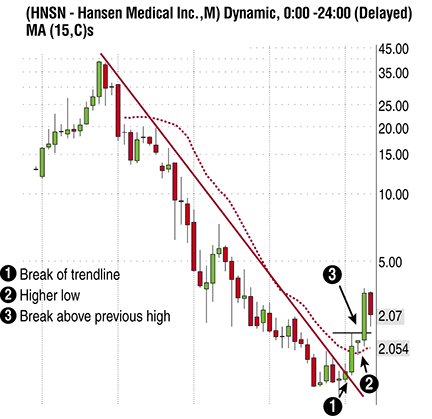
FIGURE 1: HIGHER TIME FRAME. On this monthly chart of Hansen Medical (HNSN), you see a clear trend reversal as per Trader Vic’s 1-2-3 reversal pattern.
REAL WORLD
The Search For Stocks
It pays to know your stock. Here’s a step-by-step analysis about how one trader likes to trade the markets.
We often hear you should buy strong stocks in the strongest sectors. But as with all stock market knowledge, the application of this knowledge can be a challenge. Let me share with you a type of trade I often find very rewarding, a fiery bull trade.
In his book Getting Started In Chart Patterns, Thomas Bulkowski mentions that stocks that rise more than 90% within a three-month period have the best performance. All you have to do is to get into such stocks during a flag/pause. With that in mind, I started looking for such stocks two years ago, using a four-step process:
Step 1: Trigger
Best movers in the strongest sectors
The first step is to find the best movers in the strongest sectors. One such stock I found was Hansen Medical (HNSN) when it moved from $1.58 on February 1, 2011, to a high of $3.78 on April 26, 2011. That is 139% in a matter of nearly 90 days. This was the period in the stock market when the health-care sector was leading, so I decided to look deeper into HNSN.
Step 2: The Big Story
Higher time frame
Next, I looked at a higher time frame chart to get a bigger picture. Looking at the monthly chart of HNSN, I saw a clear trend reversal as per the 1-2-3 reversal pattern as described by Victor Sperandeo in his book Trader Vic: Methods Of A Wall Street Master. See the sidebar “1-2-3-Reversal Pattern” for a description of this setup. The monthly chart can be seen in Figure 1.

FIGURE 1: HIGHER TIME FRAME. On this monthly chart of Hansen Medical (HNSN), you see a clear trend reversal as per Trader Vic’s 1-2-3 reversal pattern.