AT THE CLOSE
Using Price Extreme Values
by Voznjuk Vladimir Vladimirovich
Here’s one way to look for entry points by using extreme price values.
All traders dream about opening a position at an extreme low or high price value. In an ideal world, everybody would open short positions at a high price and open long positions at a low price. This is because doing so guarantees a small floating drawdown, minimal risk, and the possibility of an effective trailing position.
To pursue this idea, I created an interesting algorithm to search for entry points using extreme price values. Here is an idea for such an indicator. (Code follows for the MetaTrader 4 trading platform.) The charts I have created will help you to understand this algorithm better. First of all, we need two buffers for this indicator:
#property indicator_chart_window
#property indicator_buffers 2
#property indicator_color1 Yellow
#property indicator_color2 Blue
extern int	CountedPeriod=5;
I gave the buffers names:
double hi[]; //  for high border
double lo[];  // for low border
Let us create code for a one-minute time frame, which will search for the minimum and maximum for a five-minute time frame period, and let us display it on a chart.
void init(){
	//---- indicators
   SetIndexStyle(0,DRAW_LINE);
   SetIndexBuffer(0,hi);
   SetIndexStyle(1,DRAW_LINE);
   SetIndexBuffer(1,lo);
	//----
	if(CountedPeriod<Period()){CountedPeriod=Period();}
return;}
void deinit(){return;}

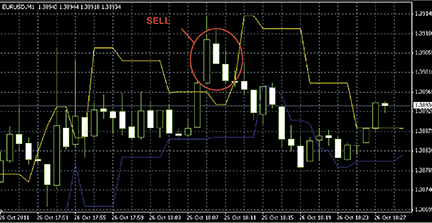
FIGURE 1: HIGH AND LOW PRICE BORDERS. The trigger for opening a position is when two consecutive candles form outside of the borders, either below or above these two lines. You should open a short position when two candles or more are above the yellow line (upper line).
Excerpted from an article originally published in the March
2012 issue of Technical Analysis of Stocks & Commodities magazine. All rights reserved. © Copyright 2012, Technical Analysis, Inc.
Return to Contents
