INDICATORS
Exploiting Extremes
Here’s an indicator that measures extreme bullishness and bearishness and helps you identify a change in sentiment.
After developing the volume zone oscillator (VZO) and price zone oscillator (PZO), I found there were sides of the market not covered by those two oscillators — namely, time and sentiment. Sometimes, the market could reverse from a point with attractive price and volume indicators, but by then the sentiment could be be too high for the move to continue.
The psychology of that extreme sentiment point is best described in John Murphy’s Technical Analysis Of The Financial Markets, where he states that the more bullish the forecast, the more aggressively the trader will approach the market.
Sentiment zone oscillator
The sentiment zone oscillator (SZO) is a leading contrary oscillator that measures the extreme emotions of a single market or share. It measures and defines both extremes, bullishness (overoptimism) and bearishness (overpessimism), that could lead to a change in sentiment, eventually changing the trend of the time frame under study.
The SZO was devised on the belief that after several waves of rising prices, investors begin to get bullish on the stock with increasing confidence since the price has been rising for some time. The SZO measures that bullishness/bearishness and marks overbought/oversold levels.

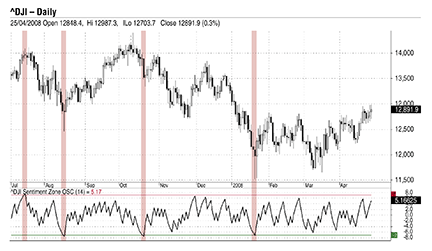
FIGURE 1: APPLYING SENTIMENT ZONE OSCILLATOR. When the SZO goes above 7, it indicates extreme optimism. When the SZO goes below -7, it indicates extreme pessimism. On this daily chart of the DJIA (July 2007 to April 2008), the SZO gave four signals, all of which were successful.
Calculating it
The SZO formula is based on the number of rising days to declining ones. It only uses the closing price as a separation rule.
To include both time and sentiment, a value of +1 is stored for each higher close above the previous period closes. Otherwise, a value of -1 is stored. With that calculation method, the time is covered and categorized bullish or bearish. In addition, a positive or a negative value serves the sentiment condition.
For smoothing purposes, a triple exponential moving average (TEMA) of those plus and minus values is divided by the total number of days of the period being studied:
Sentiment zone oscillator = 100 * (SP � Range)
where:
SP (sentiment position) = X-days TEMA (number of up days minus number of down days)
Range = Period being studied