
TRADERS’ TIPS
Here is this month’s selection of Traders’ Tips, contributed by various developers of technical analysis software to help readers more easily implement some of the strategies presented in this and other issues.
Other code appearing in articles in this issue is posted in the Subscriber Area of our website at https://technical.traders.com/sub/sublogin.asp. Login requires your last name and subscription number (from mailing label). Once logged in, scroll down to beneath the “Optimized trading systems” area until you see “Code from articles.” From there, code can be copied and pasted into the appropriate technical analysis program so that no retyping of code is required for subscribers.
You can copy these formulas and programs for easy use in your spreadsheet or analysis software. Simply “select” the desired text by highlighting as you would in any word processing program, then use your standard key command for copy or choose “copy” from the browser menu. The copied text can then be “pasted” into any open spreadsheet or other software by selecting an insertion point and executing a paste command. By toggling back and forth between an application window and the open web page, data can be transferred with ease.

For this month’s Traders’ Tips, the focus is Walid Khalil’s article in this issue, “Sentiment Zone Oscillator.” Source code for AmiBroker is already provided in Khalil’s article in this issue, and subscribers will find this code in the Subscriber Area of our website, Traders.com. (Click on “Article Code” from our homepage.) Presented here is additional code and possible implementations for other software.

In “Sentiment Zone Oscillator” in this issue, author Walid Khalil describes the construction and use of the sentiment zone oscillator (SZO). The oscillator is designed to indicate overbought and oversold levels and potential entry/exit areas.
Shown below is the EasyLanguage code for the SZO indicator (_SZO); a strategy based on the author’s discussion (_SZO_Strategy); and an accompanying function (_TEMA) used in the indicator and strategy.
The buy and sell conditions used in the strategy are defined by Khalil in his article. Alerts were coded in the indicator to alert when the oscillator crosses below the overbought levels and above the oversold levels.
To download the EasyLanguage code for the indicators, first navigate to the EasyLanguage FAQs and Reference Posts Topic in the EasyLanguage support forum (https://www.tradestation.com/Discussions/Topic.aspx?Topic_ID=47452), scroll down and click on the link labeled “Traders' Tips, TASC.” Then select the appropriate link for the month and year. The ELD filename is “_SZO.ELD.” The code is also shown below.
_TEMA (Function - set Return Type to double)

{ TASC May 2012 }
{ Sentiment Zone Oscillator }

inputs:
	Price( numericseries ), { value to average }
	Length( numericsimple ) ; { length of average }

variables:
	EMA1( 0 ),
	EMA2( 0 ),
	EMA3( 0 ) ;

EMA1 = XAverage( Price, Length ) ;
EMA2 = XAverage( EMA1, Length ) ;
EMA3 = XAverage( EMA2, Length ) ;

_TEMA = 3 * EMA1 - 3 * EMA2 + EMA3 ;


_SZO (Indicator)

{ TASC May 2012 }
{ Sentiment Zone Oscillator }
{ Walid Khalil, MFTA, CFTe }

inputs:
	Period( 14 ),
	LongPeriod( 30 ),
	OverBought( 7 ),
	OverSold( -7 ),
	PlotZeroLine( true ),
	PlotDynamicOBandOS( true ) ;

variables:
	R( 0 ),
	SP( 0 ),
	SZO( 0 ),
	HighestSZO( 0 ),
	LowestSZO( 0 ),
	SZORange( 0 ),
	DynamicOB( 0 ),
	DynamicOS( 0 ) ;

if Close > Close[1] then
	R = 1
else
	R = -1 ;

SP = _TEMA( R, Period ) ;
SZO = 100 * SP / Period ;

HighestSZO = Highest( SZO, LongPeriod ) ;
LowestSZO = Lowest( SZO, LongPeriod ) ;
SZORange = HighestSZO - LowestSZO ;

DynamicOB = LowestSZO + SZORange * 0.95 ;
DynamicOS = HighestSZO - SZORange * 0.95 ;

Plot1( SZO, "SZO" ) ;
if PlotZeroLine then
	Plot2( 0, "Zero" ) ;
Plot3( OverBought, "OB" ) ;
Plot4( OverSold, "OS" ) ;
if PlotDynamicOBandOS then
	begin
	Plot5( DynamicOB, "DynOB" ) ;
	Plot6( DynamicOS, "DynOS" ) ;
	end ;

{ Alerts }
if AlertEnabled then
	begin
	if SZO crosses above OverSold then
		Alert( "SZO cross above OS" )
	else if SZO crosses above DynamicOS then
		Alert( "SZO cross above DynamicOS" )
	else if SZO crosses below OverBought then
		Alert( "SZO cross below OB" )
	else if SZO crosses below DynamicOB then
		Alert( "SZO cross below DynamicOB" ) ;
	end ;

_SZO_Strategy (Strategy)

{ TASC May 2012 }
{ Sentiment Zone Oscillator }
{ Walid Khalil, MFTA, CFTe }

inputs:
	SZOPeriod( 14 ), { length for SZO calculations }
	LongPeriod( 30 ), { used for dynamic OB and OS
	 levels }
	SZOAvgLen( 30 ), { moving average length of SZO -
	 for entry/exit }
	TrendEMALen( 60 ), { length for trend EMA }
	OverBought( 7 ),
	OverSold( -7 ) ;

variables:
	R( 0 ),
	SP( 0 ),
	SZO( 0 ),
	SZO_SMA( 0 ),
	TrendEMA( 0 ),
	HighestSZO( 0 ),
	LowestSZO( 0 ),
	SZORange( 0 ),
	DynamicOB( 0 ),
	DynamicOS( 0 ),
	BuyCondition1( false ),
	BuyCondition2( false ),
	BuyCondition3( false ),
	SellCondition1( false ),
	SellCondition2( false ) ;

if Close > Close[1] then
	R = 1
else
	R = -1 ;

SP = _TEMA( R, SZOPeriod ) ;
SZO = 100 * SP / SZOPeriod ;
TrendEMA = XAverage( Close, TrendEMALen ) ;
SZO_SMA = Average( SZO, SZOAvgLen ) ;

HighestSZO = Highest( SZO, LongPeriod ) ;
LowestSZO = Lowest( SZO, LongPeriod ) ;
SZORange = HighestSZO - LowestSZO ;

DynamicOB = LowestSZO + SZORange * 0.95 ;
DynamicOS = HighestSZO - SZORange * 0.95 ;

{ Buy Rules/Conditions }
BuyCondition1 = SZO_SMA crosses above 0 and
 Close > TrendEMA ;
BuyCondition2 = Close > TrendEMA and
 SZO_SMA > SZO_SMA[1] and SZO < DynamicOS ;
BuyCondition3 = SZO_SMA > 0 and SZO crosses above
 DynamicOS and TrendEMA > TrendEMA[1] ;

{ Sell Rules/Conditions }
SellCondition1 = SZO_SMA crosses above 0 ;
SellCondition2 = SZO crosses below OverBought and
 SZO_SMA < SZO_SMA[1] ;

{ Long Entry }
if BuyCondition1 or BuyCondition2 or BuyCondition3 then
	Buy ( "SZO LE" ) next bar market ;

{ Long Exit }
if SellCondition1 or SellCondition2 then
	Sell ( "SZO LX" ) next bar market ;
A sample chart is shown in Figure 1.
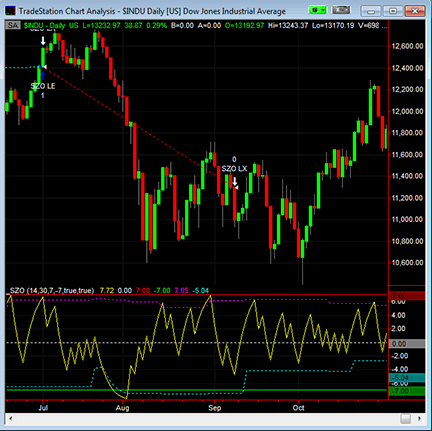
FIGURE 1: TRADESTATION, SENTIMENT ZONE OSCILLATOR. Here is a daily bar chart of $INDU along with the _SZO indicator and _SZO_Strategy. In the indicator (lower panel), the magenta and cyan dotted lines plot the dynamic overbought and dynamic oversold levels, respectively.
This article is for informational purposes. No type of trading or investment recommendation, advice, or strategy is being made, given, or in any manner provided by TradeStation Securities or its affiliates.

April showers have brought us May flowers by way of Walid Khalil’s article in this issue, “Sentiment Zone Oscillator.” Through the creation of his volume and price zone oscillators, Khalil found a need to effectively track swings in market sentiment along with other factors, extreme swings in particular. His oscillator and the associated strategy utilize a back-counting method of rising versus falling periods tempered by a smoothed exponential moving average to avoid whipsaw signaling.
For thinkorswim users, we have created a pair of scripts, one study and one strategy, in our proprietary language, thinkScript. The study gives you access to the oscillator described in Khalil’s article. The associated strategy backtests the application of the oscillator in the method he recommends. With this study’s method of measuring antipodal sentiment, it can be used as a leading contrarian indicator. (See Figure 2.) Enjoy!
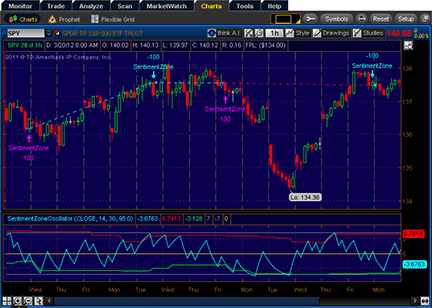
FIGURE 2: THINKORSWIM, SENTIMENT ZONE OSCILLATOR. The SZO study can be used as a leading contrarian indicator.
The code is shown below along with instructions for applying it.
declare lower;

input price = close;
input length = 14;
input longLength = 30;
input percent = 95.0;

def SP = TEMA(Sign(price - price[1]), length);
plot SZO = 100 * SP / length;

def HLP = Highest(SZO, longLength);
def LLP = Lowest (SZO, longLength);
def pRange = (HLP - LLP) * percent / 100;
plot OverBought = LLP + pRange;
plot OverSold = HLP - pRange;
plot "+7" = 7;
plot "-7" = -7;
plot ZeroLine = 0;

SZO.SetDefaultColor(GetColor(1));
OverBought.SetDefaultColor(GetColor(5));
OverSold.SetDefaultColor(GetColor(6));
"+7".SetDefaultColor(GetColor(7));
"-7".SetDefaultColor(GetColor(7));
ZeroLine.SetDefaultColor(GetColor(4));Select OK.
script SentimentZoneOscillator {

    input price = close;
    input length = 14;
    input longLength = 30;
    input percent = 95.0;

    def SP = TEMA(Sign(price - price[1]), length);
    plot SZO = 100 * SP / length;

    def HLP = Highest(SZO, longLength);
    def LLP = Lowest (SZO, longLength);
    def pRange = (HLP - LLP) * percent / 100;
    plot OverBought = LLP + pRange;
    plot OverSold = HLP - pRange;
    plot "+7" = 7;
    plot "-7" = -7;
    plot ZeroLine = 0;
}

input price = close;
input length = 14;
input longLength = 30;
input percent = 95.0;

def SZO = reference SentimentZoneOscillator(price, length, longLength, percent).SZO;
def OverSold = reference SentimentZoneOscillator(price, length, longLength, percent).OverSold;
def SMA30 = Average(SZO, 30);
def EMA60 = ExpAverage(price, 60);

addOrder(OrderType.BUY_AUTO,
    SMA30 crosses above 0 and price > EMA60 or
    price > EMA60 and SZO < OverSold and SMA30 > SMA30[1] or
    SMA30 > 0 and SZO crosses above OverSold and EMA60 > EMA60[1],
    tickColor = GetColor(0), arrowColor = GetColor(0));
addOrder(OrderType.SELL_AUTO,
    SMA30 crosses above 0 or
    SZO crosses below 7 and SMA30 < SMA30[1],
    tickColor = GetColor(1), arrowColor = GetColor(1));

For this month’s Traders’ Tip, we’ve provided the formula SentimentZoneOsc.efs based on the formula code from Walid Khalil’s article in this issue, “Sentiment Zone Oscillator.”
The study contains formula parameters to set the number of periods, dynamic levels, dynamic levels period, and the dynamic levels percent range, which may be configured through the Edit Chart window.
To discuss this study or download a complete copy of the formula code, please visit the EFS Library Discussion Board forum under the Forums link from the support menu at www.esignal.com or visit our EFS KnowledgeBase at https://www.esignal.com/support/kb/efs/. The eSignal formula script (EFS) is also available for copying & pasting below or downloading from here.
/*********************************
Provided By:
    Interactive Data Corporation (Copyright © 2012)
    All rights reserved. This sample eSignal Formula Script (EFS)
    is for educational purposes only. Interactive Data Corporation
    reserves the right to modify and overwrite this EFS file with
    each new release.

Description:
    Sentiment Zone Oscillator

Version:            1.0  14/03/2012

Formula Parameters:                     Default:
    Period                              14
    Use Dynamic Levels                  true
    Dynamic Levels Period               30
    Dynamic Levels % Range              95

Notes:
    The related article is copyrighted material. If you are not
    a subscriber of Stocks & Commodities, please visit www.traders.com.

**********************************/
var OB_LEVEL = 7;
var OS_LEVEL = -7;

var fpArray = new Array();

function preMain()
{
    setCursorLabelName("Sentiment Zone Osc", 0);
    setCursorLabelName("OverBought Level", 1);
    setCursorLabelName("OverSold Level", 2);

    setDefaultBarFgColor(Color.aqua, 0);
    setDefaultBarFgColor(Color.red, 1);
    setDefaultBarFgColor(Color.green, 2);

    setDefaultBarThickness(2, 0);
    setDefaultBarThickness(2, 1);
    setDefaultBarThickness(2, 2);

    var x=0;
    fpArray[x] = new FunctionParameter("gPeriod", FunctionParameter.NUMBER);
    with(fpArray[x++])
    {
	setName("Period");
	setLowerLimit(2);
        setUpperLimit(200);
        setDefault(14);
    }

    fpArray[x] = new FunctionParameter("gIsDynamicLevels", FunctionParameter.BOOLEAN);
    with(fpArray[x++])
    {
	setName("Use Dynamic Levels");
        setDefault(true);
    }

    fpArray[x] = new FunctionParameter("gExtremesPeriod", FunctionParameter.NUMBER);
    with(fpArray[x++])
    {
	setName("Dynamic Levels Period");
	setLowerLimit(2);
        setUpperLimit(200);
        setDefault(30);
    }

    fpArray[x] = new FunctionParameter("gPercentageRange", FunctionParameter.NUMBER);
    with(fpArray[x++])
    {
	setName("Dynamic Levels % Range");
	setLowerLimit(1);
        setUpperLimit(100);
        setDefault(95);
    }
}

var bInit = false;
var bVersion = null;

var xSZO = null;

var xHLP = null;
var xLLP = null;

function main(gPeriod, gIsDynamicLevels, gExtremesPeriod, gPercentageRange)
{
    if (bVersion == null) bVersion = verify();
    if (bVersion == false) return;

    if (!bInit)
    {
        xSZO = efsInternal("calc_SZO", gPeriod);

        if (gIsDynamicLevels)
        {
            xHLP = hhv(gExtremesPeriod, xSZO);
            xLLP = llv(gExtremesPeriod, xSZO);
        }

        bInit = true;
    }

    var nOB = null;
    var nOS = null;

    if (gIsDynamicLevels)
    {
        var vHLP = xHLP.getValue(0);
        var vLLP = xLLP.getValue(0);

        if (vHLP == null || vLLP == null)
            return;

        var nRange = vHLP - vLLP;
        var nPRange = nRange * (gPercentageRange / 100);

        nOB = vLLP + nPRange;
        nOS = vHLP - nPRange;

        addBand(OB_LEVEL, PS_DASH, 1, Color.maroon, "obLevel");
        addBand(OS_LEVEL, PS_DASH, 1, Color.darkgreen, "osLevel")
    }
    else
    {
        nOB = OB_LEVEL;
        nOS = OS_LEVEL;
    }

    var vSZO = xSZO.getValue(0);

    if (vSZO == null)
        return;

    return new Array(vSZO, nOB, nOS);
}


var bInitSZO = false;

var xR = null;
var xSP = null;

// Sentiment Zone Oscillator
function calc_SZO(period)
{
    if (!bInitSZO)
    {
        xR = efsInternal("calc_Range");
        xSP = efsInternal("TEMA", period, xR);

        bInitSZO = true;
    }

    var vSP = xSP.getValue(0);

    if (vSP == null)
        return;

    return 100 * (vSP / period);
}


// to include both time and sentiment
function calc_Range()
{
    var vC = close(0);
    var vvC = close(-1);

    if (vvC == null)
        return;

    if (vC > vvC)
        return 1;
    else
        return -1;
}


var bInitTEMA = false;
var xEma1 = null;
var xEma2 = null;
var xEma3 = null;

// Triple Exponential Moving Average
function TEMA(period, series)
{
    if(!bInitTEMA)
    {
        xEma1 = ema(period, series);
        xEma2 = ema(period, xEma1);
        xEma3 = ema(period, xEma2);

        bInitTEMA = true;
    }

    var vEma1 = xEma1.getValue(0);
    var vEma2 = xEma2.getValue(0);
    var vEma3 = xEma3.getValue(0);

    if (vEma3 == null)
        return null;

    return 3 * vEma1 - 3 * vEma2 + vEma3;
}

// verify version
function verify() {
    var b = false;
    if (getBuildNumber() < 779) {
        drawTextAbsolute(5, 35, "This study requires version 8.0 or later.",
            Color.white, Color.blue, Text.RELATIVETOBOTTOM|Text.RELATIVETOLEFT|Text.BOLD|Text.LEFT,
            null, 13, "error");
        drawTextAbsolute(5, 20, "Click HERE to upgrade.@URL=https://www.esignal.com/download/default.asp",
            Color.white, Color.blue, Text.RELATIVETOBOTTOM|Text.RELATIVETOLEFT|Text.BOLD|Text.LEFT,
            null, 13, "upgrade");
        return b;
    } else {
        b = true;
    }
    return b;
}
A sample chart is shown in Figure 3.
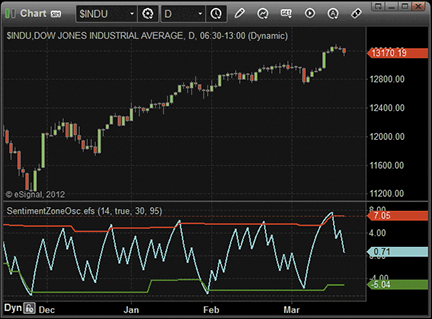
FIGURE 3: eSIGNAL, SENTIMENT ZONE OSCILLATOR

Walid Khalil’s article in this issue, “Sentiment Zone Oscillator,” introduces an indicator of the same name. The article includes the MetaStock code for the indicator, but here, we’ll provide code for the dynamic overbought and oversold levels. Here are the steps to make one indicator that plots both the SZO and the OB/OS levels:
Period:= Input("Y",2,200,14);
lperiod:= 30;
pcent:= 95;
R:= If(C>Ref(C,-1),1,-1);
SP:= Tema(r,period);
SZO:= 100*(SP/period);
hlp:= HHV(szo, lperiod);
llp:= LLV(szo, lperiod);
prange:= (hlp-llp)*(pcent/100);
ob:= llp+prange;
OS:= hlp-prange;
SZO;
OB;
OSThe system test for the SZO can be made as follows:
Period:= 14;
lperiod:= 30;
pcent:= 95;
R:= If(C>Ref(C,-1),1,-1);
SP:= Tema(r,period);
SZO:= 100*(SP/period);
hlp:= HHV(szo, lperiod);
llp:= LLV(szo, lperiod);
prange:= (hlp-llp)*(pcent/100);
ob:= llp+prange;
OS:= hlp-prange;

con1:= C > Mov(C,60,E) AND
Cross(Mov(szo,30,S),0);

con2:= C > Mov(C,60,E) AND
ROC(Mov(szo,30,S),1,$)>0 AND
szo < os;

con3:= Cross(SZO, os) AND
Mov(szo,30,S)>0 AND
ROC(Mov(C,60,E),1,$)>0;

con1 OR con2 OR con3
Period:= 14;
R:= If(C>Ref(C,-1),1,-1);
SP:= Tema(r,period);
SZO:= 100*(SP/period);

Cross(0,SZO) OR
(Cross(7,SZO) AND
Mov(szo,30,S)<0)

Although one of Wealth-Lab’s strongest points is the ability to express your ideas in C# language, no programming is required for certain tasks like prototyping a trading idea. The Strategy Builder allows you to combine building blocks known as rules into a trading system.
After updating our TASC magazine indicators library to its most recent version using the built-in extension manager, you will find the sentiment zone oscillator (SZO) organized under the TASC magazine indicators group. This allows you to quickly use it in rule-based strategies as an entry or exit condition without having to program a single line of code yourself.
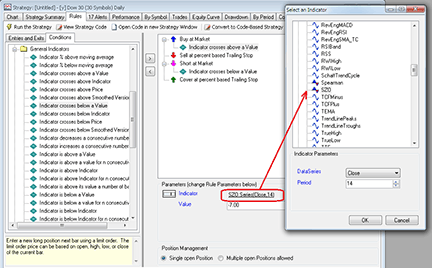
FIGURE 4: WEALTH-LAB, SENTIMENT ZONE OSCILLATOR. Here’s an example of building an SZO crossover/crossunder strategy from rules as indicated in “SZO trading tactics” in Wealth-Lab 6.3.
Figure 4 shows the Strategy Builder’s conditions tab with a group of rules for general indicators. To attach a rule for the SZO:
In our example, the resulting system was a blend between the countertrend entry based on reacting to SZO extremes, as suggested by author Walid Khalil in his article in this issue (“Sentiment Zone Oscillator”), and a trend-following stop that trails a percentage below (or above, for shorts) the highest high (or lowest low for shorts) achieved since the position was opened. See Figure 5.
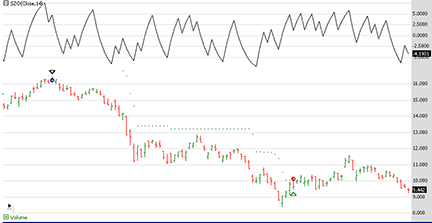
FIGURE 5: WEALTH-LAB, SZO SYSTEM. Here is a sample short trade. The stock’s 14-period SZO crosses below the +7 threshold.
By extending the backtest range to the most recent 10 years, we examined how efficient SZO signals were on the same Dow 30 portfolio on a longer history. With 5% equity allocated to a position, some signals had to be skipped. Our preference is to err on the side of caution, so the trades with the most percentage gain were excluded, suggesting a conservative outcome. After subtracting trading costs (commissions and 0.05% slippage per trade), the system took 244 trades (and skipped 115), coming slightly short of buy & hold’s net profit (64% vs. 74%) with less downside risk (maximum drawdown -38% vs. -50%). See Figure 6.
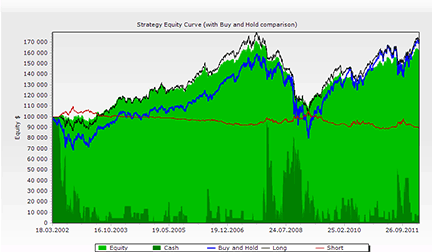
FIGURE 6: WEALTH-LAB, 6. The simplified rule-based strategy’s equity virtually mirrored the buy & hold, and the short side was a loser and was unable to support the long side during its weak times.
Overall, the SZO’s turning points seem to highlight extremes in market sentiment, and they do it without repeating too often. If you’re willing to experiment with the SZO trading system as presented by its author, the strategy code is also included:
Wealth-Lab 6 strategy code (C#):

using System;
using System.Collections.Generic;
using System.Text;
using System.Drawing;
using WealthLab;
using WealthLab.Indicators;
using TASCIndicators;

namespace WealthLab.Strategies
{
	public class SZOStrategy : WealthScript
	{
		private StrategyParameter paramPeriod;
		private StrategyParameter paramLongPeriod;
		private StrategyParameter paramBuy1;
		private StrategyParameter paramBuy2;
		private StrategyParameter paramBuy3;

		public SZOStrategy()
		{
			paramPeriod = CreateParameter("SZO Period", 14, 2, 300, 1);
			paramLongPeriod = CreateParameter("Long Period", 30, 20, 300, 1);
			paramBuy1 = CreateParameter("Buy1 On/Off", 1, 0, 1, 1);
			paramBuy2 = CreateParameter("Buy2 On/Off", 1, 0, 1, 1);
			paramBuy3 = CreateParameter("Buy3 On/Off", 1, 0, 1, 1);
		}

		protected override void Execute()
		{
			int period = paramPeriod.ValueInt;
			int LongPeriod = paramLongPeriod.ValueInt;
			double Percent=95;
			LineStyle ls = LineStyle.Solid;
			bool buy1 = paramBuy1.ValueInt > 0;
			bool buy2 = paramBuy2.ValueInt > 0;
			bool buy3 = paramBuy1.ValueInt > 0;

			SZO szo = SZO.Series( Close,period );
			SMA ma = SMA.Series( szo,LongPeriod );
			Highest HLP = Highest.Series(szo, LongPeriod);
			Lowest LLP = Lowest.Series(szo, LongPeriod);
			DataSeries Range = HLP - LLP;
			DataSeries Prange = Range *(Percent/100d);
			DataSeries OB = LLP + Prange; OB.Description = "O/B";
			DataSeries OS = HLP - Prange; OS.Description = "O/S";
			EMA ema = EMA.Series( Close,60,EMACalculation.Modern );

			ChartPane szoPane = CreatePane( 30,true,true );
			PlotSeriesOscillator( szoPane, szo, 7, -7, Color.Red, Color.Green, Color.Black, ls, 2 );
			PlotSeries( szoPane, OB, Color.Red, ls, 1 );
			PlotSeries( szoPane, OS, Color.Green, ls, 1 );
			DrawHorzLine( szoPane, 7, Color.Red, LineStyle.Dashed, 2 );
			DrawHorzLine( szoPane, -7, Color.Green, LineStyle.Dashed, 2 );
			HideVolume();

			for(int bar = GetTradingLoopStartBar(LongPeriod); bar < Bars.Count; bar++)
			{
				bool buyRule1 = CrossOver( bar, szo, 0 ) && (Close[bar] > ema[bar]) && buy1;
				bool buyRule2 = (Close[bar] > ema[bar]) && (szo[bar] < OS[bar]) && (ma[bar] > ma[bar - 1]) && buy2;
				bool buyRule3 = ( ma[bar] > 0 ) && CrossOver( bar, szo, -7 ) && (ema[bar] > ema[bar - 1]) && buy3;

				bool sellRule = CrossUnder( bar, szo, 0 ) || (CrossUnder( bar, szo, 7 ) && (ma[bar] < ma[bar - 1]));

				if (IsLastPositionActive)
				{
					Position p = LastPosition;
					if( sellRule )
						SellAtMarket( bar+1,p );
				}
				else
				{
					if( buyRule1 || buyRule2 || buyRule3 )
						BuyAtMarket( bar+1 );
				}
			}
		}
	}
}

The sentimental zone oscillator described by Walid Khalil in his article in this issue can be easily implemented with a few of NeuroShell Trader’s 800+ indicators. Simply select “New Indicator” from the Insert menu and use the Indicator Wizard to set up the following indicators:
SVO**
Multiply2( 100, Divide( Tema( IfThenElse( A>B( Close, Lag(Close,1)), 1, -1), 14, 14))

Overbought SVO zone
Add2 ( Min(SVO,30), Divide( Multiply2( Range(SVO,30), PERCENT), 100))

Oversold SVO zone
Subtract ( Max(SVO,30), Divide( Multiply2( Range(SVO,30), PERCENT), 100))
Note that the SVO is based on the TEMA custom indicator, which NeuroShell Trader users can download for free at www.ward.net.
To create a trading system based on the SZO, select “New Trading Strategy” from the Insert menu and enter the following formulas in the appropriate locations of the Trading Strategy Wizard:
Generate a buy long market order if one of the following is true:

And2(	CrossAbove( Avg( SVO, 30), 0 ),
	A>B( Close, ExpAvg( Close, 60 ))   )
And3(	A>B( Close, ExpAvg( Close, 60 )),
	A<B( SVO, SVO_OVERSOLD ),
	A>B( Momentum( Avg( SVO, 30), 1), 0)   )
And3(	A>B( Avg( SVO, 30), 0),
	CrossAbove( SVO, SVO_OVERSOLD ),
	A>B ( Momentum( ExpAvg( Close, 60 ), 1), 0)   )

Generate a sell long market order if one of the following is true:

CrossAbove ( Avg( SVO, 30), 0)
And2 ( CrossBelow( SVO, 7), A<B( Momentum( Avg(SVO,30), 1), 0))
If you have NeuroShell Trader Professional, you can also choose whether the parameters should be optimized. After backtesting the trading strategy, use the “Detailed Analysis” button to view the backtest and trade-by-trade statistics for the strategy.
Users of NeuroShell Trader can go to the STOCKS & COMMODITIES section of the NeuroShell Trader free technical support website to download a copy of this or any past Traders’ Tips.
A sample chart is shown in Figure 7.
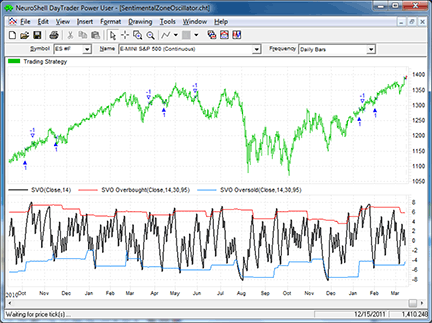
FIGURE 7: NEUROSHELL TRADER, SENTIMENT ZONE OSCILLATOR. This NeuroShell Trader chart displays the sentimental zone oscillator trading system and corresponding SVO indicator with overbought and oversold zones.

The article “Sentiment Zone Oscillator” by Walid Khalil in this issue gives us several new ideas to play with.
First, a basic sentiment zone oscillator (SZO) can be run against static overbought and oversold lines. Second, the SZO can be run against dynamic overbought and oversold lines. And finally, the SZO can be run within the complete trading system provided by the author. In our tests, the first option provided the most benefits.
Using the SZO against static overbought and oversold lines, we used a wide variety of parameter sets and were able to generate some pretty impressive foundations. In many instances, large numbers of trades were produced with relatively short holding periods. In addition to returns significantly outperforming the S&P 500 index, we often saw percentage profitability exceeding 80%.
In our next test, we took the basic SZO trading rule and ran it through an AutoSearch where it was automatically tested alongside thousands of supporting trading rules. The results were exceptional, often outperforming the S&P 500 index by a wide margin with relatively short holding periods and a high percentage of profitable trades. While the SZO appears to be a good foundation on its own, its true value appears to shine when used alongside the proper sets of supporting trading rules.
StrataSearch users can explore the SZO further by importing the 12 new trading rules from the shared area of the StrataSearch user forum. After installing the trading rules, users can run an automated search alongside thousands of supporting indicators to see just how well the sentiment zone oscillator can perform.
A sample chart of the sentiment zone oscillator in Strata-Search is shown in Figure 8.
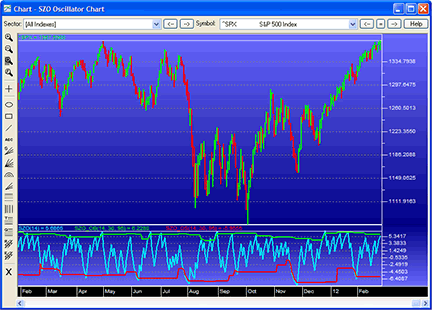
FIGURE 8: STRATASEARCH, SENTIMENT ZONE OSCILLATOR. In the bottom panel, the sentiment zone oscillator periodically crosses the dynamic overbought and oversold lines for the S&P 500 index.
//*******************************************************
// Sentiment Zone Oscillator
//*********************************************************
PD = parameter("Period");
R =if(C > ref(C,-1), 1, -1 );
SP = tema(R, PD);
SZO = 100 * (SP/ PD);

//*********************************************************
// Sentiment Zone Oscillator - Overbought Line
//*********************************************************
Days = parameter("Days");
LongPeriod = parameter("LongPeriod");
Percent = parameter("Percent");
HLP = high(SZO(Days), LongPeriod);
LLP = low(SZO(Days), LongPeriod);
Range = HLP - LLP;
Prange = Range *(Percent/100);
OB = LLP + Prange;
OS = HLP - Prange;
SZO_OB = OB;

//*********************************************************
// Sentiment Zone Oscillator - Oversold Line
//*********************************************************
Days = parameter("Days");
LongPeriod = parameter("LongPeriod");
Percent = parameter("Percent");
HLP = high(SZO(Days), LongPeriod);
LLP = low(SZO(Days), LongPeriod);
Range = HLP - LLP;
Prange = Range *(Percent/100);
OB = LLP + Prange;
OS = HLP - Prange;
SZO_OS = OS;

The AIQ code for Walid Khalil’s sentiment zone oscillator and related system from his article in this issue, “Sentiment Zone Oscillator,” is provided at www.TradersEdgeSystems.com/traderstips.htm.
Using the author’s system that is described in the article, I ran a test on the NASDAQ 100 list of stocks using the Portfolio Manager module. The following capitalization settings were used:
In Figure 9, I show the equity curve for long-only trading on the NASDAQ 100 list of stocks for the period 12/31/1999 to 3/16/2012. The return averaged 10.3% per year with a maximum drawdown of 56.5% on 3/9/2009. The trend filters that are applied to each stock in the system did not prevent the large drawdown during the two bear markets in the test period. Applying an index-based trend filter might improve the results, but I did not try this due to time constraints.
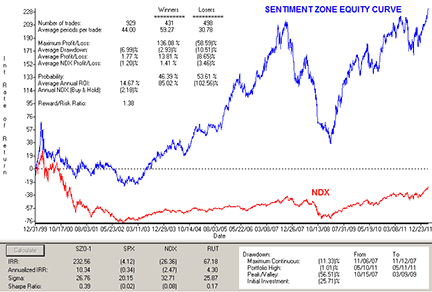
FIGURE 9: AIQ, SENTIMENT ZONE OSCILLATOR. Shown here is the equity curve for a trading simulation for the sentiment zone oscillator system on the NASDAQ 100 list of stocks for the period 12/31/99 to 3/16/12 (blue line) compared to the buy & hold on the NDX index (red line).
The code and EDS file can be downloaded from www.TradersEdgeSystems.com/traderstips.htm and is also shown here.
!SENTIMENT ZONE OSCILLATOR
!Author: Walid Khailil, TASC May 2012
!Coded by: Richard Denning 3/14/12
!www.TradersEdgeSystems.com

!ABBREVIATIONS:
C 	is [close].
C1	is valresult(C,1).
H 	is [high].
L 	is [low].
O 	is [open].
V	is [volume].
avgV	is expavg(V,50).
smaC	is simpleavg(C,10).

!INPUTS:
szoLen is 14.  	!SZO PARAMETER
trendEMAlen is 60.  !LENTH FOR TREND DETERMINATION
longLen is 30. 	!LONG PERIOD SMOOTHING FOR SZO
percent is 95.  !PERCENTAGE OF RANGE
sellLevel is 7.
filter is 0.24.

!SZO OSCILLATOR:
R is iff(C > C1,1,-1).

rEMA is expavg(R,szoLen).
rTEMA is (3*rEMA) - (3*expavg(rEMA,szoLen))
	+ (expavg(expavg(rEMA,szoLen),szoLen)).
SZO is 100*(rTEMA / szoLen).
szoHLP is highresult(SZO,longLen).
szoLLP is lowresult(SZO,longLen).
szoRng is szoHLP - szoLLP.
szoPctRng is szoRng * (percent/100).
szoOB is szoLLP + szoPctRng.
szoOS is szoHLP - szoPctRng.
szoMA is simpleavg(szo,longLen).
EMAtrend is expavg(C,trendEMAlen).

!SZO TRADING SYSTEM RULES:

!BUYING CONDITION RULES:
SZOmaXOzero if szoMA > filter
	and not valrule(szoMA > filter,1).
TrendUp if C > EMAtrend.
SZOovrSld if SZO < szoOS.
SZOmaUp if SZO > valresult(SZO,1).
SZOgtZero if SZO > 0.
SZOxoLLP if valrule(SZOovrSld,1) and not SZOovrSld.
EMAUp if EMAtrend > valresult(EMAtrend,1).

BuyCond1 if SZOmaXOzero and TrendUP.
BuyCond2 if TrendUp and SZOovrSld
	and szoMA > valresult(szoMA,1).
BuyCond3 if SZOgtZero and SZOxoLLP and EMAUp.

Buy if BuyCond1 or BuyCond2 or BuyCond3.

!SELLING CONDITION RULES:
SellCond1 if szoMA < -filter
	and not valrule(szoMA < -filter,1).
SellCond2 if szo < sellLevel
	and not valrule(szo < sellLevel,1)
	and szoMA < valresult(szoMA,1).

Sell if SellCond1 or SellCond2.

!RELATIVE STRENGTH UDF FOR SELECTING TRADES:
STL is 32.	!RELATIVE STRENGTH LENGTH
Price1 is C. Price2 is C.
aL	is STL * 0.25.
RC3	is (valresult(Price1,3*aL)/valresult(Price2,4*aL)-1)*100.
RC2	is (valresult(Price1,2*aL)/valresult(Price2,3*aL)-1)*100.
RC1	is (valresult(Price1,1*aL)/valresult(Price2,2*aL)-1)*100.
RC0	is (valresult(Price1,0*aL)/valresult(Price2,1*aL)-1)*100.
RS_AIQs	is 0.4*RC0 + 0.2*RC1 + 0.2*RC2 + 0.2*RC3.

ShowValues if C > 0.

The TradersStudio code for Walid Khalil’s article in this issue, “Sentiment Zone Oscillator,” is provided at the following websites:
www.TradersEdgeSystems.com/traderstips.htm
www.TradersStudio.com → Traders Resources → Traders Tips
The code is also shown below.
The following files are provided in the download:
In Figure 10, I show the indicator on a chart of Apple Inc. for part of 2011. The chart also shows the buy arrows along with the exits for several trades from the system.
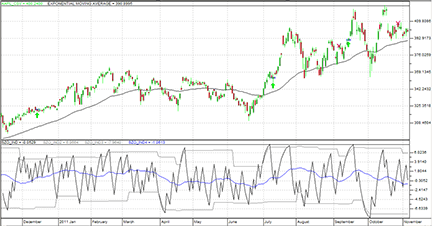
FIGURE 10: TRADERSSTUDIO, SENTIMENT ZONE OSCILLATOR. Here is the SZO indicator with overbought/oversold levels and the moving average of the indicator on a chart of Apple Inc. together with buy arrows and exit Xs for several of the trades from author Walid Khalil’s system that uses the SZO indicator.
Code for TradersStudio:

'SENTIMENT ZONE OSCILLATOR
'Author: Walid Khailil, TASC May 2012
'Coded by: Richard Denning 3/17/12
'www.TradersEdgeSystems.com

function SZO(szoLen)
Dim R As BarArray
Dim SP As BarArray
R = IIF(C>C[1],1,-1)
SP = TEMA(R,szoLen)
SZO = 100 * (SP / szoLen)

End Function
'-------------------------------------
' TRIPPLE EXPONENTIAL MOVING AVERAGE:
Function TEMA(price,temaLen)
    Dim EMA As BarArray
    EMA = XAverage(price, temaLen, 0)
    TEMA = (3 * EMA) - (3 * XAverage(EMA,temaLen)) + (XAverage(XAverage(EMA,temaLen),temaLen))
End Function
'---------------------------------------------------------------------------------------------
Sub SZO_IND(szoLen,longLen,pctRange)
'defaults szoLen = 14,trendEMAlen = 60,longLen = 30,
'         pctRange = 95,sellLevel = 7,filter = 0.24
Dim theSZO As BarArray
Dim szoMA As BarArray
Dim emaTrend As BarArray
Dim szoHLP, szoLLP, szoRng, szoPctRng, szoOB, szoOS
Dim SZOmaXOzero, trendUp, SZOmaUp, SZOgtZero, SZOxoLLP, EMAup
Dim SZOovrSld As BarArray
Dim BuyCond1, BuyCond2, BuyCond3, SellCond1, SellCond2
theSZO = SZO(szoLen)
szoHLP = Highest(theSZO,longLen)
szoLLP = Lowest(theSZO,longLen)
szoRng = szoHLP - szoLLP
szoPctRng = szoRng * pctRange/100
szoOB = szoLLP + szoPctRng
szoOS = szoHLP - szoPctRng
szoMA = Average(theSZO,longLen)

plot1 (theSZO)
plot2 (szoOB)
plot3 (szoOS)
plot4 (szoMA)

End Sub
'----------------------------------------------------------------
Sub SZO_Sys(szoLen,trendEMAlen,longLen,pctRange,sellLevel,filter)
'defaults szoLen = 14,trendEMAlen = 60,longLen = 30,
'         pctRange = 95,sellLevel = 7,filter = 0.24
Dim theSZO As BarArray
Dim szoMA As BarArray
Dim emaTrend As BarArray
Dim szoHLP, szoLLP, szoRng, szoPctRng, szoOB, szoOS
Dim SZOmaXOzero, trendUp, SZOmaUp, SZOgtZero, SZOxoLLP, EMAup
Dim SZOovrSld As BarArray
Dim BuyCond1, BuyCond2, BuyCond3, SellCond1, SellCond2
theSZO = SZO(szoLen)
szoHLP = Highest(theSZO,longLen)
szoLLP = Lowest(theSZO,longLen)
szoRng = szoHLP - szoLLP
szoPctRng = szoRng * pctRange/100
szoOB = szoLLP + szoPctRng
szoOS = szoHLP - szoPctRng
szoMA = Average(theSZO,longLen)
emaTrend = XAverage(C,trendEMAlen)
SZOmaXOzero = CrossesOver(szoMA,filter)
trendUp = C > emaTrend
SZOovrSld = theSZO < szoOS
SZOmaUp = theSZO > theSZO[1]
SZOgtZero = theSZO > 0
SZOxoLLP = CrossesOver(theSZO,szoOS)
EMAup = emaTrend > emaTrend[1]

BuyCond1 = SZOmaXOzero And trendUp
BuyCond2= trendUp And SZOovrSld And szoMA > szoMA[1]
BuyCond3 = SZOgtZero And SZOxoLLP And EMAup
If BuyCond1 Or BuyCond2 Or BuyCond3 Then Buy("LE",1,0,Market,Day)

SellCond1 = CrossesUnder(szoMA,-filter)
SellCond2 = CrossesUnder(theSZO,sellLevel) And szoMA < szoMA[1]
If SellCond1 Or SellCond2 Then ExitLong("LX","",1,0,Market,Day)
End Sub
'----------------------------------------------------------------

The SZOATS and SZO indicators, as discussed by author Walid Khalil in “Sentiment Zone Oscillator” in this issue, have been implemented as an automated strategy and indicator available for download at www.ninjatrader.com/SC/May2012SC.zip.
Once downloaded, from within the NinjaTrader Control Center window, select the menu File → Utilities → Import NinjaScript and select the downloaded file. This file is for NinjaTrader version 7 or greater.
You can review the strategy’s source code by selecting the menu Tools → Edit NinjaScript → Strategy from within the NinjaTrader Control Center window and selecting “SZOATS.”
You can review the indicator’s source code by selecting the menu Tools → Edit NinjaScript → Indicator from within the NinjaTrader Control Center window and selecting the SZO.
A sample chart implementing the strategy is shown in Figure 11.
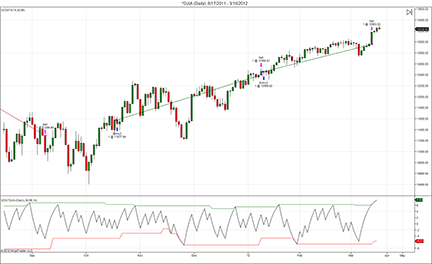
FIGURE 11: NINJATRADER, SENTIMENT ZONE OSCILLATOR. The NinjaTrader screenshot shows the SZOATS and related indicator applied to a daily chart of Dow Jones Industrial Average (∧DJIA).

In his article “Sentiment Zone Oscillator” in this issue, author Walid Khalil presents an indicator that measures extreme bullishness and bearishness and helps identify a change in sentiment.
Using Tradecision’s Indicator Builder, create the following indicators:
SZO indicator:
inputs
Period: "Period", 14, 1, 100;
end_inputs
var

R:= iff (C> C\1\, 1,-1);
SP:= TEMA (R, Period);
SZO:=100 * (SP/ Period);
end_var

return SZO;

SZO top indicator:
inputs
Period: "Period", 14, 1, 100;
end_inputs
var

R:= iff (C> C\1\, 1,-1);
SP:= TEMA (R, Period);
SZO:=100 * (SP/ Period);
LongPeriod:=30;
Perc:=95;
HLP:= Highest(SZO, LongPeriod);
LLP:= Lowest(SZO, LongPeriod);
Range1:= HLP - LLP;
Prange:= Range1 *(Perc/100);
OB:= LLP + Prange;
end_var

return OB;

SZO bottom indicator:
inputs
Period: "Period", 14, 1, 100;

end_inputs
var

R:= iff (C> C\1\, 1,-1);
SP:= TEMA (R, Period);
SZO:=100 * (SP/ Period);
LongPeriod:=30;
Perc:=95;
HLP:= Highest(SZO, LongPeriod);
LLP:= Lowest(SZO, LongPeriod);
Range1:= HLP - LLP;
Prange:= Range1 *(Perc/100);
OS:= HLP - Prange;
end_var

return OS;
To import the strategy into Tradecision, visit the area “Traders' Tips from TASC Magazine” at www.tradecision.com/support/tasc_tips/tasc_traders_tips.htm or copy the code above.
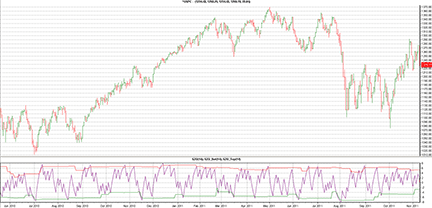
FIGURE 12: TRADECISION, S&P 500 WITH SENTIMENT ZONE OSCILLATOR (SZO). Here is the sentiment zone oscillator with overbought and oversold levels plotted on a ∧GSPC daily chart.

The indicators presented in Walid Khalil’s article in this issue, “Sentiment Zone Oscillator,” can easily be used with our online charting tool at www.tradesignalonline.com. Check the Infopedia section for our lexicon. There, you will find the indicator and functions, which you can make available for your personal account. Simply click on it and select “open script.” The indicator will be immediately available for application.
The code can also be downloaded here:
Sentiment Zone Osc Strategy.eqs
Sentiment Zone Oscillator.eqi
TEMA.eqf
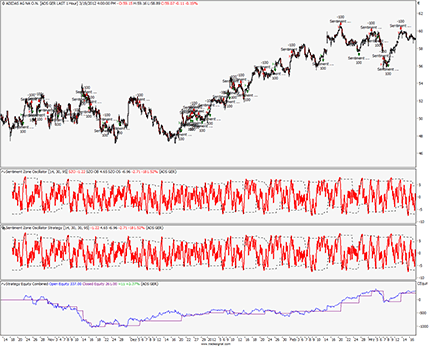
FIGURE 13: TRADESIGNAL ONLINE, SENTIMENT ZONE OSCILLATOR. Here is a sample TradeSignal Online chart showing the sentiment zone oscillator and sentiment zone oscillator strategy on an hourly chart of Adidas.
Source code for sentiment zone oscillator strategy.eqs
Meta:
	Synopsis("The Sentiment Zone Oscillator Strategy TAS&C 05/2012."),
	WebLink("https://www.tradesignalonline.com/lexicon/view.aspx?id=18091"),
	Subchart( True );

Inputs:
	Period( 14 , 2, 200 ),
	Trigger( 30 , 1 ),
	LongPeriod( 30 , 1 ),
	Percent( 95 , 1 );


Vars:
	r, sentPos, sentimentOscillator, hhLevel, llLevel, szoRange,
	pRange, upperBorder, lowerBorder, avgSZO,

	longCond1, longCond2, longCond3, shortCond1, shortCond2;

If Close > Close[1] Then
	r = 1
Else r =  - 1;

sentPos = TEMA( r, Period );
sentimentOscillator = 100 * ( sentPos / Period );
avgSZO = Average( sentimentOscillator, Trigger );

hhLevel = Highest( sentimentOscillator, LongPeriod );
llLevel = Lowest( sentimentOscillator, LongPeriod );
szoRange = hhLevel - llLevel;
pRange = szoRange * ( Percent / 100 );

upperBorder = llLevel + pRange;
lowerBorder = hhLevel - pRange;

longCond1 = avgSZO Crosses Over 0;

value1 = XAverage( Close, 60 );
longCond2 = Close > value1 And sentimentOscillator < lowerBorder And avgSZO > avgSZO[1];
longCond3 = sentimentOscillator > 0 And sentimentOscillator Crosses Over lowerBOrder;

If longCond1 Or longCond2 Or longCond3 Then
	BUy This Bar on CLose;

shortCond1 = avgSZO Crosses Under 0;
shortCond2 = sentimentOscillator Crosses Under 7 And avgSZO < avgSZO[1];

If shortCond1 Or shortCond2 Then
	Short This Bar on Close;

DrawLine( sentimentOscillator, "SZO", StyleSolid, 2, Red );
DrawLine( upperBorder, "SZO OB", StyleDash, 1, Black );
DrawLine( lowerBorder, "SZO OS", StyleDash, 1, Black );

// *** Copyright tradesignal GmbH ***
// *** www.tradesignal.com ***
Source code for sentiment zone oscillator.eqi
Meta:
	Synopsis("The Sentiment Zone Oscillator TAS&C 05/2012."),
	WebLink("https://www.tradesignalonline.com/lexicon/view.aspx?id=18091"),
	Subchart( True );

Inputs:
	Period( 14 , 2, 200 ),
	LongPeriod( 30 , 1 ),
	Percent( 95 , 1 );


Vars:
	r, sentPos, sentimentOscillator, hhLevel, llLevel, szoRange,
	pRange, upperBorder, lowerBorder;

If Close > Close[1] Then
	r = 1
Else r =  - 1;

sentPos = TEMA( r, Period );
sentimentOscillator = 100 * ( sentPos / Period );

hhLevel = Highest( sentimentOscillator, LongPeriod );
llLevel = Lowest( sentimentOscillator, LongPeriod );
szoRange = hhLevel - llLevel;
pRange = szoRange * ( Percent / 100 );

upperBorder = llLevel + pRange;
lowerBorder = hhLevel - pRange;

DrawLine( sentimentOscillator, "SZO", StyleSolid, 2, Red );
DrawLine( upperBorder, "SZO OB", StyleDash, 1, Black );
DrawLine( lowerBorder, "SZO OS", StyleDash, 1, Black );

// *** Copyright tradesignal GmbH ***
// *** www.tradesignal.com ***
Source code TEMA.eqf
Meta:
	Synopsis("The function calculates a zero lag moving average.");

Inputs:
	priceSeries( NumericSeries ),
	periodMA( NumericSimple );

TEMA = ( 3 * XAverage( priceSeries, periodMA ) ) - ( 3 * XAverage( XAverage( priceSeries, periodMA ), periodMA ) ) +
XAverage( XAverage( XAverage( priceSeries, periodMA ), periodMA ), periodMA  );

// *** Copyright tradesignal GmbH ***
// *** www.tradesignal.com ***

This Traders’ Tip is based on the article in this issue by Walid Khalil, “Sentiment Zone Oscillator.” In the article, Khalil develops an oscillator to identify extremes in bullish and bearish sentiment, based on signed daily changes. As the indicator persists at extremes, a reversal becomes increasingly likely.
The Updata code for this technique has been entered in the Updata Library and you can download it by clicking the Custom menu and then Indicator Library. Those who cannot access the library due to a firewall may paste the code shown here into the Updata Custom editor and save it.
DISPLAYSTYLE 6LINES
INDICATORTYPE TOOL
INDICATORTYPE2 CHART
PARAMETER "SZO Period" #Period=14
PARAMETER "SZO Donchian Period" #DonchPeriod=30
PARAMETER "SZO Sig. Period" #SZOSigPeriod=30
PARAMETER "SZO Zero Line" @ZEROLine=0.24
PARAMETER "Range {%}" @PCT=95
PARAMETER "Close Sig. Period" #CLSigPeriod=60
NAME "Avg[" #CLSigPeriod "]" ""
NAME2 "SZO[" #Period "|" #SZOSigPeriod "]" ""
PLOTSTYLE THICK2 RGB(0,0,200)
COLOUR3 RGB(200,0,0)
COLOUR4 RGB(150,150,150)
PLOTSTYLE5 THICK2 RGB(0,0,200)
PLOTSTYLE6 DASH RGB(0,200,0)
@UpDown=0
@UpDownSmooth=0
@SZO=0
@OB=0
@OS=0
@Range=0
@PercentageRange=0
@DynamicUpper=0
@DynamicLower=0
@CLSignalAvg=0
@SZOSignalAvg=0
FOR #CURDATE=MAX(#Period+#SZOSigPeriod,#CLSigPeriod) TO #LASTDATE
   @UpDown=SIGN(CLOSE-CLOSE(1))
   @UpDownSmooth=SGNL(@UpDown,#Period,E)
   @SZO=100*(@UpDownSmooth/#Period)
   @OB=HIST(PHIGH(@SZO,#DonchPeriod),1)
   @OS=HIST(PLOW(@SZO,#DonchPeriod),1)
   @CLSignalAvg=SGNL(CLOSE,#CLSigPeriod,E)
   @SZOSignalAvg=SGNL(@SZO,#SZOSigPeriod,E)
   @Range=@OB-@OS
   @PercentageRange=@Range*(@PCT/100)
   @DynamicUpper=@OS+@PercentageRange
   @DynamicLower=@OB-@PercentageRange
   'EXITS
   IF HASX(@SZO,@ZEROLine,UP) OR HASX(@SZO,(#Period/2),DOWN) AND @SZOSignalAvg<HIST(@SZOSignalAvg,1)
      SELL CLOSE
   ENDIF
   'ENTRIES
   IF CLOSE>@CLSignalAvg AND HASX(@SZOSignalAvg,@ZEROLine,UP)
      BUY CLOSE
   ELSEIF CLOSE>@CLSignalAvg AND @SZO<@DynamicLower AND @SZOSignalAvg>HIST(@SZOSignalAvg,1)
      BUY CLOSE
   ELSEIF @SZOSignalAvg>@ZEROLine AND HASX(@SZO,@DynamicLower,UP) AND @CLSignalAvg>HIST(@CLSignalAvg,1)
      BUY CLOSE
   ENDIF
   @PLOT=@CLSignalAvg
   @PLOT2=@SZO
   @PLOT3=@DynamicUpper
   @PLOT4=@DynamicLower
   @PLOT5=@SZOSignalAvg
   @PLOT6=@ZEROLine
NEXT
A sample chart is shown in Figure 14.
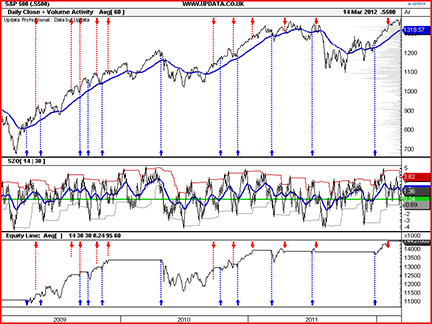
FIGURE 14: UPDATA, SENTIMENT ZONE OSCILLATOR. Here is the sentiment zone oscillator (14-period) with system rules added to the daily S&P 500 index.

We’re providing a script that adds the sentiment zone oscillator (SZO) with overbought and oversold levels to a ShareScope chart (see Figure 15). We’re also offering a script that adds a configuration dialog.
The source code for the script is shown below, and users can also download both scripts from our website at www.sharescript.co.uk.
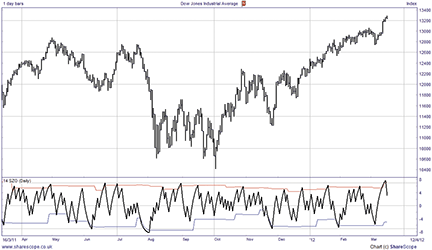
FIGURE 15: SHARESCOPE, SENTIMENT ZONE OSCILLATOR. Here is the sentiment zone oscillator with overbought & oversold levels.
//@Name:SZO
//@Description:Sentiment Zone Oscillator. As described on Stocks & Commodities magazine, May 2012 edition.
// Care has been taken in preparing this code but it is provided without guarantee.
// You are welcome to modify and extend it.  Please add your name as a modifier if you distribute it.
//Coded by: Richard Chiesa, ShareScript Support

var period = 14;
var longPeriod = 30;
var perc = 95;
function init(status)
{
	if (status == Loading || status == Editing)
	{
		period = storage.getAt(0);
		longPeriod = storage.getAt(1);
		perc = storage.getAt(2);
	}
	if (status == Adding || status == Editing)
	{
		dlg = new Dialog("SZO settings...", 145, 55);
		dlg.addOkButton();
		dlg.addCancelButton();
		dlg.addIntEdit("INT1",8,-1,-1,-1,"","SZO Period",period,2,1000);
		dlg.addIntEdit("INT2",8,-1,-1,-1,"","Long Period",longPeriod,2,1000);
		dlg.addIntEdit("INT3",8,-1,-1,-1,"","Percent",perc,1,100);
		if (dlg.show()==Dialog.Cancel)
			return false;
		period = dlg.getValue("INT1");
		longPeriod = dlg.getValue("INT2");
		perc = dlg.getValue("INT3");

		storage.setAt(0, period);
		storage.setAt(1, longPeriod);
		storage.setAt(2, perc);
	}
	setSeriesLineStyle(0,0,1);
	setSeriesColour(1, Colour.Red);
	setSeriesColour(2, Colour.Blue);
	setTitle(period+" SZO");
	setHorizontalLine(7);
	setHorizontalLine(0);
	setHorizontalLine(-7);
}
function getGraph(share, data)
{
	var SZO = [];
	var ma1 = new TEMA(period);
	var OB = [];
	var OS = [];
	for (var i=1; i<data.length; i++)
	{
		var tema1 = ma1.getNext(data[i].close>data[i-1].close?1:-1);
		SZO[i] = 100*tema1/period;
		var hh = 0;
		var ll = 1000;
		if (i>=longPeriod)
		{
			for (var j=0; j<longPeriod; j++)
			{
				hh=SZO[i-j]>hh?SZO[i-j]:hh;
				ll=SZO[i-j]<ll?SZO[i-j]:ll;
			}
			var range = (hh-ll)*perc/100;
			OB[i] = ll+range;
			OS[i] = hh-range;
		}
	}

	return [SZO,OB,OS];
}

function TEMA(p)
{
	this.period = p;
	this.emaVal1;
	this.emaVal2;
	this.emaVal3;
}

TEMA.prototype.getNext = function (price)
{
	var ma1 = new MA(this.period, MA.Exponential);
	var ma2 = new MA(this.period, MA.Exponential);
	var ma3 = new MA(this.period, MA.Exponential)
	if (this.emaVal1 != undefined) this.emaVal1 = ma1.getNext(this.emaVal1);
	this.emaVal1 = ma1.getNext(price);
	if (this.emaVal2 != undefined) this.emaVal2 = ma2.getNext(this.emaVal2);
	this.emaVal2 = ma2.getNext(this.emaVal1);
	if (this.emaVal3 != undefined) this.emaVal3 = ma3.getNext(this.emaVal3);
	this.emaVal3 = ma3.getNext(this.emaVal2);
	var tema = 3*this.emaVal1-3*this.emaVal2+this.emaVal3;
	return tema;
}

Our Traders’ Tip is based on “Sentiment Zone Oscillator” by Walid Khalil in this issue. In the article, Kahlil introduces the sentiment zone oscillator (SZO). The SZO is a contrary oscillator that measures extreme bullishness (optimism) and bearishness (pessimism). It’s plotted on a vertical scale of +100 to -100. The SZO crossing above +7 (overbought) indicates a buy signal while crossing below -7 (oversold) indicates a sell signal. The zero level does not have any importance according to Khalil.
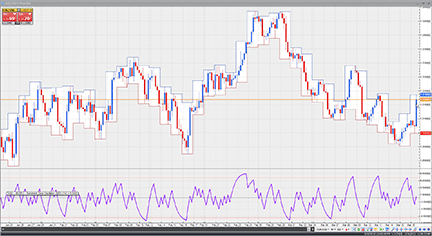
FIGURE 16: VT TRADER, SENTIMENT ZONE OSCILLATOR. Here is the SZO indicator on a EUR/USD four-hour candlestick chart.
We’ll be offering the sentiment zone oscillator for download in our VT client forums at https://forum.vtsystems.com along with hundreds of other precoded and free indicators and trading systems. The VT Trader instructions for recreating the indicator are shown below.
Name: TASC - 05/2012 - Sentiment Zone Oscillator (SZO)
Function Name Alias: tasc_SZO
Label Mask: TASC - 05/2012 - Sentiment Zone Oscillator (SZO) (%Periods%) = %SZO%
Placement: New Frame
Data Inspection Alias: Sentiment Zone. Osc.
[New] button...
Name: Periods
Display Name: Periods
Type: integer
Default: 14
[New] button...
Var Name: SZO
Name: (SZO)
Line Color: purple
Line Width: 2
Line Type: solid
[New] button...
Value: +7
Line Color: red
Line Width: thin
Line Type: dashed

[New] button...
Value: 0
Line Color: black
Line Width: thin
Line Type: dashed

[New] button...
Value: -7
Line Color: red
Line Width: thin
Line Type: dashed
{Provided By: Visual Trading Systems, LLC}
{Copyright: 2012}
{Description: TASC, May 2012 - "Exploiting Extremes" by Walid Khalil}
{File: tasc_SZO.vtscr - Version 1.0}

R:= If(C>Ref(C,-1),1,-1);
SP:= vt_tema(R,Periods,E);
SZO:= 100*(SP/Periods);
To attach the indicator to a chart click the right mouse button within the chart window and then select “Add Indicator” → “TASC - 05/2012 - Sentiment Zone Oscillator (SZO)” from the indicator list.
To learn more about VT Trader, visit www.vtsystems.com.
Risk disclaimer: Past performance is not indicative of future results. Forex trading involves a substantial risk of loss and may not be suitable for all investors.

Here we will show you how to recreate the custom indicators and highlight zones featured in this issue’s article, “Sentiment Zone Oscillator” by Walid Khalil using TradeSense code in Trade Navigator. Some of the indicators needed come standard with Trade Navigator.
First, open the Trader’s Toolbox, click on the Functions tab and click the New button.
SZO: Type in the following code:
&R := IFF (Close > Close.1 , 1 , (-1))
&SP := TEMA (&R , Period , False)
&SZO := 100 * (&SP / Period)
&SZO
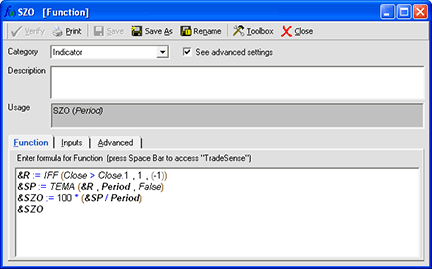
Click the verify button. Click the Add button on the Add Inputs window. For the period input, make the default value 14. When you are finished, click the save button, type a name for your new function, and click OK.
Repeat these steps for the SZO above 7, SZO below -7, SZO OB, and SZO OS, as follows.
SZO above 7: Type in the following code:
SZO (Period) > 7
For the period input, make the default value 14.
SZO below -7: Type in the following code:
SZO (Period) < (-7)
For the period input, make the default value 14.
SZO OB: Type in the following code:
&hlp := Highest (SZO (Period) , LongPeriod)
&llp := Lowest (SZO (Period) , LongPeriod)
&Range := &hlp - &llp
&Prange := &Range * (Percent / 100)
&llp + &Prange
For the inputs:
Period: 	14
LongPeriod: 	30
Percent: 	95
SZO OS: Type in the following code:
&hlp := Highest (SZO (Period) , LongPeriod)
&llp := Lowest (SZO (Period) , LongPeriod)
&Range := &hlp - &llp
&Prange := &Range * (Percent / 100)
&hlp - &Prange
For the inputs:
Period: 	14
LongPeriod: 	30
Percent: 	95
Creating the chart
Now that we have the function created, go to a daily chart and go to the Add To Chart window by clicking on the chart and typing “A” on the keyboard.
Click on the Indicators tab, find the indicators in the list and either doubleclick on them or highlight the name and click the Add button.
Note you can add more than one indicator at a time: First, click the name of an indicator to highlight it. Then, holding the Ctrl key down on the keyboard, click the name of other indicators to add and click the Add button when you have all desired indicators highlighted.
Indicators to add to the chart are:
MovingAvgX
SZO
SZO OB
SZO OS
To add the highlight bars, go to a daily chart and go to the Add To Chart window by clicking on the chart and typing “A” on the keyboard.
Click on the HighlightBars tab, find the Highlight Bars in the list and either double click on them or highlight the name and click the Add button.
Highlight bars to add to this chart are:
SZO above 7
SZO below -7
On the chart, click & drag the labels for MovingAvgX into the same pane as the price bars. Click and drag the labels for SZO OB and SZO OS into the same pane as the SZO indicator. You will need to adjust the values for the MovingAvgX.
Click on the chart and type “E.” Highlight the desired indicator and change it to the desired values and color in the chart settings window. Change the MovingAvgX Bars used in the average to 60.
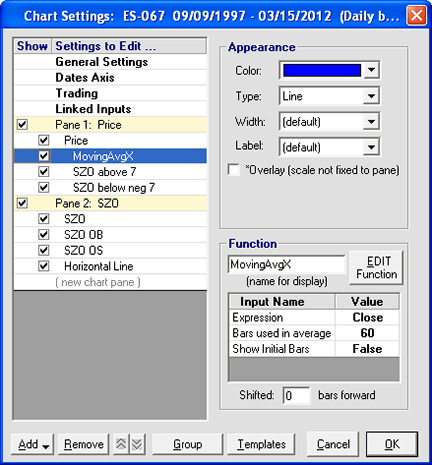
Highlight “SZO above 7” in the chart settings window. Change the Type to “Highlight Zones” and select a fill color.
Repeat these steps for SZO below -7.
When you have the indicators the way you want to see them, click on the Templates button, and click <Manage chart templates>. Then click on the New button, type a name for the template and click OK. You now have a template that you can add to any chart by selecting it from the Templates button menu.
Genesis Financial Technologies has provided a library called “sentiment zone oscillator” that includes a template of the same name containing the custom indicators discussed here plus highlight zones from Khalil’s article. You can download a special file named “SC201205” from within Trade Navigator to get this library.