INDICATORS
With A Simple Moving Average
In the high-risk arena of high-yield bonds, it’s a good idea to use a trading system that avoids large drawdowns. Try applying a simple moving average.
In 2008, when investors dumped assets of all kinds, high-yield bonds yielded about 20% interest. Since then, the subsequent rebound of about 75% has become so dramatic that many wonder if the high-yield bond market could be ready for another plunge.
The large drawdowns of high-yield bonds make for risky investing. Investors need to find a way to avoid these large down drafts, such as slightly improving the high-yield bonds’ total return by using an eight-month simple moving average (SMA).
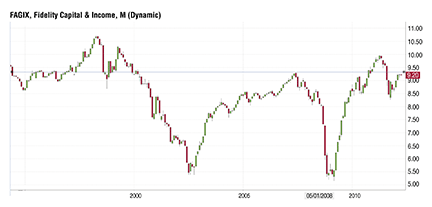
According to The Economist, high-yield bonds returned some 15% last year after a 58% rise in 2009. Price levels surpassed the highs of 2007 (see Figure 1). Since then, the returns have been partially fueled by income investors seeking higher yields in a low-return bond market. But too many people have evidently gone into the market at one time as investment banks have earned $5.8 billion in high-yield bond fees, more than they made from investment-grade bonds.

FIGURE 1: MONTHLY CHART OF FIDELITY HIGH INCOME FUND (FAGIX). Price highs of 2007 briefly exceeded in 2011 and are now hovering close to it.
Trend-following works well on high-yield bonds because they autocorrelate. Autocorrelation means that on an up day, the following day can be expected to be up also. Autocorrelation also works for down days, the upshot being that high-yield bonds form trends, and those tendencies can be identified with any moving average, especially one that avoids whipsaws.