TRADERS’ TIPS
June 2012
Here is this month’s selection of Traders’ Tips, contributed by
various developers of technical analysis software to help readers more easily
implement some of the strategies presented in this and other issues.
Other code appearing in articles in this issue is posted in the Subscriber
Area of our website at https://technical.traders.com/sub/sublogin.asp.
Login requires your last name and subscription number (from mailing label).
Once logged in, scroll down to beneath the “Optimized trading systems” area
until you see “Code from articles.” From there, code can be copied
and pasted into the appropriate technical analysis program so that no retyping
of code is required for subscribers.
You can copy these formulas and programs for easy use in your spreadsheet
or analysis software. Simply “select” the desired text
by highlighting as you would in any word processing program, then use your
standard key command for copy or choose “copy” from the browser
menu. The copied text can then be “pasted” into any open spreadsheet
or other software by selecting an insertion point and executing a paste command.
By toggling back and forth between an application window and the open web
page, data can be transferred with ease.

For this month’s Traders’ Tips, the focus is Brooke Gardner’s article in this issue, “Trading High-Yield Bonds Using ETFs.”
Code for eSignal (an EFS study) is already provided in Gardner’s article. Subscribers will find this code in the Subscriber Area of our website, Traders.com. (Click on “Article Code” from our homepage.) Presented here is additional code and possible implementations for other software.

TRADESTATION: EIGHT-BAR SIMPLE MOVING AVERAGE
In “Trading High-Yield Bonds Using ETFs” in this issue, author Brooke Gardner describes the construction and use of a strategy using an eight-bar simple moving average (SMA) of the close on a monthly chart of high-yield bonds (either mutual fund or ETF). The idea is to exit a short and buy when the monthly close is above the eight-bar SMA and to exit a long and sell short when the close is below the eight-bar SMA.
Shown here is EasyLanguage strategy code to enter a long position (if you are not currently long) if the close is above the eight-bar SMA and enter a short position (if you are not currently short) if the close is below the eight-bar SMA. The strategy allows for changing the price to be used for the moving average and the type of moving average to use (simple, exponential, or weighted).
To download the EasyLanguage code for the indicators, first navigate to the EasyLanguage FAQs and Reference Posts Topic in the EasyLanguage support forum (https://www.tradestation.com/Discussions/Topic.aspx?Topic_ID=47452), scroll down, and click on the link labeled “Traders’ Tips, TASC.” Then select the appropriate link for the month and year. The ELD filename is “_TASC_HYBondsWithSMA.ELD.”
_TASC_HYBondsWithSMA ( Strategy )
{ TASC Article - June 2012 }
{ Trading High-Yield Bonds Using ETFs }
{ by Brooke Gardner }

[IntrabarOrderGeneration = false]

inputs:
	Price( Close ),
	MALength( 8 ),
	MAType( 1 ),
	__SMA( "Enter 1 for MAType" ),
	__EMA( "Enter 2 for MAType" ),
	__Weighted( "Enter 3 for MAType" ) ;

variables:
	MP( 0 ),
	MA( 0 ) ;

MP = MarketPosition ;

switch ( MAType )
	begin
	Case 1: { Simple Moving Average }
	MA = Average( Price, MALength ) ;

	Case 2: { Exponential Moving Average }
	MA = XAverage( Price, MALength ) ;

	Case 3: { Weighted Moving Average }
	MA = WAverage( Price, MALength ) ;

	end ;

if MP <> 1 and Close > MA then
	Buy ( "HYB LE" ) next bar market ;

if MP <> -1 and Close < MA then
	SellShort ( "HYB SE" ) next bar market ;

{ error checking }
{ Throw error if not on Monthly Chart }
if BarType <> 4 then
	RaiseRunTimeError( "Code is designed" +
	 "for Monthly Bars." ) ;
A sample chart is shown in Figure 1.
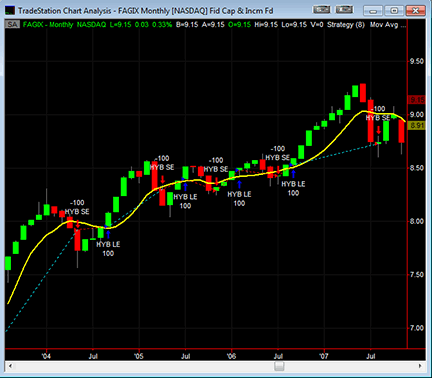
FIGURE 1: TRADESTATION, EIGHT-BAR SIMPLE MOVING AVERAGE. Here is a monthly bar chart of FAGIX with the EasyLanguage strategy code set to eight bars and a simple moving average inserted. The yellow plot is the built-in “Mov Avg 1 Line” (simple moving average) indicator set to eight bars.
This article is for informational purposes. No type of trading or investment recommendation, advice, or strategy is being made, given, or in any manner provided by TradeStation Securities or its affiliates.
—Chris Imhof
TradeStation Securities, Inc.
A subsidiary of TradeStation Group, Inc.
www.TradeStation.com
BACK TO LIST

BLOOMBERG: EIGHT-PERIOD SIMPLE MOVING AVERAGE
In “Trading High-Yield Bonds Using ETFs” in this issue, author Brooke Gardner demonstrates a system based on monthly bars utilizing an eight-period simple moving average as a buy/sell signal line. The author uses the Fidelity Capital & Income Fund (FAGIX US Equity) to demonstrate the system as a low-risk tool for determining position, reversing on closes crossing the moving average.
The Bloomberg chart in Figure 2 displays the system on the iShares Barclays Intermediate Credit Bond Fund (CIU US Equity). We have chosen this chart to demonstrate the successful long-term trades that can be triggered by this signal, along with some of the shorter-term reversals that you always need to be conscious of with any reversal system.
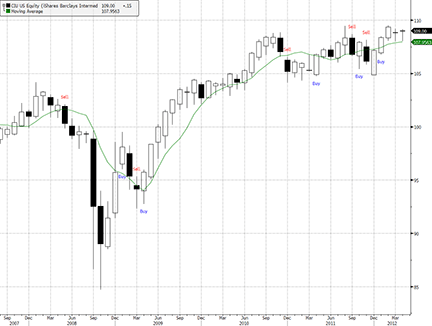
FIGURE 2: BLOOMBERG, EIGHT-BAR SIMPLE MOVING AVERAGE. Here is a monthly candlestick chart showing CIU US Equity since its 2007 inception. Text markers have been used to show the points of the close crossing the simple moving average. The Bloomberg CS.NET SDK has a variety of other marker types that could also be used to clearly mark trades.
The inception date for this security is January 2007. A sell signal generated at the end of May 2007 would have produced a profitable trade. Three quick reversals ensued in February, March, and April, with the buy signal in April generating a profitable trade lasting one and a half years. Since that trade closed, the market has been in a primarily trendless state, leading to small losers as the security price oscillates around the eight-period simple moving average.
Readers will notice that we have added a user-definable parameter called “BarsToShow” that will only show signals on the final x bars, as chosen in the properties dialog. This was done so that charts with a great deal of history may be shown with a less-cluttered look, showing only recent signals generated by the strategy.
The associated Bloomberg code for this strategy is written using the CS.NET framework within the STDY<GO> function on the Bloomberg terminal, written in C#. All Bloomberg code contributions to Traders’ Tips can also be found in the sample files provided with regular SDK updates, and the studies will be included in the Bloomberg global study list.
This strategy could also be backtested and the moving average period optimized using the new BT<GO> function available on Bloomberg.
using System;
using System.Collections.Generic;
using System.Text;
using System.Drawing;
using Bloomberg.Study.API;
using Bloomberg.Study.CoreAPI;
using Bloomberg.Study.Util;
using Bloomberg.Study.TA;
using Bloomberg.Math;

namespace Eight_Period_SMA
{

    public partial class EightPeriodSMA
    {
 // Moving Average Price selection
 public StudyPriceProperty Price = new StudyPriceProperty(PriceType.Close);

 // Choice of MA Type
        public StudyMATypeProperty MAType = new StudyMATypeProperty(Indicator.MAType.Simple);

 // Ability to set MA Period
 public StudyIntegerProperty MAPeriod = new StudyIntegerProperty(8, 1, int.MaxValue);

 // Number of bars from end of chart to display signals preventing early signals from cluttering chart
public StudyIntegerProperty BarsToShow = new StudyIntegerProperty(50);

        private void Initialize()
        {
            // Moving Average Line
            Output.Add("MA", new TimeSeries());
            StudyLine maLine = new StudyLine("MA", Color.Green); // Create a Moving Average Line
            maLine.Style = LineStyle.Solid;
            maLine.DisplayName = "Moving Average"; // Specify display name for MA line
            ParentPanel.Visuals.Add("MA", maLine); // Add the line to the price chart

            // Buy Signal
            Output.Add("BuySignal", new TimeSeries());
            TextMarker buysig = new TextMarker("Buy", Color.Blue); // Create a text marker for the Buy signal
            buysig.Offset = 15; // Set distance of text from price bar
            buysig.Size = 4; // Set size of text
            StudySignal buysignal = new StudySignal("BuySignal"); // Create the Signal to link to text
            ParentPanel.Visuals.Add("BuySignal", buysignal); // Add the signal to the price panel
            buysignal.Marker = buysig;
            buysig.Placement = MarkerPlacement.Low; // Place the signal below bar; system default is above bar

            // Sell signal
            Output.Add("SellSignal", new TimeSeries());
            TextMarker sellsig = new TextMarker("Sell", Color.Red);
            sellsig.Offset = 15;
            sellsig.Size = 4;
            StudySignal sellsignal = new StudySignal("SellSignal");
            ParentPanel.Visuals.Add("Sell Signal", sellsignal);
            sellsignal.Marker = sellsig;
        }

        public override void Calculate()
        {
            TimeSeries data = Input[Price.Value]; // Use time series specified by Price selection

     // Calculate the Moving Average and check for crosses
            TimeSeries ma = Indicator.MovingAverage(data, MAType.Value, MAPeriod.Value);
            TimeSeries buy = data.IsCrossingAbove(ma);
            TimeSeries sell = data.IsCrossingBelow(ma);
            // Clear out signals prior to BarsToShow parameter value
            for (int ii = 0; ii < data.Count - BarsToShow.Value; ii++)
            {
                    buy[ii] = 0;
                    sell[ii] = 0;
            }

     // Display the Moving Average and signals on the chart
     Output.Update("MA", ma);
            Output.Update("BuySignal", buy);
            Output.Update("SellSignal", sell);
        }

    }

}
—Bill Sindel
Bloomberg, LP
wsindel@bloomberg.net
BACK TO LIST

THINKORSWIM: SIMPLE EIGHT-PERIOD SMA STRATEGY
In “Trading High-Yield Bonds Using ETFs” in this issue, author Brooke Gardner gives us a new spin on the use of a classic moving average indicator. The article outlines a straightforward approach that compares the price of a security (a bond fund, for example) against its eight-month moving average to determine the appropriate trading direction. According to Gardner, this is intended specifically for use with high-yield bonds and their associated ETFs by virtue of their pricing movements. Simplicity can be a wonderful thing.
We have recreated the strategy in our proprietary scripting language, thinkScript. This will automatically display the buy and sell signals that would be employed using Gardner’s described technique (Figure 3). It can also be combined with our existing DailySMA study to plot the averages themselves.
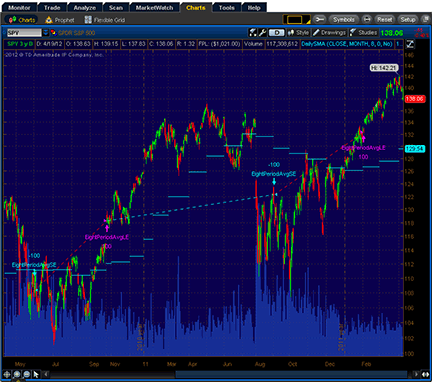
FIGURE 3: THINKORSWIM, EIGHT-BAR SIMPLE MOVING AVERAGE. Buy and sell signals based on Brooke Gardner’s technique are automatically displayed. You can also choose to display the prebuilt DailySMA study to plot the moving averages themselves.
The thinkScript code for the custom strategy is shown here along with instructions for applying both it and the prebuilt DailySMA study.
- From TOS Charts, select “Studies” → “Edit studies”
- Select the “Strategies” tab in the upper left-hand corner
- Select “New” in the lower left-hand corner
- Name the strategy (that is, “EightPeriodAvg”)
- Click in the script editor window, remove “addOrder(OrderType.BUY_AUTO, no);” and paste in the following:
input price = FundamentalType.CLOSE;
input length = 8;
input averageType = {default Simple, Exponential, Weighted, Wilders, Hull};

def isLastDayOfMonth = Floor(getYyyyMmDd() / 100) != Floor(getYyyyMmDd()[-1] / 100);;
def monthlyPrice = fundamental(price, period = AggregationPeriod.MONTH);
def monthlyAvg;
switch (averageType) {
case Simple:
    monthlyAvg = Average(fundamental(price, period = AggregationPeriod.MONTH), length);
case Exponential:
    monthlyAvg = ExpAverage(fundamental(price, period = AggregationPeriod.MONTH), length);
case Weighted:
    monthlyAvg = wma(fundamental(price, period = AggregationPeriod.MONTH), length);
case Wilders:
    monthlyAvg = WildersAverage(fundamental(price, period = AggregationPeriod.MONTH), length);
case Hull:
    monthlyAvg = HullMovingAvg(fundamental(price, period = AggregationPeriod.MONTH), length);
}

addOrder(OrderType.BUY_AUTO, monthlyAvg crosses below monthlyPrice and isLastDayOfMonth, tickcolor = GetColor(0), arrowcolor = GetColor(0), name = "EightPeriodAvgLE");
addOrder(OrderType.SELL_AUTO, monthlyAvg crosses above monthlyPrice and isLastDayOfMonth, tickcolor = GetColor(1), arrowcolor = GetColor(1), name = "EightPeriodAvgSE");
- Click OK
- (Optional) If you wish to add our prebuilt study “DailySMA,” click “Studies” at the upper left-hand corner of the “Edit studies and strategies” window
- Doubleclick “DailySMA” in the studies list at left
- In the “Properties: DailySMA” section of the page in the lower right quarter of the menu, change the aggregation period from “day” to “month”
- Immediately below that, change the length from “9” to “8”
- Select OK and you are good to go! Your study and strategy will both appear on your chart.
—thinkorswim
A division of TD Ameritrade, Inc.
www.thinkorswim.com
BACK TO LIST

WEALTH-LAB: EIGHT-BAR SIMPLE MOVING AVERAGE
Since the strategy for trading high-yield bonds presented in Brooke Gardner’s article in this issue, “Trading High-Yield Bonds Using ETFs,” is a simple monthly based strategy, I thought it would be interesting to see how it performed by varying the monthly period by day of month.
To do it, I set up an optimization that calculates the monthly moving average based on the net asset value (NAV) price for each day of the month from 1 to 28 as well as for the standard calendar month. The strategy rules remain the same, but the trades trigger on the specified day of the month.
Figure 4 shows the daily NAV prices synchronized with the monthly moving average, whereas Figure 5 has the optimization space plotted against the moving average period varying from 3 to 21. It’s interesting to note that trading FAGIX closer to the end (or beginning) of the month correlates with increased profits. In addition, a motivated trader can boost performance a bit by estimating the NAV and moving average values and trade on the trigger day instead of the next day.
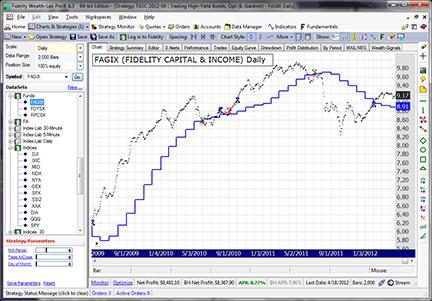
FIGURE 4: WEALTH-LAB, EIGHT-BAR SIMPLE MOVING AVERAGE. Although the chart is daily, trading occurs only on the transition from one monthly period to the next.
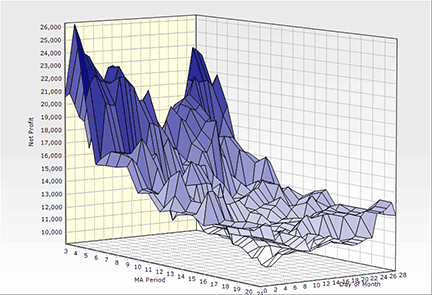
FIGURE 5: WEALTH-LAB, VARYING MOVING AVERAGE PERIODS. These results indicate that trading FAGIX is more profitable when using shorter periods of the moving average calculated near the end or beginning of the month.
Our WealthScript C# code is conveniently available for customers through the strategy download feature. It is also shown below.
using System;
using System.Drawing;
using System.Collections;
using WealthLab;
using WealthLab.Indicators;

namespace WealthLab.Strategies
{
   public class TradingHighYieldBonds : WealthScript
   {
      private StrategyParameter _period;
      private StrategyParameter _atClose;
      private StrategyParameter _dayOfMonth;

      private DateTime _endofMonth;
      private Queue _priceQueue = new Queue(); // FIFO queue

      private double AverageQueue()
      {
         if (_priceQueue.Count == 0) return 0;
         double sum = 0;
         foreach(Object obj in _priceQueue)
            sum += (double)obj;
         return sum / _priceQueue.Count;
      }

      public void SetNextMonth()
      {
         if (_dayOfMonth.ValueInt == 0) return;
         int y = _endofMonth.Year;
         int m = _endofMonth.Month;
         m++;
         if (m > 12)
         {
            m = 1;
            y++;
         }
         _endofMonth = new DateTime(y, m, _dayOfMonth.ValueInt);
      }

      public double MonthlyAverage(double currentPrice)
      {
         if (_priceQueue.Count == _period.ValueInt)
         {
            _priceQueue.Dequeue();
            _priceQueue.Enqueue(currentPrice);
            return AverageQueue();
         }
         else
         {
            _priceQueue.Enqueue(currentPrice);
            return AverageQueue();
         }
      }

      public TradingHighYieldBonds()
      {
         _period = CreateParameter("MA Period",8,3,21,1);
         _atClose = CreateParameter("Trade AtClose",0,0,1,1);
         _dayOfMonth = CreateParameter("Day of Month",0,0,28,1);
      }

      protected override void Execute()
      {
         int day = _dayOfMonth.ValueInt;
         bool tradeAtClose = _atClose.ValueInt == 1;
         bool isLastDayofMonth = false;
         _priceQueue = new Queue();

         DataSeries ma = new DataSeries(Bars, "Monthly Average(" + _period.ValueInt.ToString()
            + "), dayOfMonth = " + day.ToString());

         if (_dayOfMonth.ValueInt != 0)
            _endofMonth = new DateTime(Date[0].Year, Date[0].Month, day);

         ma[0] = Close[0];
         if (Date[0] >= _endofMonth)
            SetNextMonth();

         for(int bar = 1; bar < Bars.Count; bar++)
         {
            bool isLastBar = (bar == Bars.Count - 1);
            isLastDayofMonth = isLastBar;
            int today = Date[bar].Day;

            if (!isLastBar)
            {
               if (day == 0)   // test calendar months
                  isLastDayofMonth = Date[bar].Month != Date[bar + 1].Month;
               else if ( today == day || (Date[bar+1] > _endofMonth) )
                  isLastDayofMonth = true;
            }

            if (isLastDayofMonth)
            {
               SetBackgroundColor(bar, Color.FromArgb(30, Color.Blue));
               ma[bar] = MonthlyAverage(Close[bar]);
               SetNextMonth();
            }
            else
            {
               ma[bar] = ma[bar - 1];
               continue;
            }
            if (bar < _period.ValueInt) continue;

            if (IsLastPositionActive)
            {
               Position p = LastPosition;
               if (Close[bar] < ma[bar])
               {
                  if (tradeAtClose)
                     SellAtMarket(bar, p);
                  else
                     SellAtMarket(bar + 1, p);
               }
            }
            else if (Close[bar] > ma[bar])
            {
               if (tradeAtClose)
                  BuyAtClose(bar);
               else
                  BuyAtMarket(bar + 1);
            }
         }
         PlotSeries(PricePane, ma,Color.Blue, LineStyle.Solid, 2);
      }
   }
}
—Robert Sucher
www.wealth-lab.com
BACK TO LIST

AMIBROKER: EIGHT-BAR SIMPLE MOVING AVERAGE
In “Trading High-Yield Bonds Using ETFs” in this issue, author Brooke Gardner presents a basic moving average crossover system. Implementation of the moving average (MA) crossover is straightforward and the AmiBroker formula is presented here. To use it, enter the formula into the AFL Editor, then press the “Send to analysis” button to backtest, and “Insert indicator” to see the chart.
Periods = Param("Periods", 8, 2, 100 );

movavg = MA( C, Periods );

Buy = Cross( C, movavg );
Sell = Cross( movavg , C );

Plot( C, "Price", colorBlack, styleCandle );
Plot( movavg, "MA"+_PARAM_VALUES(), colorBlue );
A sample chart is shown in Figure 6.
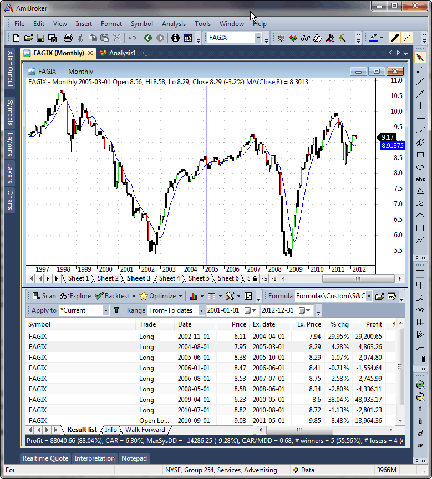
FIGURE 6: AMIBROKER, EIGHT-BAR SIMPLE MOVING AVERAGE. Here is a monthly chart of FAGIX with an eight-month simple moving average (upper window) and the backtest results (lower window).
—Tomasz Janeczko, AmiBroker.com
www.amibroker.com
BACK TO LIST

NEUROSHELL TRADER: EIGHT-BAR SIMPLE MOVING AVERAGE
The simple moving average crossover system discussed by Brooke Gardner in her article in this issue, “Trading High-Yield Bonds Using ETFs” can be easily implemented with a few of NeuroShell Trader’s 800+ indicators.
After loading a monthly chart, create the trading system by selecting “New trading strategy” from the Insert menu and enter the following in the appropriate locations of the trading strategy wizard:
Generate a buy long market order if all of the following are true:
A>B(Close, SimpleMovAvg(Close, 8))

Generate a sell long market order if all of the following are true:
A<B(Close, SimpleMovAvg(Close, 8))
If you have NeuroShell Trader Professional, you can also choose whether the parameters should be optimized. After backtesting the trading strategy, use the “Detailed analysis” button to view the backtest and trade-by-trade statistics for the strategy.
Users of NeuroShell Trader can go to the Stocks & Commodities section of the NeuroShell Trader free technical support website to download a copy of this or any previous Traders’ Tip.
A sample chart is shown in Figure 7.
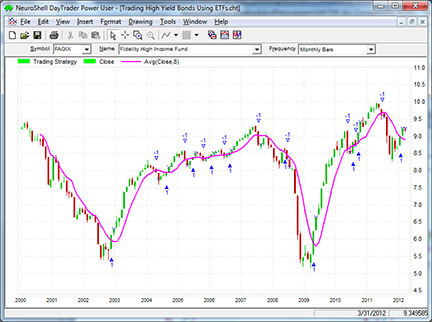
FIGURE 7: NEUROSHELL TRADER, EIGHT-BAR SIMPLE MOVING AVERAGE. This NeuroShell Trader chart displays the SMA timing strategy applied to Fidelity High Income Fund (FAGIX).
—Marge Sherald, Ward Systems Group, Inc.
301 662-7950, sales@wardsystems.com
www.neuroshell.com
BACK TO LIST

AIQ: EIGHT-BAR SIMPLE MOVING AVERAGE
The AIQ code for the monthly moving average and related system described in “Trading High-Yield Bonds Using ETFs” by Brooke Gardner in this issue is provided at the website noted below.
Although this is a simple moving average system, the use of the monthly data series presented a challenge, since the EDS module of the AIQ software does not provide access to a monthly bar. The charting module does support the monthly chart, but in the EDS code, the monthly bar cannot be accessed directly.
I tried two different approaches, and both seemed to work. The first one involved creating a monthly data series by downloading a monthly .csv file from Yahoo! Finance and then importing the data file into a newly created ticker using the DTU import utility. This worked but proved to be too much effort if I wanted to get several bond funds. In addition, the update would have to be done manually. To use this data file, we set the input “UseMoDataFile” to 1. Then I tried coding up a monthly close using daily data files. This took a bit of code but any daily data file will work, without modification, with this approach. To use a daily data file, set the “UseMoDataFile” to zero.
The other input parameter allows us to find the end of the month when using a daily data file. As one option, you could use the first day of the new month as the signal day by setting “UseEndOfMonthC” to zero. However, for backtesting and also to match the author’s approach, I set the “UseEndOfMonthC” to “1” so that we get the signals from the last bar of the month. In the EDS file for the backtest, I then enter on the open of the first bar of the month.
Figure 8 shows a daily chart of VVR with an eight-month moving average.
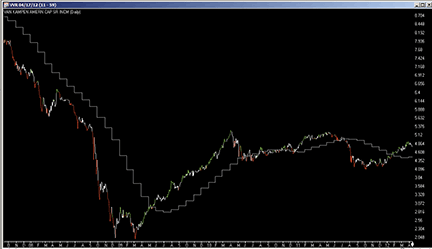
FIGURE 8: AIQ, EIGHT-BAR SIMPLE MOVING AVERAGE. Here is a daily chart of VVR (a high-yield bond fund) with an eight-month moving average.
This code and EDS file can be downloaded from www.TradersEdgeSystems.com/traderstips.htm. (The code is also shown below.
!TRADING HIGH-YIELD BONDS USING ETFs
!Author: Brooke Gardner
!Coded by: Richard Denning 04/17/12
!www.TradersEdgeSystems.com

!INPUTS:
UseMoDataFile is 0.
UseEndOfMonthC is 1.

!ABBREVIATIONS:
C is [close].
O is [open].
C1 is valresult(C,1).
OSD is offsettodate(month(),day(),year()).
SMA8 is simpleavg(C,8).
HD if hasdatafor(21*8+5)>= 21*8.

Mo is month().
Mo1 is valresult(month(),1).
NewMo if Mo <> Mo1.
OneMoBackDate is scanany(NewMo,25,1).
OneMoBackOS is scanany(NewMo,25,1) then OSD.
TwoMoBackOS is scanany(NewMo,25,^OneMoBackOS+1) then OSD.
ThreeMoBackOS is scanany(NewMo,25,^TwoMoBackOS+1) then OSD.
FourMoBackOS is scanany(NewMo,25,^ThreeMoBackOS+1) then OSD.
FiveMoBackOS is scanany(NewMo,25,^FourMoBackOS+1) then OSD.
SixMoBackOS is scanany(NewMo,25,^FiveMoBackOS+1) then OSD.
SevenMoBackOS is scanany(NewMo,25,^SixMoBackOS+1) then OSD.
EightMoBackOS is scanany(NewMo,25,^SevenMoBackOS+1) then OSD.

Cm is iff(UseEndOfMonthC = 1,C1,C).

MonC1 is valresult(Cm,^OneMoBackOS).
MonC2 is valresult(Cm,^TwoMoBackOS).
MonC3 is valresult(Cm,^ThreeMoBackOS).
MonC4 is valresult(Cm,^FourMoBackOS).
MonC5 is valresult(Cm,^FiveMoBackOS).
MonC6 is valresult(Cm,^SixMoBackOS).
MonC7 is valresult(Cm,^SevenMoBackOS).
MonC8 is valresult(Cm,^EightMoBackOS).

Cmo is iff(NewMo,Cm,MonC1).
Cmo1 is iff(NewMo,MonC1,MonC2).
Cmo2 is iff(NewMo,MonC2,MonC3).
Cmo3 is iff(NewMo,MonC3,MonC4).
Cmo4 is iff(NewMo,MonC4,MonC5).
Cmo5 is iff(NewMo,MonC5,MonC6).
Cmo6 is iff(NewMo,MonC6,MonC7).
Cmo7 is iff(NewMo,MonC7,MonC8).

EightMoSMA is iff(UseMoDataFile=0,(Cmo+Cmo1+Cmo2+Cmo3+Cmo4+Cmo5+Cmo6+Cmo7)/8,SMA8).

Buy if Cmo > EightMoSMA and HD.
Sell if Cmo < EightMoSMA and HD.

ListValues if 1.
—Richard Denning
info@TradersEdgeSystems.com
for AIQ Systems
BACK TO LIST

TRADERSSTUDIO: EIGHT-BAR SIMPLE MOVING AVERAGE
The TradersStudio code for Brooke Gardner’s article in this issue, “Trading High-Yield Bonds Using ETFs,” is provided at the following websites:
The following code files are provided in the download:
- Indicator Plot: “HY_BONDS_IND” for displaying the monthly SMA indicator.
- System: “HY_BONDS” for backtesting Brooke Gardner’s system.
When testing a strategy, TradersStudio has a rather unique feature that allows not only tracking the raw price series and split-adjusted price series, but also the contribution from dividends. This is an extremely important feature to get an accurate picture of this type of strategy and, for that matter, any dividend yield strategy.
In Figure 9, I show the indicator on a chart of COY. The chart also shows the buy arrows along with the exits for several trades from the system.
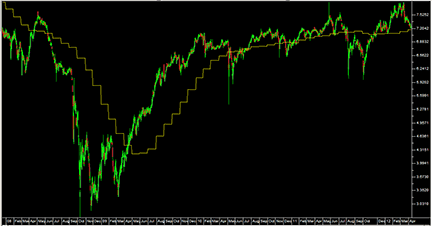
FIGURE 9: TRADERSSTUDIO, EIGHT-BAR SIMPLE MOVING AVERAGE. Here is a daily chart of COY with the monthly SMA indicator.
'TRADING HIGH-YIELD BONDS USING ETFs
'Author: Brooke Gardner
'Coded by: Richard Denning 04/17/12
'www.TradersEdgeSystems.com

Sub HY_BONDS(smaLen,doLongs,doShorts)
'defaults: smaLen = 8, doLongs = 1, doShorts = 0
'Note: traded series is daily; independent1 is monthly of the same bond fund
Dim SMAmo As BarArray
Dim MoDataC As BarArray
MoDataC = C Of independent1
SMAmo = Average(MoDataC,smaLen)

If MoDataC > SMAmo And C = MoDataC And doLongs = 1 Then Buy("LE",1,0,Market,Day)
If MoDataC < SMAmo Then ExitLong("LX","",1,0,Market,Day)
If MoDataC < SMAmo And C = MoDataC And doShorts = 1 Then Sell("SE",1,0,Market,Day)
If MoDataC > SMAmo Then ExitShort("SX","",1,0,Market,Day)
End Sub

'-----------------------------------------------------------------
Sub HY_BONDS_IND(smaLen)
Dim SMAmo As BarArray
Dim MoDataC As BarArray
MoDataC = C Of independent1
SMAmo = Average(MoDataC,smaLen)
plot1(SMAmo)
End Sub
'-----------------------------------------------------------------
—Richard Denning
info@TradersEdgeSystems.com
for TradersStudio
BACK TO LIST

STRATASEARCH: EIGHT-BAR SIMPLE MOVING AVERAGE
“Trading High-Yield Bonds Using ETFs” in this issue by Brooke Gardner may provide a simple strategy, but it suggests a couple of very important tips.
First, in many of our tests against other ETFs and stocks, the buy & hold approach often outperformed the simple eight-period SMA strategy in the long term, despite the fact that buy & hold had larger drawdowns. Traders therefore need to decide whether the highest average annual return alone determines the best system. As a trader, can you handle a 40% drawdown, and are you willing to wait two years for that position to recover? Or are you willing to give up some potential profits, knowing that you won’t need to witness such a scenario? This is a choice traders must make.
The second important tip from the article is that it is possible to have both micro level and macro level trading rules. Trading rules usually operate at the micro level, as you make buy and sell decisions based on the most recent and timely data. However, the method featured in Gardner’s article works at the macro level, evaluating performance at the monthly, rather than daily, level. The author’s point is that micro level and macro level trading rules can compliment each other greatly, working well together within the same trading system.
Within StrataSearch, we created two automated searches, one that always used the simple eight-period SMA strategy as a supporting trading rule, and one that did not. The automated searches then tested thousands of trading rule combinations. The difference was very apparent. The automated search using the simple eight-period SMA strategy tended to create systems with more consistent returns and lower drawdowns.
StrataSearch users can explore the simple eight-period SMA strategy further by importing the strategy or supporting trading rule from the shared area of the StrataSearch user forum. After installing the trading rule, users can run their own automated searches to see just how well this macro level filter can perform.
A sample chart showing the eight-period SMA strategy versus a buy & hold approach is shown in Figure 10.
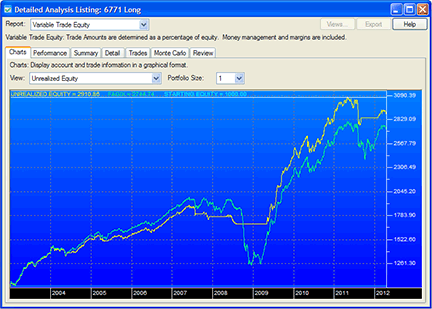
FIGURE 10: STRATASEARCH, EIGHT-BAR SIMPLE MOVING AVERAGE. A buy & hold strategy applied to FAGIX is shown in green. The simple eight-period SMA strategy shown in yellow avoids the large drawdowns of the buy & hold approach.
//*********************************************************
// Simple Eight-Period SMA Strategy
//*********************************************************
Entry String:
period(monthly, close) > period(monthly, mov(close, 8, simple))

Exit String:
period(monthly, close) < period(monthly, mov(close, 8, simple))
—Pete Rast, Avarin Systems Inc.
www.StrataSearch.com
BACK TO LIST

METASTOCK: EIGHT-BAR SIMPLE MOVING AVERAGE
Brooke Gardner’s article in this issue, “Trading High-Yield Bonds Using ETFs,” suggests that a basic system is the best and keeps it simple for retirees without trading software. However, the system can be entered into MetaStock to create a system test and an Expert Advisor. Here are the steps.
To create a system test:
- Select Tools → the Enhanced System Tester
- Click New
- Enter a name
- Select the Buy Order tab and enter the following formula:
Cross( C, Mov( C, 8, S) )
- Select the Sell Order tab and enter the following formula:
Cross( Mov( C, 8, S), C )
- Select the Sell Short Order tab and enter the following formula:
Cross( Mov( C, 8, S), C )
- Select the Buy to Cover Order tab and enter the following formula:
Cross( C, Mov( C, 8, S) )
- Click OK to close the system editor.
To make the Expert Advisor:
- Select Tools → Expert Advisor
- Click New to open the Expert Editor
- Type in a name for your expert
- Click the Symbols tab
- Click New to create a new symbol
- Type in the name “Buy”
- Click in the condition window and type in the formula:
Cross( C, Mov( C, 8, S) )
- Select the Graphics tab
- Set the symbol to the up arrow
- Set the color to green
- In the Label window, type “Buy”
- Set the symbol position to “Below price plot”
- Set the label position to “Below symbol”
- Click OK
- Click New to create a new symbol
- Type in the name “Sell”
- Click in the condition window and type in the formula:
Cross( Mov( C, 8, S), C )
- Select the Graphics tab
- Set the symbol to the down arrow
- Set the color to red
- In the Label window, type “Sell”
- Set the symbol position to “Above price plot”
- Set the label position to “Above symbol”
- Click OK
- Click OK to close the Expert Editor.
—William Golson
MetaStock Technical Support
Thomson Reuters, www.MetaStock.com
BACK TO LIST

TC2000 v12.1: TRADING HIGH-YIELD BONDS USING ETFs
You can combine TC2000.com’s charting, scanning, and sorting features to apply the eight-period SMA strategy discussed in Brooke Gardner’s article in this issue, “Trading High-Yield Bonds Using ETFs.”
Figure 11 shows a monthly chart of Fidelity High Income Fund (FAGIX) with an eight-month moving average. FAGIX is currently above its moving average midway through April as we write this, so we won’t know what the final signal will be until the end of the month. The green and red spikes in the bottom pane show the entry (green) and exit (red) points for the simple eight-period EMA strategy. The last signal on FAGIX was a buy at the end of January 2012 (circled on the chart).
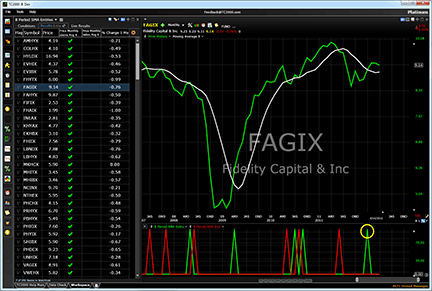
FIGURE 11: TC2000, EIGHT-BAR SIMPLE MOVING AVERAGE. The watchlist columns on the left show the symbol, latest price, and monthly percent change for each fund in the list of high-yield bonds. There are also two scan columns that display green checkmarks if the fund is above its eight-month SMA and red checkmarks if it is below its eight-month SMA.
Visit www.TC2000.com for a free trial of TC2000.
—Patrick Argo, Worden Brothers, Inc.
www.worden.com
BACK TO LIST

NINJATRADER: EIGHT-BAR SIMPLE MOVING AVERAGE
We have implemented BondSMAStrategy, which is discussed in Brooke Gardner’s “Trading High Yield Bonds Using ETFs” in this issue, as an automated strategy available for download at www.ninjatrader.com/SC/June2012SC.zip.
Once it’s been downloaded, from within the NinjaTrader Control Center window, select the menu File → Utilities → Import NinjaScript and select the downloaded file. This file is for NinjaTrader version 7 or greater.
You can review the strategy source code by selecting the menu Tools → Edit NinjaScript → Strategy from within the NinjaTrader Control Center window and selecting “Bond-SMAStrategy.”
NinjaScript uses compiled DLLs that run native, not interpreted, which provides you with the highest performance possible.
A sample chart implementing the strategy is shown in Figure 12.
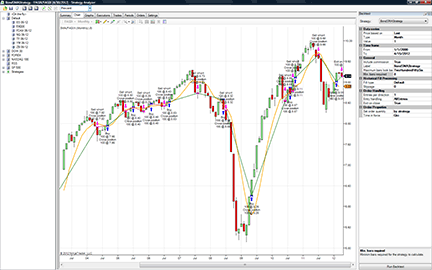
FIGURE 12: NINJATRADER, EIGHT-BAR SIMPLE MOVING AVERAGE. This screenshot shows the BondSMAStrategy, with backtest settings and chart applied to a monthly series of Fidelity Capital & Income Fund (FAGIX ).
—Raymond Deux & Ryan Millard
NinjaTrader, LLC
www.ninjatrader.com
BACK TO LIST

TRADECISION: EIGHT-BAR SIMPLE MOVING AVERAGE
In her article “Trading High-Yield Bonds Using ETFs” in this issue, author Brooke Gardner describes how to apply a simple moving average to high-yield bonds to avoid large drawdowns.
Using Tradecision’s Strategy Builder, you can recreate the simple eight-period SMA strategy as follows:
Entry Long:
return close > SMA(C,8);

Entry Short:
return close < SMA(C,8);
To import the strategy into Tradecision, visit the area “Traders’ Tips from TASC Magazine” at www.tradecision.com/support/tasc_tips/tasc_traders_tips.htm.
A sample chart implementation is shown in Figure 13.
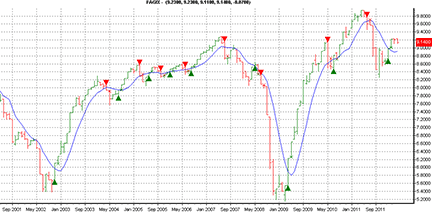
FIGURE 13: TRADECISION, EIGHT-MONTH SIMPLE MOVING AVERAGE. Here you see an eight-month simple moving average on a monthly chart of FAGIX with buy & sell signals marked on the chart.
—Yana Timofeeva, Alyuda Research
510 931-7808, sales@tradecision.com
www.tradecision.com
BACK TO LIST

SHARESCOPE: SIMPLE MOVING AVERAGES
The short script we’ve prepared based on “Trading High-Yield Bonds Using ETFs” by Brooke Gardner in this issue colors bars or candles based on whether they are above or below a specified moving average. The default setting is a 20-period simple moving average, but this can be changed when loading the script. We’ve also allowed a wide range of moving average types to be used: simple, exponential, weighted, triangular, variable VHF, variable CMO, and VIDYA. The moving average drawn on the chart in Figure 14 shows the crossover points.
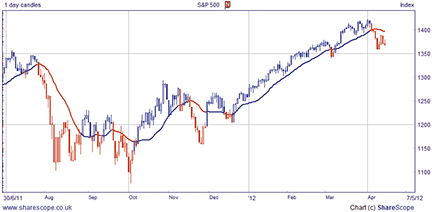
FIGURE 14: SHARESCOPE, MOVING AVERAGE. The ShareScope script colors bars or candles based on whether they are above or below a specified moving average. This chart shows the crossover points.
The code for the ShareScope script is shown below.
//@LibraryID:798,0
//@Name:Colour Change MA
//@Description:Changes the colour of the candles depending if they have closed above or below a moving average.

// Care has been taken in preparing this code but it is provided without guarantee.
// You are welcome to modify and extend it.  Please add your name as a modifier if you distribute it.

var period = 20;
var ma;
var outputList = ["Simple","Exponential", "Weighted", "Triangular" , "Variable VHF" , "Variable CMO" , "VIDYA"];
var title = ["SMA","EMA","WMA","TMA","VHF","CMO","VIDYA"];
var maType = 0;
var clrAbove = Colour.Blue;
var clrBelow = Colour.Red;


function init(status)
{
	 if (status == Loading || status == Editing)
	 {
		  period = storage.getAt(0);
		  maType = storage.getAt(1);
		  clrAbove = storage.getAt(2);
		  clrBelow = storage.getAt(3);
		 }
	 if (status == Adding || status == Editing)
	 {
		  dlg = new Dialog("MA Settings", 145, 65);
		  dlg.addOkButton();
		  dlg.addCancelButton();
		  dlg.addIntEdit("INT1",8,5,-1,-1,"","Period",period,2,1000);
		  dlg.addDropList("DL1",8,22,-1,-1,outputList,"","",maType);
		  dlg.addColPicker("COL1",8,45,-1,-1, "","Above", clrAbove);
		  dlg.addColPicker("COL2",75,45,-1,-1, "","Below", clrBelow);
		 	  if (dlg.show()==Dialog.Cancel)
		   return false;

		  period = dlg.getValue("INT1");
		  maType = dlg.getValue("DL1");
		  clrAbove = dlg.getValue("COL1");
		  clrBelow = dlg.getValue("COL2");


		  storage.setAt(0, period);
		  storage.setAt(1, maType);
		  storage.setAt(2, clrAbove);
		  storage.setAt(3, clrBelow);
	}

	setTitle("Close Above/Below"+ " " + period + " " +  title[maType])
}

function onNewChart()

{	var ma = new MA(period, maType);

	moveTo(0,bars[0].close)
	for (var i=0;i<bars.length;i++)
	{
		maVal = ma.getNext(bars[i].close)

		if (bars[i].close > maVal)
		{
			bars[i].colour = clrAbove;
			setPenStyle(Pen.Solid,1,clrAbove);
		}

	else
	{
		bars[i].colour = clrBelow;
		setPenStyle(Pen.Solid,1,clrBelow);
	}

	lineTo (i,maVal)
	}

}
—Tim Clarke
Sharescope
www.sharescript.co.uk
BACK TO LIST

TRADESIGNAL: EIGHT-BAR SIMPLE MOVING AVERAGE
The indicators described in “Trading High-Yield Bonds Using ETFs” by Brooke Gardner in this issue can be used with our online charting tool at www.tradesignalonline.com. Just check the Infopedia section for our lexicon. You will see the indicator and the functions there, which you can make available for your personal account. Click on it and select “open script.” The indicator will immediately be available to apply on any chart you wish. See Figure 15.
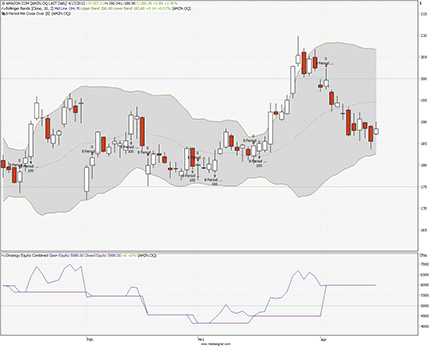
FIGURE 15: TRADESIGNAL ONLINE, EIGHT-BAR SIMPLE MOVING AVERAGE. Here, the eight-period MA crossover strategy is shown on a daily chart of Amazon.
Source Code for 8 Period MA Cross Over

Meta:
	Weblink("https://www.tradesignalonline.com/lexicon/view.aspx?id=18206"),
	Synopsis("The 8 period monthly ma cross over system, based on 'trading high yield bonds' tas&c 2012/06"),
	Subchart( False );

Inputs:
	Period( 8 , 1 );

Vars:
	maValue;

maValue = Average( Close, Period );

If Close Crosses Over maValue Then
	Buy Next Bar at Market;

If Close Crosses Under maValue Then Sell Next Bar at Market;

// *** Copyright tradesignal GmbH ***
// *** www.tradesignal.com ***
—Henning Blumenthal
Tradesignal GmbH
support@tradesignalonline.com
www.TradesignalOnline.com, www.Tradesignal.com
BACK TO LIST

TRADE NAVIGATOR: EIGHT-BAR SIMPLE MOVING AVERAGE
Here we will demonstrate how to recreate the strategy discussed in Brooke Gardner’s article in this issue, “Trading High-Yield Bonds Using ETFs.” The strategy is easy to recreate and test in Trade Navigator. For this example, we will use the symbol PCF (Putnam High Income Bond Fund).
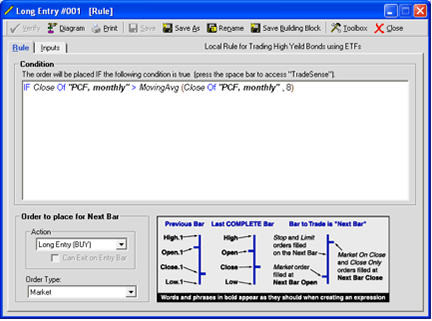
Go to the Strategies tab in the Trader’s Toolbox. Click on the “New” button. Click the “New rule” button. To set up the long entry rule, input the following code:
IF Close Of "PCF, monthly" > MovingAvg (Close Of "PCF, monthly" , 8)
Set the action to “Long Entry (Buy)” and the order type to “Market.” Click the save button. Type a name for the rule and click OK.
Repeat these steps for the short entry rule using the following code:
IF Close Of "PCF, monthly" < MovingAvg (Close Of "PCF, monthly" , 8)
Set the action to “Short Entry (SELL)” and the order type to “Market.” Be sure to set the “Allow entries to reverse” option on the Settings tab on the Strategy screen.
Save the strategy by clicking the save button, type a name for the strategy, and click OK.
You can test your new strategy by clicking the Run button to see a report or you can apply the strategy to a chart for a visual representation of where the strategy would place trades over the history of the chart.
Genesis has made this strategy a special downloadable file for Trade Navigator. Click on the blue phone icon in Trade Navigator, select “Download special file,” type “SC201206” and click on the Start button.
—Michael Herman
Genesis Financial Technologies
www.TradeNavigator.com
BACK TO LIST

UPDATA: EIGHT-BAR SIMPLE MOVING AVERAGE
Our Traders’ Tip this month is based on “Trading High-Yield Bonds Using ETFs” by Brooke Gardner. In the article, Gardner proposes a systematic approach to trading high-yield bond funds, which reduces the magnitude of drawdowns and the volatility of returns by initiating long trades when price outperforms some historic average, and initiating short trades when the price underperforms some historic average.
The Updata code for this system is in the Updata Library and may be downloaded by clicking the Custom menu and System Library. Those who cannot access the library due to a firewall may paste the code shown below into the Updata Custom editor and save it. See Figure 16.
PARAMETER "Moving Average Period" #Period=8
NAME "Moving Average [" #Period "]" ""
DISPLAYSTYLE 2LINES
INDICATORTYPE TOOL
INDICATORTYPE2 TOOL
PLOTSTYLE2 LINE RGB(0,0,200)
@MovAvg=0
FOR #CURDATE=#Period TO #LASTDATE
   'Moving Average
   @MovAvg=MAVE(#Period)
   'Entry & Exit conditions upon average crossing
   If Hist(HasX(Close,@MovAvg,UP),1)
      Cover Open
      Buy Open
      'Annotate chart with text & green dot for longs
      DRAWIMAGE AT,#CURDATE,@MovAvg,Dot 8,RGB(0,200,0)
      COLOUR RGB(0,200,0)
      DRAWTEXT Low BELOW "LONG"
   ElseIf Hist(HasX(Close,@MovAvg,DOWN),1)
      Sell Open
      Short Open
      'Annotate chart with text & red dot for shorts
      DRAWIMAGE AT,#CURDATE,@MovAvg,Dot 8,RGB(200,0,0)
       COLOUR RGB(200,0,0)
       DRAWTEXT High ABOVE "SHORT"
   EndIf
   @PLOT2=@MovAvg
NEXT
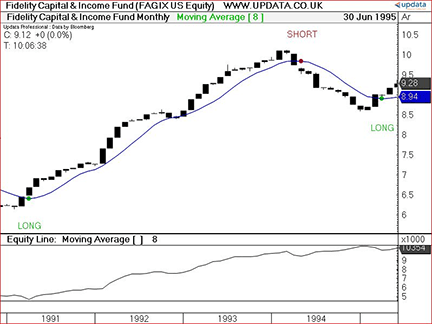
FIGURE 16: UPDATA, EIGHT-BAR SIMPLE MOVING AVERAGE. This chart shows the monthly FAGIX Bond ETF. The lower pane shows the system’s resultant equity curve when an eight-period average is used.
—Updata support team
support@updata.co.uk
www.updata.co.uk
BACK TO LIST
TRADING BLOX: EIGHT-BAR SIMPLE MOVING AVERAGE
In “Trading High-Yield Bonds Using ETFs” in this issue, author Brooke Gardner presents a simple timing method using an eight-month simple moving average (SMA) to exit long positions in the popular mutual fund Fidelity High Income Fund (FAGIX).
The concept behind the strategy is to compare the monthly closing price to the moving average and to buy & hold until the price stays above the SMA. When the price breaks below the SMA, exit the position.
This trading strategy can be simply implemented in Trading Blox:
- Create a new Blox (Entry, Exit, Money Manager)
- In it, define the Parameters: movingAveragePeriod, (number of months to be used to calculate the SMA)
- Define the Indicator: movingAverage (standard Trading Blox indicator calculation) and point it to use the movingAveragePeriod parameter.
- Define the Entry logic in the “Entry Orders” script of the block:
'-------------------------------------------------------------------
'Trader's Tips June 2012
'Trading High-Yield Bonds Using ETFs by Brooke Gardner
'Code by Jez Liberty - Au.Tra.Sy
' jez@automated-trading-system.com
' https://www.automated-trading-system.com/

' If we are not long and the price is above the moving average.
IF instrument.position <> LONG AND
   instrument.close > movingAverage THEN

   ' Enter a long on the open
   broker.EnterLongOnOpen
ENDIF

'---------------------------------------------------------------------
- Define the Exit logic in the “Exit Orders” script of the block:
'-------------------------------------------------------------------
'Trader's Tips June 2012
'Trading High-Yield Bonds Using ETFs by Brooke Gardner
'Code by Jez Liberty - Au.Tra.Sy
' jez@automated-trading-system.com
' https://www.automated-trading-system.com/

'Close LONG position if close is below MA
IF instrument.close < movingAverage THEN
   broker.ExitAllUnitsOnOpen
ENDIF


'---------------------------------------------------------------------
- Define the Position Sizing in the “Unit Size” script of the block:
'-------------------------------------------------------------------
'Trader's Tips June 2012
'Trading High-Yield Bonds Using ETFs by Brooke Gardner
'Code by Jez Liberty - Au.Tra.Sy
' jez@automated-trading-system.com
' https://www.automated-trading-system.com/

VARIABLES: orderSize TYPE: FLOATING
orderSize = system.tradingEquity / instrument.unAdjustedClose
order.setQuantity( orderSize )

'---------------------------------------------------------------------
The code to implement this simple trading strategy in Trading Blox can be downloaded from https://www.automated-trading-system.com/free-code/.
Here is a set of results from a Trading Blox simulation (Figure 17) run using the code and historical data for FAGIX (adjusted for splits and dividends) from data provider CSI (https://csidata2.com/cgi-bin/ua_order_form.pl?referrer=AT).
Period tested: 01/01/2003 - 12/31/2011
CAGR: 12.06%
Max DD: 10.1%
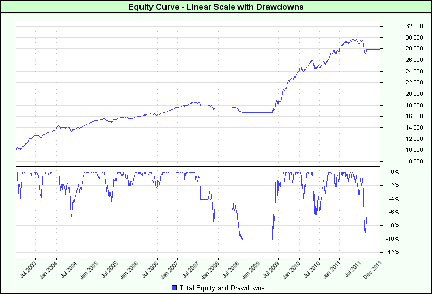
FIGURE 17: TRADING BLOX, EIGHT-BAR SIMPLE MOVING AVERAGE SYSTEM ON RECENT DATA. This graph shows the system’s equity curve and drawdowns for the period 2003–11.
It’s interesting to see how this system would have performed in a different market environment. Next is an additional set of results from earlier periods for FAGIX:
Period tested: 01/01/1990 - 12/31/2002
CAGR: 5.97%
Max DD: 22.2%
As you can see, the results are not quite as good as in recent times. See Figure 18.
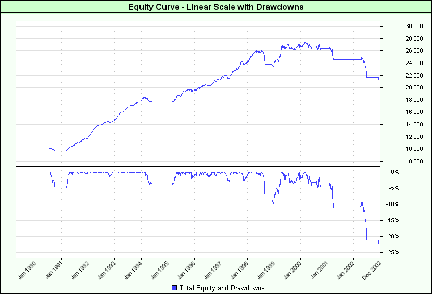
FIGURE 18: TRADING BLOX, EIGHT-BAR SIMPLE MOVING AVERAGE SYSTEM OVER A DIFFERENT PERIOD. This shows the system equity curve and drawdowns for an earlier period, 1990–2002.
Finally, Trading Blox allows us to test the impact of the length of the moving average to check the robustness of the strategy to parameter values. Testing over the whole set of historical data, we vary the SMA length parameter from two months to 24 months. Figure 19 shows a summary result of this stepped test, showing the evolution of the MAR ratio (CAGR/MaxDD) as a function of the SMA length.
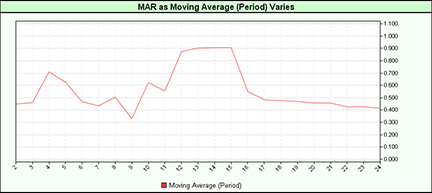
FIGURE 19: TRADING BLOX, VARIED-BAR SIMPLE MOVING AVERAGE. This shows the evolution of MAR ration as a function of SMA length (1990–2011).
—Jez Liberty, Au.Tra.Sy
for Trading Blox
jez@automated-trading-system.com
www.automated-trading-system.com
BACK TO LIST
MICROSOFT EXCEL: EIGHT-BAR SIMPLE MOVING AVERAGE
The article in this issue by Brooke Gardner, “Trading High-Yield Bonds Using ETFs,” demonstrates a simple, straightforward, trend-following approach. By varying the simple moving average (SMA) period, we can see the relative effects on the buy and sell signals. See Figure 20.
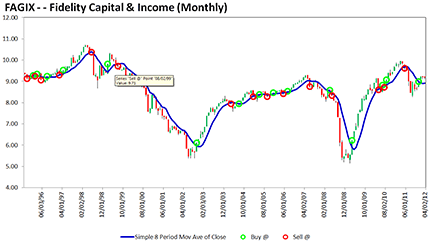
FIGURE 20: EXCEL, EIGHT-BAR SIMPLE MOVING AVERAGE. Here is a sample chart of FAGIX (monthly) with an eight-period simple moving average and buy/sell indications.
I have prepared an Excel macro to assist you when you update the InputData tab from a downloaded history file (or change to an entirely new symbol). See the Notes tab of the spreadsheet for details. The spreadsheet is downloadable by clicking here.
—Ron McAllister
rpmac_xltt@sprynet.com
BACK TO LIST
Originally published in the June 2012 issue of
Technical Analysis of Stocks & Commodities magazine.
All rights reserved. © Copyright 2012, Technical Analysis, Inc.
Return to
Contents


