TRADERS’ TIPS
Here is this month’s selection of Traders’ Tips, contributed by
various developers of technical analysis software to help readers more easily
implement some of the strategies presented in this and other issues.
Other code appearing in articles in this issue is posted in the Subscriber
Area of our website at https://technical.traders.com/sub/sublogin.asp.
Login requires your last name and subscription number (from mailing label).
Once logged in, scroll down to beneath the “Optimized trading systems” area
until you see “Code from articles.” From there, code can be copied
and pasted into the appropriate technical analysis program so that no retyping
of code is required for subscribers.
You can copy these formulas and programs for easy use in your spreadsheet
or analysis software. Simply “select” the desired text
by highlighting as you would in any word processing program, then use your
standard key command for copy or choose “copy” from the browser
menu. The copied text can then be “pasted” into any open spreadsheet
or other software by selecting an insertion point and executing a paste command.
By toggling back and forth between an application window and the open web
page, data can be transferred with ease.
For this month’s Traders’ Tips, the focus is Sylvain Vervoort’s article in this issue, “Long-Term Trading Using Exchange Traded Funds.”
Code for MetaStock is already provided in Vervoort’s article. Subscribers will find that code at the Subscriber Area of our website, www.traders.com. (Click on “Article Code” from our homepage.) Presented here is an overview of possible implementations for other software.

TRADESTATION: HEIKIN-ASHI CANDLES OSCILLATOR LONG TERM (HACOLT)
In “Long-Term Trading Using Exchange Traded Funds” in this issue, author Sylvain Vervoort describes the use of his heikin-ashi candles oscillator (HACO) with modifications for longer-term trading (HACOLT). The indicator plots a 100 value for a long position, 50 for a long exit, and zero for short entry.
We have prepared some EasyLanguage indicator code and example strategy code. See Vervoort’s article for his description of entry and exit conditions for possible entries and exits.
To download the EasyLanguage code for the indicators, first navigate to the EasyLanguage FAQs and Reference Posts Topic in the EasyLanguage support forum (https://www.tradestation.com/Discussions/Topic.aspx?Topic_ID=47452), scroll down, and click on the link labeled “Traders’ Tips, TASC.” Then select the appropriate link for the issue month and year. The ELD filename is “_HACOLT.ELD.”
The code is also shown below.
_HACOLT_Ind ( Indicator )

{ TASC Article, July 2012 }
{ Long-Term Trading Using Exchange Traded Funds }
{ HACOLT by Sylvain Vervoort }

inputs:
	avg( 55 ),
	CandleSize( 1.1 ),
	LTAverage( 60 ) ;

variables:
	haOpen( 0 ),
	haC( 0 ),
	ZlHa( 0 ),
	ZlCl( 0 ),
	keep1( false ),
	keep2( false ),
	keeping( false ),
	keepall( false ),
	keep3( false ),
	utr( false ),
	dtr( false ),
	upw( false ),
	dnw( false ),
	Result( false ),
	LTSell( false ),
	LTResult( false ),
	PlotValue( 0 ) ;

if CurrentBar > 1 then
	haOpen = ( AvgPrice[1] + haOpen[1] ) * 0.5
else
	haOpen = Open ;

haC = ( AvgPrice + haOpen + MaxList( High, haOpen )
	+ MinList( Low, haOpen ) ) * 0.25 ;

ZlHa = _Tema( haC, avg ) + ( _Tema( haC, avg ) -
	( _Tema( _Tema( haC, avg ), avg ) ) ) ;

ZlCl = _Tema( MedianPrice, avg ) +
	( _Tema( MedianPrice, avg ) -
	( _Tema( _Tema( MedianPrice, avg ), avg ))) ;

keep1 = ( haC >= haOpen or haC[1] >= haOpen[1] ) or
	IffLogic( Close >= haC, true,
	IffLogic( High > High[1] or Low > Low[1],
	 true, false ) )  ;

keep2 = ( ZlCl - ZlHa ) >= 0 ;
keeping = keep1 or keep2 ;
keepall = keeping or ( keeping[1] and Close >= Open or
	Close >= Close[1] ) ;
keep3 = ( AbsValue( Close-Open ) < Range * CandleSize
	and H >= L[1] ) ;
utr = keepall or ( keepall[1] and keep3 ) ;

keep1 = haC < haOpen or haC[1] < haOpen[1] ;
keep2 = ( ZlCl - ZlHa ) < 0 ;
keep3 = AbsValue( Close - Open ) < Range * CandleSize
	and Low <= High[1] ;
keeping = keep1 or keep2 ;
keepall = keeping or ( keeping[1] and Close < Open or
	Close < Close[1] ) ;
dtr = IffLogic( keepall or ( keepall[1] and keep3 ),
	true, false ) ;

upw = dtr = false and dtr[1] and utr ;
dnw = utr = false and utr[1] and dtr ;

Value1 = MRO( upw or dnw, 50, 1 ) ;

Result = IffLogic( upw , true, IffLogic( dnw, false,
	IffLogic( Value1 >= 0 and
	upw[Value1], true, false ) ) ) ;

LTSell = C < XAverage( Close, LTAverage ) ;

LTResult = IffLogic( Result, true,
	IffLogic( Result = false and LTSell,
	false, LTResult[1] ) ) ;

if Result = true then
	PlotValue = 100
else if Result = false and LTResult = true then
	PlotValue = 50
else if Result = false and LTResult = false then
	PlotValue = 0 ;

Plot1( PlotValue, "HACOLT" ) ;

{ Alerts }
if AlertEnabled then
	begin
	if PlotValue = 100 then
		begin
		if PlotValue[1] = 50 then
			Alert( "HACOLT:  Long Entry Signal" ) ;
		if PlotValue[1] = 0 then
			Alert( "HACOLT:  Short Exit and Long " +
			 "Entry Signal" ) ;
		end ;

	if PlotValue = 50 and PlotValue[1] = 100 then
		Alert( "HACOLT:  Long Exit Signal" ) ;

	if PlotValue = 0 then
		begin
		if PlotValue[1] = 100 then
	 		Alert( "HACOLT:  Long Exit and " +
	 		 "SellShort Entry Signal" ) ;
	 	if PlotValue[1] = 50 then
	 		Alert( "HACOLT:  SellShort Entry " +
	 		 "Signal" ) ;
		end ;
	end ;


_HACOLT_Strat ( Strategy )

{ TASC Article, July 2012 }
{ Long-Term Trading Using Exchange Traded Funds }
{ HACOLT by Sylvain Vervoort }

inputs:
	avg( 55 ),
	CandleSize( 1.1 ),
	LTAverage( 60 ) ;

variables:
	haOpen( 0 ),
	haC( 0 ),
	ZlHa( 0 ),
	ZlCl( 0 ),
	keep1( false ),
	keep2( false ),
	keeping( false ),
	keepall( false ),
	keep3( false ),
	utr( false ),
	dtr( false ),
	upw( false ),
	dnw( false ),
	Result( false ),
	LTSell( false ),
	LTResult( false ),
	PlotValue( 0 ) ;

if CurrentBar > 1 then
	haOpen = ( AvgPrice[1] + haOpen[1] ) * 0.5
else
	haOpen = Open ;

haC = ( AvgPrice + haOpen + MaxList( High, haOpen )
	+ MinList( Low, haOpen ) ) * 0.25 ;

ZlHa = _Tema( haC, avg ) + ( _Tema( haC, avg ) -
	( _Tema( _Tema( haC, avg ), avg ) ) ) ;

ZlCl = _Tema( MedianPrice, avg ) +
	( _Tema( MedianPrice, avg ) -
	( _Tema( _Tema( MedianPrice, avg ), avg ))) ;

keep1 = ( haC >= haOpen or haC[1] >= haOpen[1] ) or
	IffLogic( Close >= haC, true,
	IffLogic( High > High[1] or Low > Low[1],
	 true, false ) )  ;

keep2 = ( ZlCl - ZlHa ) >= 0 ;
keeping = keep1 or keep2 ;
keepall = keeping or ( keeping[1] and Close >= Open or
	Close >= Close[1] ) ;
keep3 = ( AbsValue( Close-Open ) < Range * CandleSize
	and H >= L[1] ) ;
utr = keepall or ( keepall[1] and keep3 ) ;

keep1 = haC < haOpen or haC[1] < haOpen[1] ;
keep2 = ( ZlCl - ZlHa ) < 0 ;
keep3 = AbsValue( Close - Open ) < Range * CandleSize
	and Low <= High[1] ;
keeping = keep1 or keep2 ;
keepall = keeping or ( keeping[1] and Close < Open or
	Close < Close[1] ) ;
dtr = IffLogic( keepall or ( keepall[1] and keep3 ),
	true, false ) ;

upw = dtr = false and dtr[1] and utr ;
dnw = utr = false and utr[1] and dtr ;

Value1 = MRO( upw or dnw, 50, 1 ) ;

Result = IffLogic( upw , true, IffLogic( dnw, false,
	IffLogic( Value1 >= 0 and
	upw[Value1], true, false ) ) ) ;

LTSell = C < XAverage( Close, LTAverage ) ;

LTResult = IffLogic( Result, true,
	IffLogic( Result = false and LTSell,
	false, LTResult[1] ) ) ;

if Result = true then
	PlotValue = 100
else if Result = false and LTResult = true then
	PlotValue = 50
else if Result = false and LTResult = false then
	PlotValue = 0 ;

{ Entry }
if PlotValue = 100 and PlotValue <> PlotValue[1] then
	Buy ( "HACOLT LE" ) next bar market ;

if PlotValue = 0 and PlotValue <> PlotValue[1] then
	SellShort ( "HACOLT SE" ) next bar market ;

{ Long Exit }
if PlotValue < 100 then
	Sell ( "HACOLT LX" ) next bar market ;
A sample chart is shown in Figure 1.
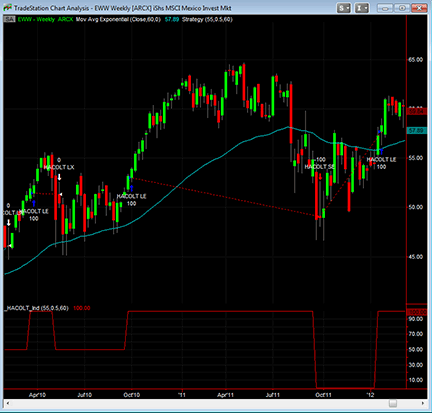
FIGURE 1: TRADESTATION, HEIKIN-ASHI CANDLES OSCILLATOR LONG TERM (HACOLT). Here is a weekly bar chart of EWW with the indicator (red plot) and strategy applied with a CandleSize of 0.5 for both the indicator and strategy. The cyan plot is the built-in “Mov Avg Exponential” (exponential moving average) indicator set to the close and 60 bars for a 60-bar EMA of the closing prices.
This article is for informational purposes. No type of trading or investment recommendation, advice, or strategy is being made, given, or in any manner provided by TradeStation Securities or its affiliates.
—Chris Imhof
TradeStation Securities, Inc.
A subsidiary of TradeStation Group, Inc.
www.TradeStation.com
BACK TO LIST

THINKORSWIM: HEIKIN-ASHI CANDLES OSCILLATOR LONG TERM (HACOLT)
In his article in this issue, “Long-Term Trading Using Exchange Traded Funds,” author Sylvain Vervoort introduces his heikin-ashi candles oscillator long term (HACOLT).
This system is intended to be implemented on exchange traded funds. Because this security type is generally broad-based in its price drivers, Vervoort recommends a weekly charting approach for the most consistency in this type of application.
We have recreated this study in our proprietary scripting language, thinkScript, for your use. The display output is very straightforward, with a 100 max signal for a positive period, a 50 signal for a neutral period, and a zero for a negative period (Figure 2).
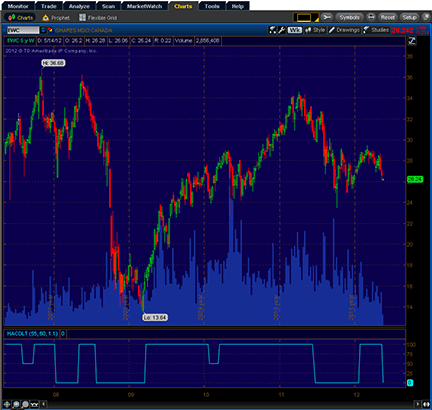
FIGURE 2: THINKORSWIM, HEIKIN-ASHI CANDLES OSCILLATOR LONG TERM (HACOLT). In the display, a 100 max signal indicates a positive period, a 50 signals a neutral period, and a zero shows a negative period.
The code for the custom study is shown here along with instructions for applying it to a thinkorswim chart.
- From TOS charts, select “Studies” → “Edit Studies”
- Select the “Studies” tab in the upper left-hand corner
- Select “New” in the lower left-hand corner
- Name the strategy (such as “HACOLT”)
- Click in the script editor window, remove “plot Data = close;” and paste in the following:
declare lower;
input length = 55;
input emaLength = 60;
input candleSizeFactor = 1.1;

rec HAopen = compoundValue(1, (HAopen[1] + ohlc4) / 2, ohlc4);
def HAclose = (HAopen + Max(high, HAopen) + Min(low, HAopen) + ohlc4) / 4;

def TEMAHAclose = TEMA(HAclose, length);
def TEMAhl2 = TEMA(hl2, length);
def HAcloseSmooth = 2 * TEMAHAclose - TEMA(TEMAHAclose, length);
def hl2Smooth = 2 * TEMAhl2 - TEMA(TEMAhl2, length);
def shortCandle = AbsValue(close - open) < (high - low) * candleSizeFactor;

def keepn1 = (HAclose >= HAopen and HAclose[1] >= HAopen[1]) or close >= HAclose or high > high[1] or low > low[1] or hl2Smooth >= HAcloseSmooth;
def keepall1 = keepn1 or (keepn1[1] and close >= open or close >= close[1]);
def keep13 = shortCandle and high >= low[1];
def utr = keepall1 or (keepall1[1] and keep13);
def keepn2 = HAclose < HAopen and HAclose[1] < HAopen[1] or hl2Smooth < HAcloseSmooth;
def keep23 = shortCandle and low <= high[1];
def keepall2 = keepn2 or (keepn2[1] and close < open or close < close[1]);

def dtr = keepall2 or (keepall2[1] and keep23);
def upw = dtr == 0 and dtr[1] and utr;
def dnw = utr == 0 and utr[1] and dtr;
rec upwWithOffset = if upw != dnw then upw else upwWithOffset[1];

def Buy = upw or (!dnw and (if IsNaN(upwWithOffset) then 0 else upwWithOffset));
def LongTermSell = close < ExpAverage(close, emaLength);
rec Neutral = Buy or (if LongTermSell then 0 else Neutral[1]);
plot HACOLT = if Buy then 100 else if Neutral then 50 else 0;
- Select OK and you are good to go! Your study will appear in the list of available studies on the “Edit studies and strategies” menu. To add it to your chart, simply doubleclick on its entry on the list.
—thinkorswim
A division of TD Ameritrade, Inc.
www.thinkorswim.com
BACK TO LIST

eSIGNAL: HEIKIN-ASHI CANDLES OSCILLATOR LONG TERM (HACOLT)
For this month’s Traders’ Tip, we’ve provided a formula named “HACOLT.efs” based on Sylvain Vervoort’s article in this issue, “Long-Term Trading Using Exchange Traded Funds.”
The HACOLT study contains formula parameters to set the TEMA, shorting LT average, and candle size factor, which may be configured through the Edit Chart window.
To discuss this study or download a complete copy of the formula code, please visit the EFS library discussion board forum under the forums link from the support menu at www.esignal.com or visit our EFS KnowledgeBase at www.esignal.com/support/kb/efs/. The eSignal formula script (EFS) is also available for copying & pasting below, and can be downloaded here.
/*********************************
Provided By:
    Interactive Data Corporation (Copyright © 2012)
    All rights reserved. This sample eSignal Formula Script (EFS)
    is for educational purposes only. Interactive Data Corporation
    reserves the right to modify and overwrite this EFS file with
    each new release.

Description:
    Long-Term Trading Using Exchange Traded Funds by Sylvain Vervoort

Version:            1.0  14/05/2012

Formula Parameters:                     Default:
    TEMA Average                        55
    Shorting LT Average                 60
    Candle Size Factor                  1.1

Notes:
    The related article is copyrighted material. If you are not
    a subscriber of Stocks & Commodities, please visit www.traders.com.

**********************************/

var fpArray = new Array();

function preMain() {

    setPriceStudy(false);
    setStudyTitle("Heikin-Ashi Candelstick Oscillator Long-Term");

    var x = 0;

    fpArray[x] = new FunctionParameter("g_nAvgPeriod", FunctionParameter.NUMBER);
	with(fpArray[x++])
    {
        setName("TEMA Average");
        setLowerLimit(1);
        setUpperLimit(100);
        setDefault(55);
    }

    fpArray[x] = new FunctionParameter("g_nLTAvgPeriod", FunctionParameter.NUMBER);
    with(fpArray[x++])
    {
        setName("Shorting LT Average");
        setLowerLimit(1);
        setUpperLimit(200);
        setDefault(60);
    }

    fpArray[x] = new FunctionParameter("g_nCandleSize", FunctionParameter.NUMBER);
	with(fpArray[x++])
    {
        setName("Candle Size Factor");
        setLowerLimit(0.01);
        setUpperLimit(5);
        setDefault(1.1);
    }
}

var xhaOpen = null;
var xhaC = null;

var xTEMA1_haC = null;
var xTEMA2_haC = null;

var xTEMA1_hl2 = null;
var xTEMA2_hl2 = null;

var xEMA_LT = null;

var bKeeping = false;
var bKeepall = false;
var bKeeping_ref = false;
var bKeepall_ref = false;

var bKeeping_2 = false;
var bKeepall_2 = false;
var bKeeping_2_ref = false;
var bKeepall_2_ref = false;

var bDtr = false;
var bUtr = false;
var bDtr_ref = false;
var bUtr_ref = false;

var nValueWhen = 0;

var nLTRes = 0;
var nLTRes_ref = 0;

var nResult = 0;
var nResult_ref = 0;

var bInit = false;
var bVersion = null;

function main(g_nAvgPeriod, g_nLTAvgPeriod, g_nCandleSize)
{
    if (bVersion == null) bVersion = verify();
    if (bVersion == false) return;

    var nState = getBarState();

    if (!bInit)
    {
        xhaOpen = efsInternal("Calc_haOpen", ohlc4());
        xhaC = efsInternal("Calc_haC", ohlc4(), xhaOpen);

        xTEMA1_haC = efsInternal("TEMA", g_nAvgPeriod, xhaC);
        xTEMA2_haC = efsInternal("TEMA", g_nAvgPeriod, xTEMA1_haC);

        xTEMA1_hl2 = efsInternal("TEMA", g_nAvgPeriod, hl2());
        xTEMA2_hl2 = efsInternal("TEMA", g_nAvgPeriod, xTEMA1_hl2);

        xEMA_LT = ema(g_nLTAvgPeriod, close());

        bInit = true;
    }

    if (nState == BARSTATE_NEWBAR)
    {
        bKeeping_ref = bKeeping;
        bKeepall_ref = bKeepall;

        bKeeping_2_ref = bKeeping_2;
        bKeepall_2_ref = bKeepall_2;

        bDtr_ref = bDtr;
        bUtr_ref = bUtr;

        nLTRes_ref = nLTRes;
        nResult_ref = nResult
    }
    else if (nState == BARSTATE_ALLBARS)
    {
        bKeeping_ref = bKeeping = false;
        bKeepall_ref = bKeepall = false;

        bKeeping_2_ref = bKeeping_2 = false;
        bKeepall_2_ref = bKeepall_2 = false;

        bDtr_ref = bDtr = false;
        bUtr_ref = bUtr = false;

        nValueWhen = 0;
        nLTRes_ref = nLTRes = 0;
        nResult_ref = nResult = 0;
    }

    var nhaOpen = xhaOpen.getValue(0);
    var nhaC = xhaC.getValue(0);

    var nTEMA1_haC = xTEMA1_haC.getValue(0);
    var nTEMA2_haC = xTEMA2_haC.getValue(0);

    var nTEMA1_hl2 = xTEMA1_hl2.getValue(0);
    var nTEMA2_hl2 = xTEMA2_hl2.getValue(0);

    var nEMA_LT = xEMA_LT.getValue(0);

    if (nTEMA2_haC == null || nTEMA2_hl2 == null || nEMA_LT == null)
        return;

    var nZIHa = nTEMA1_haC + (nTEMA1_haC - nTEMA2_haC);
    var nZICl = nTEMA1_hl2 + (nTEMA1_hl2 - nTEMA2_hl2);

    // bKeep1 section

    var fExpression1 = function(i)
    {
        if (xhaC.getValue(-i) == null || xhaOpen.getValue(-i) == null)
            return false;

        return xhaC.getValue(-i) >= xhaOpen.getValue(-i);
    }

    var bExp1 = Alert(fExpression1, 2);
    var bExp2 = close(0) >= nhaC;
    var bExp3 = high(0) > high(-1);
    var bExp4 = low(0) > low(-1);

    var bKeep1 = bExp1 || bExp2 || bExp3 || bExp4;

    // end of bKeep1 section

    var bKeep2 = (nZICl - nZIHa) >= 0;
    var bKeep3 = (Math.abs(close(0) - open(0)) < (high(0) - low(0)) * g_nCandleSize) && (high(0) >= low(-1));

    bKeeping = bKeep1 || bKeep2;
    bKeepall = bKeeping || (bKeeping_ref && (close(0) >= 0) || (close(0) >= close(-1)));

    bUtr = bKeepall || (bKeepall_ref && bKeep3);

    // bKeep1_2 section

    var fExpression2 = function(i)
    {
        if (xhaC.getValue(-i) == null || xhaOpen.getValue(-i) == null)
            return false;

        return xhaC.getValue(-i) < xhaOpen.getValue(-i);
    }

    var bKeep1_2 = Alert(fExpression2, 2);

    // end of bKeep1_2 section

    var bKeep2_2 = (nZICl - nZIHa) < 0;
    var bKeep3_2 = (Math.abs(close(0) - open(0)) < (high(0) - low(0)) * g_nCandleSize) && (low(0) <= high(-1));

    bKeeping_2 = bKeep1_2 || bKeep2_2;
    bKeepall_2 = bKeeping_2 || (bKeeping_2_ref && (close(0) < open(0)) || (close(0) < close(-1)));

    bDtr = bKeepall_2 || (bKeepall_2_ref && bKeep3_2);

    bUpw = (!bDtr && bDtr_ref && bUtr);
    bDnw = (!bUtr && bUtr_ref && bDtr);

    nRes = bUpw ? 1 : (bDnw ? 0 : nValueWhen);

    if (bUpw || bDnw)
    {
        if (bUpw)
            nValueWhen = 1;
        else
            nValueWhen = 0;
    }

    var bLTSell = (close(0) < nEMA_LT);

    nLTRes = (nRes == 1) ? 1 : (bLTSell ? 0 : nLTRes_ref);

    nResult = (nRes == 1) ? 100 : ((nLTRes == 1) ? 50 : 0);

    BackTesting();

    return nResult;
}

function BackTesting()
{
    // Back Testing formulas are not for real time analysis.
    // Therefore, prevent processing and exit at bar 0.
    if (getCurrentBarIndex() == 0) return;

    // Exit Strategy
    if (Strategy.isInTrade())
    {
        // Exit Long
        if (Strategy.isLong() && (nResult_ref == 100) && (nResult < 100))
        {
            Strategy.doSell("Long Exit Signal", Strategy.CLOSE, Strategy.THISBAR);
        }
        // Exit Short
        else if (Strategy.isShort() && (nResult_ref < 100) && (nResult == 100))
        {
            Strategy.doCover("Short Exit Signal", Strategy.CLOSE, Strategy.THISBAR);
        }
    }

    // Entry Strategy
    if (!Strategy.isInTrade())
    {
        // Enter Long
        if ((nResult_ref < 100) && (nResult == 100))
        {
            Strategy.doLong("Long signal", Strategy.CLOSE, Strategy.THISBAR);
        }
        // Enter Short
        else if ((nResult_ref > 0) && (nResult == 0))
        {
            Strategy.doShort("Short signal", Strategy.CLOSE, Strategy.THISBAR);
        }
    }
}

function Calc_haOpen(xOHLC4)
{
    var nRef = ref(-1);
    var nOHLC1 = xOHLC4.getValue(-1);

    if (nOHLC1 == null)
        return;

    if (nRef == null)
        nRef = nOHLC1;

    return (nOHLC1 + nRef) / 2;
}

function Calc_haC(xOHLC4, xhaOpen)
{
    var nOHLC = xOHLC4.getValue(0);
    var nhaOpen = xhaOpen.getValue(0);

    if (nhaOpen == null)
        return;

    return (nOHLC + nhaOpen + Math.max(high(0), nhaOpen) + Math.min(low(0), nhaOpen)) / 4;
}

// MetaStock Alert function
function Alert(fExpression, nPeriod)
{
    for (var i = 0; i < nPeriod; i++)
        if(fExpression(i)) return true;

    return false;
}


var bInitTEMA = false;
var xEma1 = null;
var xEma2 = null;
var xEma3 = null;

// Triple Exponential Moving Average
function TEMA(period, series)
{
    if(!bInitTEMA)
    {
        xEma1 = ema(period, series);
        xEma2 = ema(period, xEma1);
        xEma3 = ema(period, xEma2);

        bInitTEMA = true;
    }

    var vEma1 = xEma1.getValue(0);
    var vEma2 = xEma2.getValue(0);
    var vEma3 = xEma3.getValue(0);

    if (vEma3 == null)
        return null;

    return 3 * vEma1 - 3 * vEma2 + vEma3;
}

// verify version
function verify() {
    var b = false;
    if (getBuildNumber() < 779) {
        drawTextAbsolute(5, 35, "This study requires version 8.0 or later.",
            Color.white, Color.blue, Text.RELATIVETOBOTTOM|Text.RELATIVETOLEFT|Text.BOLD|Text.LEFT,
            null, 13, "error");
        drawTextAbsolute(5, 20, "Click HERE to upgrade.@URL=https://www.esignal.com/download/default.asp",
            Color.white, Color.blue, Text.RELATIVETOBOTTOM|Text.RELATIVETOLEFT|Text.BOLD|Text.LEFT,
            null, 13, "upgrade");
        return b;
    } else {
        b = true;
    }
    return b;
}
A sample chart is shown in Figure 3.
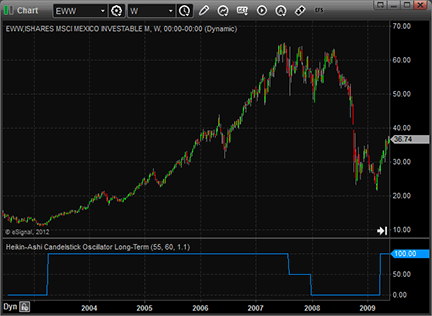
FIGURE 3: eSIGNAL, HEIKIN-ASHI CANDLES OSCILLATOR LONG TERM (HACOLT). The HACOLT study contains formula parameters to set the TEMA, shorting LT average, and candle size factor.
—Jason Keck
eSignal, an Interactive Data company
800 779-6555, www.eSignal.com
BACK TO LIST

WEALTH-LAB: HEIKIN-ASHI CANDLES OSCILLATOR LONG TERM (HACOLT)
In “Long-Term Trading Using Exchange Traded Funds” in this issue, author Sylvain Vervoort describes the evolution of his HACO indicator into a long-term version named HACOLT. He also presents an application of it to a portfolio of ETFs.
Based on Vervoort’s rules, the Wealth-Lab strategy shown here contains configurable parameters to set the two periods (TEMA and shorting LT average) and the candle size factor.
Wealth-Lab users who want to test the new HACOLT indicator on any market (including but not limited to ETFs) can download this sample strategy directly into Wealth-Lab. From the Open Strategy dialog (Ctrl-O), choose “Download” to get all strategies that have been uploaded recently. The strategy is also available for copying & pasting below.
C# Code:

using System;
using System.Collections.Generic;
using System.Text;
using System.Drawing;
using WealthLab;
using WealthLab.Indicators;
using TASCIndicators;

namespace WealthLab.Strategies
{
	public class HACOLTStrategy : WealthScript
	{
		private StrategyParameter period;
		private StrategyParameter candlesize;
		private StrategyParameter ltaverage;

		public HACOLTStrategy()
		{
			period = CreateParameter("TEMA Period",55,2,100,10);
			candlesize = CreateParameter("Candle Size",1.1,0.01,5,0.5);
			ltaverage = CreateParameter("Shorting LT Average",60,1,200,20);
		}

		protected override void Execute()
		{
			HACOLT hacolt = HACOLT.Series(Bars, period.ValueInt, candlesize.Value, 2, ltaverage.ValueInt);
			ChartPane paneHACOLT = CreatePane(30,true,true);
			PlotSeries(paneHACOLT, hacolt, Color.FromArgb(255,138,43,226), LineStyle.Solid, 2);
			HideVolume();

			for(int bar = hacolt.FirstValidValue; bar < Bars.Count; bar++)
			{
				bool buyLong = hacolt[bar] == 100;
				bool closeLong = hacolt[bar] == 0 || CrossUnder(bar, hacolt, 50);
				bool goShort = hacolt[bar] == 0;
				bool coverShort = hacolt[bar] == 100;

				// The first trade
				if (Positions.Count == 0){
					if ( buyLong )
						BuyAtMarket( bar + 1 );
					else if( goShort )
						ShortAtMarket( bar + 1 );
				}
					// Subsequent trades
				else
				{
					Position p = LastPosition;
					if ( p.PositionType == PositionType.Long )
					{
						if ( closeLong )
						{
							SellAtMarket( bar + 1, p );
							if( goShort )
								if( ShortAtMarket( bar+1 ) != null )
									LastPosition.Priority = Close[bar];
						}
					}
					else if ( coverShort )
					{
						CoverAtMarket( bar + 1, p );
						if( buyLong )
							if( BuyAtMarket( bar+1 ) != null )
								LastPosition.Priority = -Close[bar];
					}
				}
			}
		}
	}
}
A sample chart is shown in Figure 4.
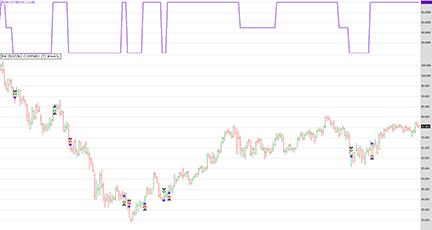
FIGURE 4: WEALTH-LAB, HEIKIN-ASHI CANDLES OSCILLATOR LONG TERM (HACOLT). Here is an example of applying Sylvain Vervoort’s HACOLT strategy to BA (Boeing) shares in Wealth-Lab 6.3.
—Eugene
www.wealth-lab.com
BACK TO LIST

NEUROSHELL TRADER: HEIKIN-ASHI CANDLES OSCILLATOR LONG TERM (HACOLT)
The HACOLT indicator presented by Sylvain Vervoort in his article in this issue, “Long-Term Trading Using Exchange Traded Funds,” can be easily implemented in NeuroShell Trader using NeuroShell Trader’s ability to call external programs. The programs can be written in C, C++, Power Basic, or Delphi.
After moving the MetaStock code given in Vervoort’s article to your preferred compiler and creating a dynamic linked library (DLL), you can insert the resulting HACOLT indicator into NeuroShell as follows:
- Select “New indicator” from the Insert menu.
- Choose the “External program & library calls” category.
- Select the appropriate external DLL call indicator.
- Setup the parameters to match your DLL.
- Select the “finished” button.
To recreate Vervoort’s HACOLT trading system, select “New trading strategy” from the Insert menu and enter the following in the appropriate locations of the Trading Strategy Wizard:
- Generate a buy long market order if all of the following are true:
A=B( HACOLT(Open, High, Low, Close, 55, 1.1, 60), 100 )
- Generate a sell long market order if all of the following are true:
A<B( HACOLT(Open, High, Low, Close, 55, 1.1, 60), 100 )
- Generate a sell short market order if all of the following are true:
A=B( HACOLT(Open, High, Low, Close, 55, 1.1, 60), 0 )
- Generate a cover short market order if all of the following are true:
A>B( HACOLT(Open, High, Low, Close, 55, 1.1, 60), 0 )
With NeuroShell Trader’s optimization capabilities, you can also choose whether the rule parameters should be changed. After backtesting the trading strategy, use the “Detailed analysis” button to view the backtest and trade-by-trade statistics for the strategy.
To scan a large number of ticker symbols for potential HACOLT signals, select “Scan ticker symbols” from the File menu and enter the following scan values:
- Open long signal:
CrossAbove(HACOLT(Open, High, Low, Close, 55, 1.1, 60), 75 )
- Close long signal:
CrossBelow(HACOLT(Open, High, Low, Close, 55, 1.1, 60), 75 )
- Open short signal:
CrossBelow(HACOLT(Open, High, Low, Close, 55, 1.1, 60), 25 )
- Close short signal:
CrossAbove(HACOLT(Open, High, Low, Close, 55, 1.1, 60), 25 )
Once the scan is finished, it can be saved for future use by pressing the “Save as template” button.
Users of NeuroShell Trader can go to the Stocks & Commodities section of the NeuroShell Trader free technical support website to download a copy of this or any past Traders’ Tips.
A sample chart is shown in Figure 5.
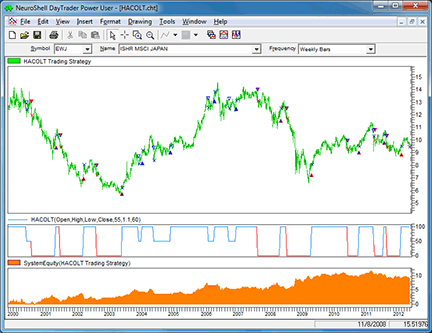
FIGURE 5: NEUROSHELL TRADER, HEIKIN-ASHI CANDLES OSCILLATOR LONG TERM (HACOLT). This NeuroShell Trader chart shows the HACOLT trading system, indicator, and resulting equity curve.
—Marge Sherald, Ward Systems Group, Inc.
301 662-7950, sales@wardsystems.com
www.neuroshell.com
BACK TO LIST

AIQ: HEIKIN-ASHI CANDLES OSCILLATOR LONG TERM (HACOLT)
The AIQ code based on Sylvain Vervoort’s article in this issue, “Long-Term Trading Using Exchange Traded Funds,” is provided at the following website: www.TradersEdgeSystems.com/traderstips.htm. It is also shown below.
Due to the use of several recursive calculations, the EDS code runs slowly but if you have patience, it will finish. Using the author’s system described in his article, I used the Portfolio Manager module to run portfolio tests on an 18-country list of ETFs. This list will be posted to my website as an AIQ list file along with the EDS file. The EDS file requires at least three years of data before trading can begin, and the test I ran starts the trading on 1/2/2002 and ends on 5/11/2012. The following capitalization settings were used:
- Maximum of 10 open positions
- Size each position at 10% of mark-to-market total capital
- Take no more than 10 new positions per day
- Compute the mark-to-market capital each day
- Choose signals based on a relative strength indicator for ranking in descending order for longs and ascending order for shorts.
I ran separate backtests of trading long-only and short-only and then, using the consolidation feature, combined the two equity curves (Figure 6), which is compared to the S&P 500 (SPX). With these settings, the internal rate of return averaged 10% with a maximum drawdown of 29.5% on 7/23/2008.
!LONG TERM TRADING USING ETFs
!Author: Sylvain Vervoort TASC July 2012
!Coded by: Richard Denning 5/8/12
!www.TradersEdgeSystems.com

! CODING ABBREVIATIONS:
H is [high].
H1 is valresult(H,1).
L is [low].
L1 is valresult(L,1).
C is [close].
C1 is valresult(C,1).
Op is [open].
V is [volume].
OSD is offsettodate(month(),day(),year()).
HD is hasdatafor(2500).

! INPUTS:
emaLen is 55.
candlesize is 1.1.
LTAverage is 60.

!-------------------------HEIKIN-ASHI------------------------
haCtp is (Op + H +L + C) / 4.
DaysInto is ReportDate() - RuleDate().
end if DaysInto > 60.
endHAO is iff(end,Op, haO).
haO is (valresult(endHAO,1) + valresult(haCtp,1)) / 2.
haH is Max(H,max(haO,haCtp)).
haL is Min(L,min(haO,haCtp)).
haCL is (haCtp + haO + haH + haL) / 4.
!---------------------end HEIKIN-ASHI------------------------

!---------------TYPICAL PRICE ZERO-LAG TEMA------------------
TP is (H+L)/2.
TMA1 is expavg(TP,emaLen).
TMA2 is expavg(TMA1,emaLen).
TMA3 is expavg(TMA2,emalen).
tpTEMA1 is 3*TMA1-3*TMA2+TMA3.
TMA4 is expavg(tpTEMA1,emaLen).
TMA5 is expavg(TMA4,emaLen).
TMA6 is expavg(TMA5,emalen).
tpTEMA2 is 3*TMA4-3*TMA5+TMA6.
Diff2 is tpTEMA1 - tpTEMA2.
zLAGtp is tpTEMA1 + Diff2.
!-----------end TYPICAL PRICE ZERO-LAG TEMA------------------

!-----------------HEIKIN-ASHI ZERO-LAG TEMA------------------
haTMA1 is expavg(haCL,emaLen).
haTMA2 is expavg(haTMA1,emaLen).
haTMA3 is expavg(haTMA2,emalen).
haTEMA1 is 3*haTMA1-3*haTMA2+haTMA3.
haTMA4 is expavg(haTEMA1,emaLen).
haTMA5 is expavg(haTMA4,emaLen).
haTMA6 is expavg(haTMA5,emalen).
haTEMA2 is 3*haTMA4-3*haTMA5+haTMA6.
Diff3 is haTEMA1 - haTEMA2.
zLAGha is haTEMA1 + Diff3.
!----------end HEIKIN-ASHI ZERO-LAG TEMA----------------------

!-----------HACOLT INDICATOR----------------------------------
ZLHa is zLAGha.
ZLCl is zLAGtp.
keep1 if countof(haCL>=haO,2)>=1 or C>=haCL
	or (C<haCL and (H>H1 or L>L1)).
keep2 if (ZLCl-ZLHa)>=0.
keep3 if Abs(C-Op)<(H-L)*CandleSize and H>=L1.
keeping if (keep1 or keep2).
keepall if keeping or (valrule(keeping,1)
	and (C>=Op or keep3)).
utr if keepall or (valrule(keepall,1) and keep3).

keep4 if countof(haCL<haO,2)>=1.
keep5 if (ZLCl-ZLHa)<0.
keep6 if Abs(C-Op)<(H-L)*CandleSize and L<=H1.
keeping2 if keep4 or keep5.
keepall2 if keeping2 or (valrule(keeping2,1)
	and (C<Op or C<C1)).
dtr if keepall2 or (valrule(keepall2,1) and keep6).
dnw if not utr and valrule(utr,1) and dtr.
upw if not dtr and valrule(dtr,1) and utr.
upw_OS is scanany(upw,250) then OSD.
dnw_OS is scanany(dnw,250) then OSD.
upwORdnwLAST is iff(^upw_OS < ^dnw_OS,1,0).
Result is iff(upw,1,iff(dnw,0,upwORdnwLAST)).
LTema is expavg(C,LTAverage).
LTSell is iff(C < expavg(C,LTAverage),1,0).
endLTResult is iff(end,1, LTResult).
LTResult is iff(Result=1,1,iff(Result=0
	and LTSell=1,0,valresult(endLTResult,1))).
endHACOLT is iff(end,50,HACOLT).

!PLOT THE FOLLOWING AS A SINGLE LINE INDICATOR:
HACOLT is iff(Result=1,100,iff(Result=0
	and LTResult=1,50,iff(Result=0
	and LTResult=0,0,valresult(endHACOLT,1)))).
!-------------end HACOLT INDICATOR--------------------------

!-------------HACOLT TRADING SYSTEM-------------------------
!TRADING SYSTEM RULES:
BUY if HACOLT = 100 and HD >= 3*250.
SELL if HACOLT <= 50.
SHORT if HACOLT = 0 and HD >= 3*250.
COVER if HACOLT = 100.
!------------end HACOLT TRADING SYSTEM----------------------
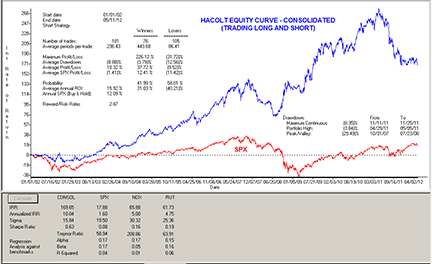
FIGURE 6: AIQ, HACOLT TRADING SYSTEM. Here is a consolidated equity curve for the HACOLT system trading on a list of 18 country ETFs for the period 1/2/2002 to 5/11/2012 (blue curve) compared to the S&P 500 (red curve).
—Richard Denning
info@TradersEdgeSystems.com
for AIQ Systems
BACK TO LIST

TRADERSSTUDIO: HEIKIN-ASHI CANDLES OSCILLATOR LONG TERM (HACOLT)
The TradersStudio code based on Sylvain Vervoort’s article in this issue, “Long-Term Trading Using Exchange Traded Funds,” is provided at the following websites:
The following code files are provided in the download:
- Indicator Plot: “HACOLT_IND” for displaying the weekly HACOLT indicator
- Function: “HAC” for computing the heikin-ashi close
- Function: “HAO” for computing the heikin-ashi open
- Function: “zLagHA” for computing the zero-lag TEMA of the heikin-ashi close
- Function: “zLagTP” for computing the zero-lag TEMA of the close
- Function: “HACOLT” for computing the Sylvain Vervoort’s HACOLT value
- System: “HACOLT_SYS” for backtesting Sylvain Vervoort’s system.
The code is also shown here:
'LONG-TERM TRADING USING EXCHANGE TRADED FUNDS
'Author: Sylvain Vervoort, TASC July 2012
'Coded by: Richard Denning 5/08/2012
'www.TradersEdgeSystems.com

'---------------------------------------------------
'HEIKIN-ASHI CLOSE (as modified by author):
Function haC() As BarArray
    Dim haOp As BarArray
    Dim haH As BarArray
    Dim haL As BarArray
    Dim haCTP As BarArray
    haCTP =  (O+H+L+C)/4
    haOp = (haCTP[1] + haOp[1]) / 2
    haH = Max(H,Max(haOp,haCTP))
    haL = Min(L,Min(haOp,haCTP))
    haC = (haCTP + haOp + haH + haL) / 4
End Function
'---------------------------------------------------
'HEIKIN-ASHI OPEN (as modified by author):
Function haO() As BarArray
    Dim haCTP As BarArray
    haCTP =  (O+H+L+C)/4
    haO = (haCTP[1] + haO[1]) / 2
End Function
'---------------------------------------------------
'HA ZERO LAG TEMA

Function zLagHA(xmaLen) As BarArray
    Dim haCL As BarArray
    Dim haTMA1, haTMA2, haTMA3, haTMA4, haTMA5
    Dim haTMA6, haTEMA1, haTEMA2, diff
    haCL=haC()
    haTMA1 = XAverage(haCL,xmaLen)
    haTMA2 = XAverage(haTMA1,xmaLen)
    haTMA3 = XAverage(haTMA2,xmaLen)
    haTEMA1 = 3*haTMA1-3*haTMA2+haTMA3
    haTMA4 = XAverage(haTEMA1,xmaLen)
    haTMA5 = XAverage(haTMA4,xmaLen)
    haTMA6 = XAverage(haTMA5,xmaLen)
    haTEMA2 = 3*haTMA4-3*haTMA5+haTMA6
    diff = haTEMA1 - haTEMA2
    zLagHA = haTEMA1 + diff
End Function
'----------------------------------------------------
'TP ZERO LAG TEMA

Function zLagTP(price As BarArray,xmaLen) As BarArray
    Dim tp As BarArray
    Dim tma1, tma2, tma3, tpTEMA1
    Dim tma4, tma5, tma6, tpTEMA2, diff
    tp = price
    tma1 = XAverage(tp,xmaLen)
    tma2 = XAverage(tma1,xmaLen)
    tma3 = XAverage(tma2,xmaLen)
    tpTEMA1 = 3*tma1-3*tma2+tma3
    tma4 = XAverage(tpTEMA1,xmaLen)
    tma5 = XAverage(tma4,xmaLen)
    tma6 = XAverage(tma5,xmaLen)
    tpTEMA2 = 3*tma4-3*tma5+tma6
    diff = tpTEMA1 - tpTEMA2
    zLagTP = tpTEMA1 + diff
End Function
'-----------------------------------------------------
'LONG-TERM TRADING USING EXCHANGE TRADED FUNDS
'Author: Sylvain Vervoort, TASC July 2012
'Coded by: Richard Denning 5/08/2012
'www.TradersEdgeSystems.com

Function HACOLT(emaLen1, candleSize, emaLen2) As BarArray
'default: emaLen1=55, candleSize=1.1, emaLen2=60)
Dim haCL As BarArray
Dim haOp As BarArray
Dim ZLHa As BarArray
Dim ZLCl As BarArray
Dim keep1 As BarArray
Dim keep2 As BarArray
Dim keep3 As BarArray
Dim keep4 As BarArray
Dim keep5 As BarArray
Dim keep6 As BarArray
Dim keeping As BarArray
Dim keeping2 As BarArray
Dim keepAll As BarArray
Dim keepAll2 As BarArray
Dim dtr As BarArray
Dim utr As BarArray
Dim upw As BarArray
Dim dnw As BarArray
Dim Result As BarArray
Dim LTResult As BarArray
Dim LTSell As BarArray

haCL = haC()
haOp = haO()
ZLHa = zLagHA(emaLen1)
ZLCl = zLagTP((H+L)/2,emaLen1)

keep1 = IIF(haCL>=haOp Or haCL[1]>=haOp[1] Or C>=haCL,1,IIF(H>H[1] Or L>L[1],1,0))
keep2 = IIF((ZLCl-ZLHa) >= 0,1,0)
keep3 = IIF(Abs(C-O)<(H-L)*candleSize And H>=L[1],1,0)
keeping = IIF(keep1=1 Or keep2=1,1,0)
keepAll = IIF(keeping=1 Or (keeping[1]=1 And (C>=O Or keep3)),1,0)
utr = IIF(keepAll=1 Or (keepAll[1]=1 And keep3=1),1,0)

keep4 = IIF(haCL<haOp Or haCL[1]<haOp[1],1,0)
keep5 = IIF((ZLCl-ZLHa)<0,1,0)
keep6 = IIF(Abs(C-O)<(H-L)*candleSize And L<=H[1],1,0)
keeping2 = IIF(keep4=1 Or keep5=1,1,0)
keepAll2 = IIF(keeping2=1 Or (keeping2[1]=1 And (C<O Or C<C[1])),1,0)
dtr = IIF(keepAll2=1 Or (keepAll2[1]=1 And keep6),1,0)

upw = IIF(dtr=0 And dtr[1]=1 And utr=1,1,0)
dnw = IIF(utr=0 And utr[1]=1 And dtr=1,1,0)
Result = IIF(upw=1,1,IIF(dnw=1,0,Result[1]))
LTSell = IIF(C<XAverage(C,emaLen2),1,0)
LTResult = IIF(Result=1,1,IIF(Result=0 And LTSell=1,0,LTResult[1]))

HACOLT = IIF(Result=1,100,IIF(Result=0 And LTResult=1,50,IIF(Result=0 And LTResult=0,0,HACOLT[1])))

End Function

'-----------------------------------------------------
Sub HACOLT_SYS(emaLen1, candleSize, emaLen2)
'defaults: emaLen1=55,candleSize=1.1,emaLen2=60
Dim theHACOLT As BarArray
theHACOLT = HACOLT(emaLen1, candleSize, emaLen2)
If Date > MigrateDate(1020701) Then
    If theHACOLT = 100 Then Buy("LE",1,0,Market,Day)
    If theHACOLT = 50 Or theHACOLT = 0 Then ExitLong("LX","",1,0,Market,Day)
    If theHACOLT = 0 Then Sell("SE",1,0,Market,Day)
    If theHACOLT = 100 Then ExitShort("SX","",1,0,Market,Day)
End If
End Sub
'------------------------------------------------------
Although Vervoort designed this system to trade ETFs, I wanted to test it on other markets since there is such limited data for ETFs and the author’s tests would all be considered “in-sample” tests. I ran a test using a portfolio of futures contracts that included the following markets from the Pinnacle Data service (reverse adjusted):
AN,BN,CN,FN,JN,SN,EC,CL,HO,NG,RB,TA,TD,UA,CC,CT,JO,KC,LB,SB,BO,C,NR,O,S,SM,W,MD,ND,SP,FC,LC,LH,GC,HG,PA,PL, and SI.
In Figure 7, I show the resulting log equity curve trading this portfolio starting with one million dollars and using a percentage-of-margin trading plan set at 20% with a 100-contract maximum. In addition, within this figure, I show the underwater equity curve. For each round-turn trade, I deducted commission and slippage of $75 per contact. Although the test started in 1/2/1997, I prevented the trading from starting until 1/2/2000 to allow for the exponential averages to stabilize. For the period 1/2/2000 to 5/9/2012, the system returned $3,604,893 with a maximum drawdown of 38.7% on 10/28/2011.
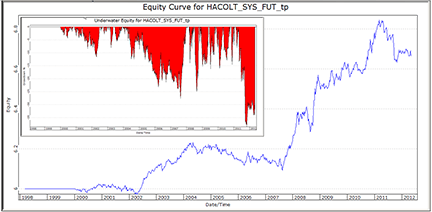
FIGURE 7: TRADERSSTUDIO, HACOLT SYSTEM. Here is a log equity curve with an underwater equity curve for the system on 38 different futures markets.
—Richard Denning
info@TradersEdgeSystems.com
for TradersStudio
BACK TO LIST

NINJATRADER: HEIKIN-ASHI CANDLES OSCILLATOR LONG TERM (HACOLT)
The heikin-ashi candles oscillator long term (HACOLT) trading strategy, as described in “Long-Term Trading Using Exchange Traded Funds” by Sylvain Vervoort in this issue, has been implemented as an automated strategy available for download at www.ninjatrader.com/SC/July2012SC.zip.
Once the strategy has been downloaded, from within the NinjaTrader Control Center window, select the menu File → Utilities → Import NinjaScript and select the downloaded file. This file is for NinjaTrader version 7 or greater.
You can review the strategy source code by selecting the menu Tools → Edit NinjaScript → Strategy from within the NinjaTrader Control Center window and selecting “HACOLTATS.”
You can review the indicator source code by selecting the menu Tools → Edit NinjaScript → Indicator from within the NinjaTrader Control Center window and selecting “HACOLT.”
A sample chart implementing the strategy is shown in Figure 8.
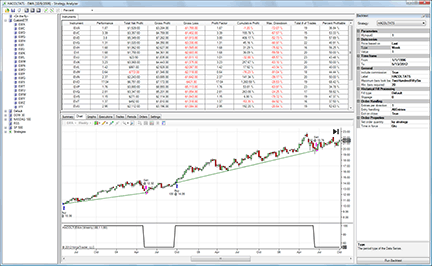
FIGURE 8: NINJATRADER, HEIKIN-ASHI CANDLES OSCILLATOR LONG TERM STRATEGY (HACOLT). This screenshot shows a backtest report on the HACOLT automated trading strategy, including results and a chart applied to a weekly series of the iShares MSCI Australia Index (EWA).
—Raymond Deux & Ryan Millard
NinjaTrader, LLC
www.ninjatrader.com
BACK TO LIST

AMIBROKER: HEIKIN-ASHI CANDLES OSCILLATOR LONG TERM (HACOLT)
In “Long-Term Trading Using Exchange Traded Funds” in this issue, author Sylvain Vervoort presents an ETF trading method using his heikin-ashi candles oscillator (HACO).
A ready-to-use AmiBroker formula implementing HACO is shown here. To use it, enter the formula in the AFL Editor, then press “Insert indicator” or go to the Tools→Backtest menu if you wish to test the system.
LISTING 1.
// Heikin-Ashi Candles Oscillator
Avgp = Param( "TEMA average", 55, 1, 100 );
CandleSize = Param( "Candle Size factor", 1.1, 0.01, 5, 0.01 );
LTAverage = Param( "Shorting LT Average", 60, 1, 200 );

price = ( O + H + L + C ) / 4;

haOpen = AMA( Ref( price, -1 ), 0.5 );

haC = ( price + haOpen + Max( H, haOpen ) + Min( L, haOpen ) ) / 4;

ZlHa = TEMA( haC, Avgp ) + ( TEMA( haC, Avgp ) - ( TEMA( TEMA( haC, Avgp ), Avgp ) ) );

ZlCl = TEMA( ( H + L ) / 2, Avgp ) + ( TEMA( ( H + L ) / 2, Avgp ) - ( TEMA( TEMA( ( H + L ) / 2, Avgp ), Avgp ) ) );

keep1 = Hold( haC >= haOpen, 2 ) OR C >= haC OR ( H > Ref( H, -1 ) OR L > Ref( L, -1 ) );
keep2 = ( ZlCl - ZlHa ) >= 0;
keeping = ( keep1 OR keep2 );
keepall = keeping OR ( Ref( keeping, -1 ) AND C >= O OR C >= Ref( C, -1 ) );
keep3 = ( abs( C - O ) < ( H - L ) * CandleSize AND H >= Ref( L, -1 ) );
utr = Keepall OR ( Ref( keepall, -1 ) AND keep3 );
keep1 = Hold( haC < haOpen, 2 );
keep2 = ( ZlCl - ZlHa ) < 0;
keep3 = abs( C - O ) < ( H - L ) * CandleSize AND L <= Ref( H, -1 );
keeping = keep1 OR keep2;
keepall = keeping OR ( Ref( keeping, -1 ) AND C < O OR C < Ref( C, -1 ) );
dtr = Keepall OR ( Ref( keepall, -1 ) AND keep3 ) == 1;
upw = dtr == 0 AND Ref( dtr, -1 ) AND utr;
dnw = utr == 0 AND Ref( utr, -1 ) AND dtr;
Result = IIf( upw, 1, IIf( dnw, 0, ValueWhen( upw + dnw, upw ) ) );
LTSell = C < EMA( C, LTAverage );
LTResult = Flip( Result, Result == 0 AND LTSell );
Haco = IIf( Result, 100, IIf( LTResult, 50, 0 ) );


Plot( Haco , "HACO"+_PARAM_VALUES(), ParamColor("Color", colorRed));

pHaco = Ref( Haco, -1 );

Buy = Haco == 100 AND pHaco != 100;
Sell = ( Haco == 50 OR Haco == 0 ) AND pHaco == 100;
Short = Haco == 0 AND pHaco != 0;
Cover = Buy;
A sample chart is shown in Figure 9.
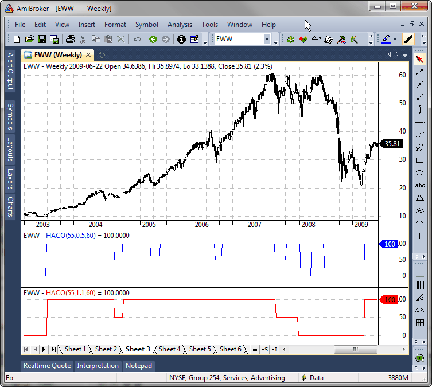
FIGURE 9: AMIBROKER, HEIKIN-ASHI CANDLES OSCILLATOR (HACO). Here is a weekly price chart of iShares MSCI Mexico Investable Market Index (EWW). The middle pane shows a blue chart of HACO with a CandleSize setting of 0.5 while the bottom pane shows a red chart of HACO with a CandleSize of 1.1.
—Tomasz Janeczko
AmiBroker.com
www.amibroker.com
BACK TO LIST

UPDATA: HEIKIN-ASHI CANDLES OSCILLATOR LONG TERM (HACOLT)
This tip is based on “Long-Term Trading Using Exchange Traded Funds” by Sylvain Vervoort in this issue.
In the article, the author proposes that the small price movements of ETFs make daytrading unprofitable for trend-followers. However, using heikin-ashi candlestick techniques on a weekly time frame, the article details an oscillator to time counter-trending entries. (See Figure 10.)
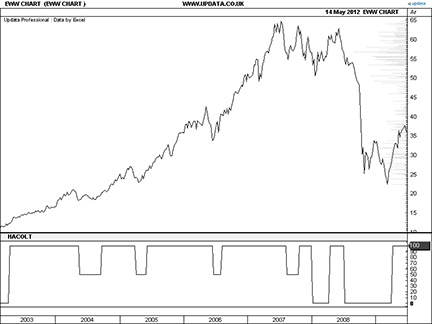
FIGURE 10: UPDATA, HEIKIN-ASHI CANDLES OSCILLATOR LONG TERM (HACOLT). This chart shows the heikin-ashi candles oscillator long term (HACOLT) applied to the weekly resolution iShares MSCI Mexico Investible Market Index Fund (EWW).
The Updata code for this indicator and system is in the Updata Library and may be downloaded by clicking the Custom menu and then either “Indicator library” or “System library.” Those who cannot access the library due to a firewall may paste the code shown below into the Updata custom editor and save it.
PARAMETER "TEMA Period" #Avg1Period=55
PARAMETER "Long Term Average" #LTAverage=60
PARAMETER "CandleSize" @CandleSize=1.1
NAME "HACOLT" ""
DISPLAYSTYLE LINE
INDICATORTYPE CHART
@haClose=0
@haOpen=0
@haZL=0
@TEMAhaClose=0
@temaTEMAhaClose=0
@TEMAmid=0
@temaTEMAmid=0
@ZLClose=0
@mid=0
@KEEP1=0
@KEEPING=0
@KEEPALL=0
@KEEP3=0
@UTR=0
@DTR=0
@UPW=0
@DNW=0
@RESULT=0
@LTSell=0
@LTResult=0
@FN=0
@KEEP1b=0
@KEEPINGb=0
@KEEPALLb=0
@KEEP3b=0
FOR #CURDATE=0 TO #LASTDATE
IF #CURDATE>1
   @mid=(HIGH+LOW)/2
   'Heikin-Ashi Candlestick Code
   @haOpen=(HIST(@haOpen,1)+(OPEN(1)+HIGH(1)+LOW(1)+CLOSE(1))/4)/2
   @haClose=(((OPEN(1)+HIGH(1)+LOW(1)+CLOSE(1))/4)+@haOpen+MAX(HIGH,@haOpen)+MIN(LOW,@haOpen))/4
   'Triple Exp. Smoothing
   @TEMAhaClose=3*Sgnl(@haClose,#Avg1Period,E)-3*Sgnl(Sgnl(@haClose,#Avg1Period,E),#Avg1Period,E)...
   +Sgnl(Sgnl(Sgnl(@haClose,#Avg1Period,E),#Avg1Period,E),#Avg1Period,E)
   @temaTEMAhaClose=3*Sgnl(@TEMAhaClose,#Avg1Period,E)-    3*Sgnl(Sgnl(@TEMAhaClose,#Avg1Period,E),#Avg1Period,E)...
   +Sgnl(Sgnl(Sgnl(@TEMAhaClose,#Avg1Period,E),#Avg1Period,E),#Avg1Period,E)
   @haZL=@TEMAhaClose+(@TEMAhaClose-@temaTEMAhaClose)
   @TEMAmid=3*Sgnl(@mid,#Avg1Period,E)-3*Sgnl(Sgnl(@mid,#Avg1Period,E),#Avg1Period,E)...
   +Sgnl(Sgnl(Sgnl(@mid,#Avg1Period,E),#Avg1Period,E),#Avg1Period,E)
   @temaTEMAmid=3*Sgnl(@TEMAmid,#Avg1Period,E)-3*Sgnl(Sgnl(@TEMAmid,#Avg1Period,E),#Avg1Period,E)...
   +Sgnl(Sgnl(Sgnl(@TEMAmid,#Avg1Period,E),#Avg1Period,E),#Avg1Period,E)
   @ZLClose=@TEMAmid+(@TEMAmid-@temaTEMAmid)
   'UTR
   If @haClose>=@haOpen OR Hist(@haClose>=@haOpen,1) OR Close>=@haClose
      @KEEP1=TRUE
   ElseIf (High>High(1) OR LOW>LOW(1))
     @KEEP1=TRUE
   Else
     @KEEP1=FALSE
   EndIf
   @KEEPING=(@ZLClose-@haZL>=0) OR (@KEEP1=TRUE)
   @KEEPALL=@KEEPING=TRUE OR (HIST(@KEEPING=TRUE,1) AND CLOSE>=OPEN OR CLOSE>=CLOSE(1))
   @KEEP3=ABS(CLOSE-OPEN)<(HIGH-LOW)*@CandleSize AND HIGH>=LOW(1)
   @UTR=@KEEPALL=TRUE OR (HIST(@KEEPALL=TRUE,1) AND @KEEP3=TRUE)
   'DTR
   @KEEP1b=@haClose<@haOpen OR Hist(@haClose<@haOpen,1)
   @KEEPINGb=(@ZLClose-@haZL<0) OR (@KEEP1b=TRUE)
   @KEEPALLb=@KEEPINGb=TRUE OR (HIST(@KEEPINGb=TRUE,1) AND CLOSE<OPEN OR CLOSE<CLOSE(1))
   @KEEP3b=ABS(CLOSE-OPEN)<(HIGH-LOW)*@CandleSize AND LOW<=HIGH(1)
   @DTR=@KEEPALLb=TRUE OR (HIST(@KEEPALLb=TRUE,1) AND @KEEP3b=TRUE)
   @UPW=(@DTR=FALSE AND HIST(@DTR=TRUE,1) AND @UTR=TRUE)
   @DNW=(@UTR=FALSE AND HIST(@UTR=TRUE,1) AND @DTR=TRUE)
   If @UPW=TRUE
      @RESULT=1
   ElseIf @DNW=TRUE
      @RESULT=0
   EndIf
   @LTSell=CLOSE<EAVE(#LTAverage)
   If @RESULT=1
      @LTResult=1
   ElseIf @RESULT=0 AND CLOSE<EAVE(#LTAverage)
      @LTResult=0
   EndIf
   If @RESULT=1
      @FN=100
   ElseIf @RESULT=0 AND @LTResult=1
      @FN=50
   ElseIf @RESULT=0 AND @LTResult=0
      @FN=0
   EndIf
   @PLOT=@FN
ELSE
   @haOpen=OPEN
ENDIF
NEXT
—Updata support team
support@updata.co.uk, www.updata.co.uk
BACK TO LIST

TRADECISION: HEIKIN-ASHI CANDLES OSCILLATOR LONG TERM (HACOLT)
In “Long-Term Trading Using Exchange Traded Funds” in this issue, author Sylvain Vervoort introduces his HACOLT method for analyzing exchange traded funds (ETFs).
To import the strategy directly into Tradecision, visit the area “Traders’ Tips from TASC Magazine” at www.tradecision.com/support/tasc_tips/tasc_traders_tips.htm or copy the code shown below using the following instructions.
- Use Tradecision’s Function Builder to recreate Vervoort’s HACOLT function using the following code:
HACOLT function:

function (avg:numeric=55,CandleSize:Numeric=1.1, LTAverage:Numeric=60):Numeric;

var
hacOpen:=0;
hacC:=0;
hacOpenPrev:=0;
ZlHa:=0;
ZlCl:=0;
keep1:=0;
keep2:=0;
keeping:=0;
keepall:=0;
keep3:=0;
utr:=0;
keep1_byconvertor_1:=0;
keep2_byconvertor_1:=0;
keep3_byconvertor_1:=0;
keeping_byconvertor_1:=0;
keepall_byconvertor_1:=0;
dtr:=0;
upw:=0;
dnw:=0;
Result:=0;
LTSell:=0;
LTResult:=0;
LTResultPrev:=0;
end_var


if HISTORYSIZE > avg then

hacOpenPrev:=(O\2\ + H\2\ + L\2\ + C\2\)/4;
hacOpen:=((O\1\ + H\1\ + L\1\ + C\1\)/4) + hacOpenPrev / 2;
hacC:=((O + H + L + C) / 4 + haOpen + Max(H, haOpen) + Min(L, haOpen)) / 4;
ZlHa:=Tema(haC, avg) + (Tema(haC, avg) - (Tema(Tema(haC, avg), avg)));
ZlCl:=Tema((H + L) / 2, avg) + (Tema((H + L) / 2, avg) - (Tema(Tema((H + L) / 2, avg), avg)));

if hacC >= hacOpen and BarsSince(hacC >= hacOpen) < 3 then keep1:=1;
                                                      else keep1:=0;
keep1:= iff(C >= haC, 1, iff(H >Ref(H, -1) or L >Ref(L, -1), 1, 0));
keep2:= iff((ZlCl - ZlHa) >= 0,1,0);

if keep1=1 then keeping:=1; else keeping:=0;
if keep2=1 then keeping:=1; else keeping:=0;
if keeping=1 then keepall:=1; else keepall:=0;
if keeping\1\=1 and (C >= O or C >= C\1\) then keepall:=1; else keepall:=0;
if (Abs(C - O) < (H - L) * CandleSize) and H >= L\1\ then keep3:=1; else keep3:=0;
if keepall=1 or (keepall\1\=1 and keep3=1)then utr:=1; else utr:=0;


if haC < haOpen and BarsSince(haC < haOpen) < 2 then keep1:=1;
                                                else keep1:=0;
if (ZlCl - ZlHa) < 0 then keep2_byconvertor_1:=1; else keep2_byconvertor_1:=0;
if ((Abs(C - O) < (H - L) * CandleSize) and L <= H\1\) then keep3_byconvertor_1:=1;  else keep3_byconvertor_1:=0;
if keep1_byconvertor_1=1 or keep2_byconvertor_1=1  then keeping_byconvertor_1:=1; else keeping_byconvertor_1:=0;
if keeping_byconvertor_1=1 or keeping_byconvertor_1\1\=1 and ((C < O) or (C < C\1\)) then keepall_byconvertor_1:=1;  else keepall_byconvertor_1:=0;


if(keepall_byconvertor_1=1 or (keepall_byconvertor_1\1\=1 and keep3_byconvertor_1=1)) then dtr:= 1;  else dtr:=0;
upw:= iff((dtr=0 and dtr\1\=1 and utr=1),1,0);
dnw:= iff((utr=0 and utr\1\=1 and dtr=1),1,0);

Result:=iff(upw=1, 1, iff(dnw=1, 0, NthValueWhen(1, upw + dnw > 0, iff(upw=1, 1, 0))));
LTSell:=iff(C < Mov(C, LTAverage, E),1,0);

LTResultPrev:=LTResult\1\;

if Result = 1 then LTResult:=1;
   else if(Result = 0 and LTSell = 1) then LTResult:=0;
       else  LTResult:=LTResult\1\;


return iff(Result = 1, 100, iff(Result = 0 and LTResult = 1, 50, iff(Result = 0 and LTResult = 0, 0, this\1\)));
- Use Tradecision’s Indicator Builder to recreate Vervoort’s HACOLT indicator using the following formula:
HACOLT indicator:

return HACOLT(55,1.1,60);
- Use Tradecision’s Strategy Builder to recreate Vervoort’s HACOLT strategy:
HACOLT strategy:

Entry Long:

if  HACOLT(55,1.1,60) = 100 then return true;
return false;

Exit Long:

if  HACOLT(55,1.1,60) = 50 or HACOLT(55,1.1,60)=0 then return true;
return false;

Entry Short:

if  HACOLT(55,1.1,60) = 0 then return true;
return false;

Exit Short:
if  HACOLT(55,1.1,60) = 100 then return true;
return false;
A sample chart is shown in Figure 11.
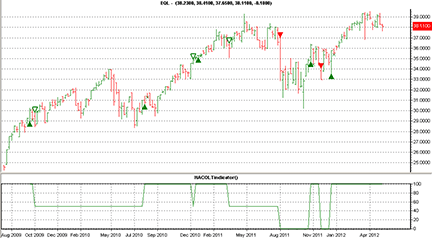
FIGURE 11: TRADECISION, HEIKIN-ASHI CANDLES OSCILLATOR LONG TERM (HACOLT), WEEKLY. Here is the HACOLT strategy with trading signals and the HACOLT indicator plotted on a weekly chart of ALPS Equal Sector Weight.
—Yana Timofeeva, Alyuda Research
510 931-7808, sales@tradecision.com
www.tradecision.com
BACK TO LIST

VT TRADER: HEIKIN-ASHI CANDLES OSCILLATOR LONG TERM (HACOLT)
This Traders’ Tip is based on “Long-Term Trading Using Exchange Traded Funds” by Sylvain Vervoort in this issue. In the article, Vervoort introduces his heikin-ashi candles oscillator long term (HACOLT) indicator.
We’ll be offering the HACOLT indicator for download in our VT client forums at https://forum.vtsystems.com along with hundreds of other precoded and free indicators and trading systems.
The step-by-step instructions for recreating the HACOLT indicator in VT Trader are as follows:
- VT Trader’s Ribbon → Technical Analysis menu → Indicators group → Indicators Builder → [New] button
- In the General tab, input the following text into each corresponding text box:
Name: TASC - 07/2012 - HACOLT
Function Name Alias: tasc_HACOLT
Label Mask: TASC - 07/2012 - HACOLT (%avg%,%CandleSize%,%LTAverage%) = %Hacolt%
Placement: New Frame
Data Inspection Alias: HACOLT
- In the Input Variable(s) tab, create the following variables:
[New] button...
Name: avg
Display Name: TEMA Periods
Type: integer
Default: 55

[New] button...
Name: CandleSize
Display Name: Candle Size Factor
Type: float (with bounds)
Default: 1.1
Min. Bounds: 0.01
Max. Bounds: 5

[New] button...
Name: LTAverage
Display Name: Shorting LT Average
Type: integer
Default: 60
- In the Output Variable(s) tab, create the following variables:
[New] button...
Var Name: Hacolt
Name: (Hacolt)
Line Color: blue
Line Width: 2
Line Type: solid
- In the Horizontal Line tab, create the following horizontal lines:
[New] button...
Value: +100
Line Color: red
Line Width: thin
Line Type: dashed

[New] button...
Value: +50
Line Color: gray
Line Width: thin
Line Type: dashed

[New] button...
Value: 0
Line Color: red
Line Width: thin
Line Type: dashed
- In the Formula tab, copy and paste the following formula:
{Provided By: Visual Trading Systems, LLC}
{Copyright: 2012}
{Description: TASC, July 2012 -  "Long-Term Trading Using Exchange Traded Funds" by Sylvain Vervoort}
{File: tasc_HACOLT.vtscr - Version 1.0}

ZlHa:= vt_Tema(haClose,avg,E) + (vt_Tema(haClose,avg,E) - (vt_Tema(vt_Tema(haClose,avg,E),avg,E)));
ZlCl:= vt_Tema((H+L)/2,avg,E) + (vt_Tema((H+L)/2,avg,E) - (vt_Tema(vt_Tema((H+L)/2,avg,E),avg,E)));
keep1:= SignalHold(haClose>=haOpen,2) OR If(C>=haClose,1,If(H>Ref(H,-1) OR L>Ref(L,-1),1,0));
keep2:= (ZlCl-ZlHa)>=0;
keeping:= (keep1 OR keep2);
keepall:= keeping OR (Ref(keeping,-1) AND (C>=O) OR C>=Ref(C,-1));
keep3:= (Abs(C-O)<(H-L)*CandleSize AND H>=Ref(L,-1));
utr:= Keepall OR (Ref(keepall,-1) AND keep3);
keep1:= SignalHold(haClose<haOpen,2);
keep2:= (ZlCl-ZlHa)<0;
keep3:= Abs(C-O)<(H-L)*CandleSize AND L<=Ref(H,-1);
keeping:= keep1 OR keep2;
keepall:= keeping OR (Ref(keeping,-1) AND (C<O) OR C<Ref(C,-1));
dtr:= If(Keepall OR (Ref(keepall,-1) AND keep3)=1,1,0);
upw:= dtr=0 AND Ref(dtr,-1) AND utr;
dnw:= utr=0 AND Ref(utr,-1) AND dtr;
Result:= If(upw,1,If(dnw,0,ValueWhen(1,upw+dnw,If(upw,1,0))));
LTSell:= C < Mov(C,LTAverage,E);
LTResult:= If(Result=1,1,If(Result=0 AND LTSell=1,0,PREV(0)));
Hacolt:= If(Result=1,100,If(Result=0 AND LTResult=1,50,If(Result=0 AND LTResult=0,0,PREV(0))));
- Click the Save icon in the toolbar to finish building the HACOLT indicator.
To attach the indicator to a chart, click the right mouse button within the chart window and select Add Indicator → “TASC - 07/2012 – HACOLT” from the indicator list.
A sample chart is shown in Figure 12.
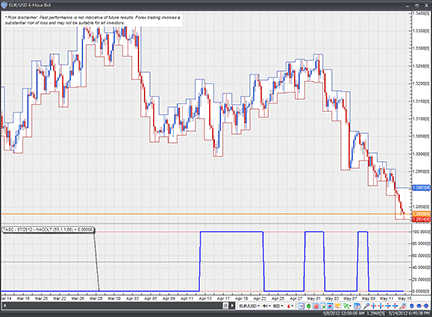
FIGURE 12: VT TRADER, HEIKIN-ASHI CANDLES OSCILLATOR LONG TERM (HACOLT). Here, the HACOLT indicator is displayed on a EUR/USD four-hour candlestick chart.
To learn more about VT Trader, visit www.vtsystems.com.
Risk disclaimer: Past performance is not indicative of future results. Forex trading involves a substantial risk of loss and may not be suitable for all investors.
—Chris Skidmore
Visual Trading Systems, LLC
vttrader@vtsystems.com, www.vtsystems.com
BACK TO LIST
MICROSOFT EXCEL: HEIKIN-ASHI CANDLES OSCILLATOR LONG TERM (HACOLT)
In his article in this issue, “Long-Term Trading Using Exchange Traded Funds,” author Sylvain Vervoort demonstrates a powerful oscillator for recognizing and following longer-term trends. It is also reasonably sensitive to interruptions of the trend and full-trend reversals.
Vervoort’s oscillator uses the TEMA smoothing function four times. TEMA is not a built-in function in Excel, but it can be implemented by way of cell formulas (as I have done for this Traders’ Tip) or as a user-defined function (VBA macro). See Patrick Mulloy’s February 1994 S&C article that is referenced in the suggested reading section at the end of Vervoort’s article (“Smoothing Data With Less Lag”) for more on TEMA.
As Vervoort suggests in his article, you need a large amount of data prior to the period of interest; otherwise, the oscillator parts do not have sufficient time to stabilize properly.
This is evidenced in Figure 13. Per Figure 6 of Vervoort’s article, there should be a dip to the HACO 50 level in the middle of 2004. The dips in 2005 and 2006 did not show up for me until I pulled in all of the weekly data I could get from the Yahoo Finance history page.
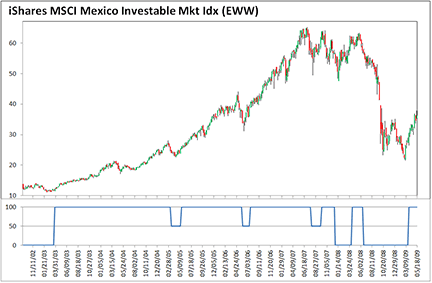
FIGURE 13: MICROSOFT EXCEL, HEIKIN-ASHI CANDLES OSCILLATOR LONG TERM (HACOLT). Here is Sylvain Vervoort’s HACOLT indicator implemented in Excel using a CandleSize setting of 1.1.
This spreadsheet file for Excel can be downloaded by clicking here.
—Ron McAllister
rpmac_xltt@sprynet.com
BACK TO LIST
Originally published in the July 2012 issue of
Technical Analysis of Stocks & Commodities magazine.
All rights reserved. © Copyright 2012, Technical Analysis, Inc.
Return to
Contents


