INDICATORS
HACO, Long Term
Since ETFs track indexes, thus averaging a large number of underlying instruments, price movements tend to be relatively small. This makes it difficult to profitably trade ETFs using daily charts. Here’s how you can overcome this drawback.
Various approaches can be found for technical analysis–based buy & sell signals, all of which are categorized into three methods. The first is the one I use in my book Capturing Profit With Technical Analysis, a method called LOCKIT. It uses all kinds of technical analysis techniques to come up with reliable buy & sell signals. This is not the easiest method because you need a broad knowledge of all the basic techniques and the know-how to apply them.
The second method applies artificial intelligence, feeding the data and technologies out of the first method into neural networks, automatically capturing price, volume, or any other pattern displayed by LOCKIT.
Then there’s the third method. This one trails price movement, basing your buying and selling on the idea that breaking a short- or medium-term up- or downtrend signals a trend reversal. Here, you have to find the most profitable balance between entering a trade quickly and avoiding false entries as much as possible, staying in as long as possible to let profits run. This is the method I apply in different trading expert systems. However, once there is a buy or sell signal, you should look for techniques from the first or second method to avoid nonprofitable trades.
Trading exchange traded funds
The third method can only be profitable if price moves are regular and large enough. Since exchange traded funds (ETFs) are tracking indexes that average a large number of underlying instruments, it is unusual to find larger moves with limited drawbacks on daily charts of ETFs. This makes it difficult to trade ETFs profitably with a trend-following system.

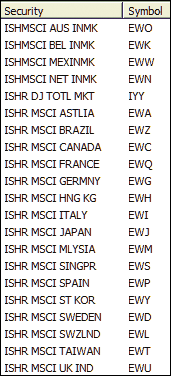
FIGURE 1: THE DATASET. Here you see the list of the 21 country ETFs that were backtested for this study.