TRADERS’ TIPS
October 2012
Here is this month’s selection of Traders’ Tips, contributed by
various developers of technical analysis software to help readers more easily
implement some of the strategies presented in this and other issues.
Other code appearing in articles in this issue is posted in the Subscriber
Area of our website at https://technical.traders.com/sub/sublogin.asp.
Login requires your last name and subscription number (from mailing label).
Once logged in, scroll down to beneath the “Optimized trading systems” area
until you see “Code from articles.” From there, code can be copied
and pasted into the appropriate technical analysis program so that no retyping
of code is required for subscribers.
You can copy these formulas and programs for easy use in your spreadsheet
or analysis software. Simply “select” the desired text
by highlighting as you would in any word processing program, then use your
standard key command for copy or choose “copy” from the browser
menu. The copied text can then be “pasted” into any open spreadsheet
or other software by selecting an insertion point and executing a paste command.
By toggling back and forth between an application window and the open web
page, data can be transferred with ease.

For this month’s Traders’ Tips, the focus is Gerald Gardner’s article in this issue, “A Seasonal Strategy With Leveraged ETFs.” Here we present the October 2012 Traders’ Tips code.
Code for AmiBroker is already provided in Gardner’s article, and subscribers will find this code in the Subscriber Area of our website, Traders.com. (Click on “Article Code” from our homepage.) Presented here is additional code and possible implementations for other software.

TRADESTATION: OCTOBER 2012 TRADERS’ TIPS CODE
In “A Seasonal Strategy With Leveraged ETFs” in this issue, author Gerald Gardner describes the seasonal strategy of buying in October and holding until May when the position is liquidated. Gardner illustrates the system by trading two relatively uncorrelated securities (DBC and DDM). The strategy enters a long position in October as long as the security is above its 50-day simple moving average. The position is then liquidated in May.
A Portfolio Maestro screenshot of the results is shown in Figure 1. In addition, Portfolio Maestro allows optimization of the average length used to filter entries, identification of correlations between symbols, and portfolio stops.
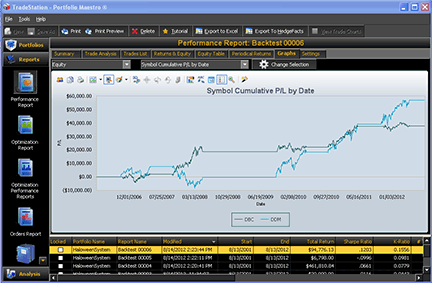
FIGURE 1: TRADESTATION, CUMULATIVE P/L, HALLOWEEN SYSTEM, PORTFOLIO MAESTRO TEST, 2006–2012. The portfolio consists of the PowerShares DB Commodity Index (DBC) and ProShares Ultra Dow30 (DDM). The Portfolio Maestro report summarizes the individual strategy performance reports available in TradeStation.
To download the EasyLanguage code for the indicator, first navigate to the EasyLanguage FAQs and Reference Posts Topic in the EasyLanguage support forum (https://www.tradestation.com/Discussions/Topic.aspx?Topic_ID=47452), scroll down, and click on the link labeled “Traders’ Tips, TASC.” Then select the appropriate link for the month and year (in this case, October 2012). The ELD filename is “_TASC_HalloweenStrat.ELD.”
_TASC_HalloweenStrat ( Strategy )

{ Reference:  Technical Analysis Of Stocks & Commodities, Oct 2012
  Article:  A Seasonal Strategy With Leveraged ETFs }

inputs:
  	SMALength( 50 ) ; { length for Simple Moving Average calculation }

variables:
  	SMA( 0 ) ; { Simple Moving Average }

SMA = Average( Close, SMALength ) ;

{ entry }
if Month( Date ) = 10 and Close > SMA and MarketPosition = 0 then
	Buy( "Halloween LE" ) next bar market ;

{ exit }
if Month( Date ) = 5 then { sell in May }
	Sell ("Halloween LX" ) next bar market ;
This article is for informational purposes. No type of trading or investment recommendation, advice, or strategy is being made, given, or in any manner provided by TradeStation Securities or its affiliates.
—Chris Imhof & Mark Mills
TradeStation Securities, Inc.
A subsidiary of TradeStation Group, Inc.
www.TradeStation.com
BACK TO LIST

eSIGNAL: OCTOBER 2012 TRADERS’ TIPS CODE
For this month’s Traders’ Tip, we’ve provided the formula HalloweenIndicator.efs, based on Gerald Gardner’s article in this issue, “A Seasonal Strategy With Leveraged ETFs.”
The formula contains parameters to set the buy and sell colors, which may be configured through the Edit Chart window. This indicator is also compatible with backtesting.
To discuss this study or download a complete copy of the formula code, please visit the EFS Library Discussion Board forum under the forums link from the support menu at www.esignal.com or visit our EFS KnowledgeBase at https://www.esignal.com/support/kb/efs/. The eSignal formula script (EFS) is available for copying and pasting below.
A sample chart is shown in Figure 2.
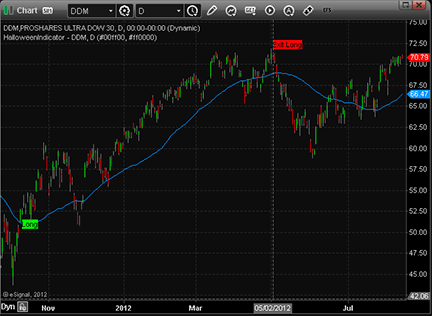
FIGURE 2: eSIGNAL
/*********************************
Provided By:
eSignal (Copyright c eSignal), a division of Interactive Data
Corporation. 2012. All rights reserved. This sample eSignal
Formula Script (EFS) is for educational purposes only and may be
modified and saved under a new file name.  eSignal is not responsible
for the functionality once modified.  eSignal reserves the right
to modify and overwrite this EFS file with each new release.

Description:
A Seasonal Strategy With Leveraged ETFs by Gerald Gardner


Version:            1.00  13/08/2012

Formula Parameters:                     Default:
Buy Color                               lime

Sell Color                              red

Notes:
The related article is copyrighted material. If you are not a subscriber
of Stocks & Commodities, please visit www.traders.com.

**********************************/

var fpArray = new Array();

function preMain()
{
    setStudyTitle("HalloweenIndicator");

    setPriceStudy(true);

    var x=0;

    fpArray[x] = new FunctionParameter("gBuyColor", FunctionParameter.COLOR);
    with(fpArray[x++])
    {
        setName("Buy Color");
        setDefault(Color.lime);
    }


    fpArray[x] = new FunctionParameter("gSellColor", FunctionParameter.COLOR);
    with(fpArray[x++])
    {
        setName("Sell Color");
        setDefault(Color.red);
    }
}


var bInit = false;
var bVersion = null;

var xClose = null;

var xSMA = null;

var xMonth = null;

function main(gBuyColor,gSellColor)
{
    if (bVersion == null) bVersion = verify();
    if (bVersion == false) return;

    if(!bInit)
    {
        xClose = close();

        xSMA = sma(50);

        xMonth = getMonth();


        bInit = true;
    }


    var vClose = xClose.getValue(0);

    var vSMA   = xSMA.getValue(0);

    var vMonth = xMonth.getValue(0);


    if ((vClose == null) || (vSMA == null) || (vMonth == null))

        return;


    // Back Testing formulas are not for real time analysis.
    // Therefore, prevent processing and exit at bar 0.
    if (getCurrentBarIndex() != 0)
    {

        var bLStrategy = Strategy.isLong();


        if (vMonth==10)

        {

            if ((vClose > vSMA) && (!bLStrategy))

            {

               Strategy.doLong("Enter Long", Strategy.MARKET, Strategy.NEXTBAR);

               drawTextRelative(1, BelowBar1, "Long", Color.black, gBuyColor, Text.PRESET, null, null);

            }

        }


        if ((vMonth==5) && (bLStrategy))

        {

            Strategy.doSell("Exit Long", Strategy.MARKET, Strategy.NEXTBAR);

            drawTextRelative(1, AboveBar1, "Exit Long", Color.black, gSellColor, Text.PRESET, null, null);

        }
    }


    return vSMA;
}

function verify() {
    var b = false;
    if (getBuildNumber() < 779) {
        drawTextAbsolute(5, 35, "This study requires version 8.0 or later.",
        Color.white, Color.blue, Text.RELATIVETOBOTTOM|Text.RELATIVETOLEFT|Text.BOLD|Text.LEFT,
        null, 13, "error");
        drawTextAbsolute(5, 20, "Click HERE to upgrade.@URL=https://www.esignal.com/download/default.asp",
        Color.white, Color.blue, Text.RELATIVETOBOTTOM|Text.RELATIVETOLEFT|Text.BOLD|Text.LEFT,
        null, 13, "upgrade");
        return b;
    } else {
        b = true;
    }
    return b;
}
—Jason Keck
eSignal, an Interactive Data company
800 779-6555, www.eSignal.com
BACK TO LIST

THINKORSWIM: OCTOBER 2012 TRADERS’ TIPS CODE
In “A Seasonal Strategy With Leveraged ETFs” in this issue, author Gerald Gardner has left out the tricks and simply gives us a treat. This seasonal indicator is based on the commonly known strategy of “sell in May and go away.” Gardner uses this principle combined with a 50-day moving average to display a strategy that opens up a long position anytime from October 1 through Halloween (October 31), when the price is greater than the 50-day moving average. The strategy closes the position on the first trading day of May.
In his article, Gardner uses the leveraged ETFs DDM and DBC to display the correlation between the stock equities and commodities. On the thinkorswim platform, you will be able to use this strategy on any chartable product. We have created a strategy for you in our proprietary scripting language, thinkScript. Once the strategy is added to the chart (see Figure 3), adjust your time frame to a five-year or three-year daily chart to see the historical results. Now that you can see the entry and exit points on the chart, you can right-click on the strategy and choose “Show report.”
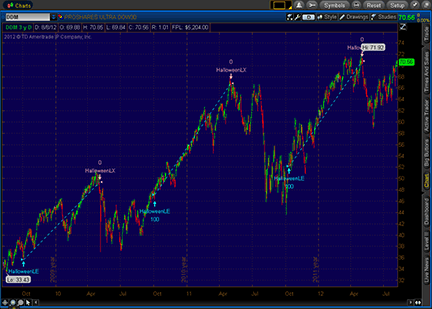
FIGURE 3: THINKORSWIM. Here is the indicator on the ProShares Ultra Dow30 ETF.
The strategy is as follows:
- From TOS charts, select “Studies” → “Edit studies”
- Select the “Strategies” tab in the upper left-hand corner
- Select “New” in the lower left-hand corner
- Name the oscillator study (such as, “halloweenSTRATEGY”)
- Click in the script editor window, remove “plot data = close,” and paste in the following code:
input price = close;
input length = 50;

AddOrder(OrderType.BUY_AUTO, GetMonth() == 10 and price > Average(price, length), tickColor = GetColor(1), arrowColor = GetColor(1), name = "HalloweenLE");
AddOrder(OrderType.SELL_TO_CLOSE, GetMonth() == 5, tickColor = GetColor(2), arrowColor = GetColor(2), name = "HalloweenLX");
—thinkorswim
A division of TD Ameritrade, Inc.
www.thinkorswim.com
BACK TO LIST

WEALTH-LAB: OCTOBER 2012 TRADERS’ TIPS CODE
In “A Seasonal Strategy With Leveraged ETFs” in this issue, author Gerald Gardner presents some legacy WealthScript code, so we will update it to WealthScript version 6 C# code here.
Not satisfied with testing on the short history of the leveraged ETFs (DBC and DDM) since 2006, we ran some 12-year (8/2000 to 8/2012) simulations on 10 sector ETFs (IXP, XLB, XLE, XLF, XLI, XLK, XLP, XLU, XLV, and XLY) using 10% of equity sizing on $100,000 starting capital, optimizing on the moving average period. While all periods produced solid returns, a smooth profit peak occurred when using a 30-bar period. With a maximum equity drawdown of only -14.7%, the annualized gain was 7.9%, equating to a $147,896 net profit, which includes $15,475 in dividends. Only the years 2002 and 2008 had negative returns of -1.0% and -2.4%, respectively. (See equity curve in Figure 4.)
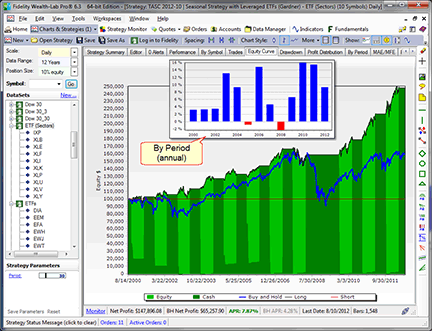
FIGURE 4: WEALTH-LAB. The buy & hold comparison emphasizes how the strategy ratchets up equity while evading multiple drawdown periods between May and October. (Inset: annual returns)
Wealth-Lab 6 Strategy Code (C#):
using System;
using System.Collections.Generic;
using System.Text;
using System.Drawing;
using WealthLab;
using WealthLab.Indicators;

namespace WealthLab.Strategies
{
   public class GardnerSeasonal : WealthScript
   {
      StrategyParameter _period;
      public GardnerSeasonal()
      {
         _period = CreateParameter("Period", 50, 10, 100, 5);
      }

      protected override void Execute()
      {
         DataSeries sma = SMA.Series(Close, _period.ValueInt);
         PlotSeries(PricePane, sma, Color.Blue, LineStyle.Solid, 2);

         for(int bar = GetTradingLoopStartBar(5); bar < Bars.Count; bar++)
         {
            if (IsLastPositionActive)
            {
               Position p = LastPosition;
               if (Date[bar].Month == 5)
                  SellAtMarket(bar + 1, p);
            }
            else
            {
               if (Date[bar].Month == 10 && Close[bar] > sma[bar] )
                  BuyAtMarket(bar + 1);
            }
         }
      }
   }
}
—Robert Sucher
www.wealth-lab.com
BACK TO LIST

METASTOCK: OCTOBER 2012 TRADERS’ TIPS CODE
Gerald Gardner’s article in this issue, “A Seasonal Strategy With Leveraged ETFs,” presents a calendar-based trading system called the Halloween indicator. The formulas and the steps to enter them in MetaStock are shown here.
To create a system test:
- Select Tools → Enhanced System Tester
- Click New
- Enter the name
- Select the Buy Order tab and enter the following formula:
C > Mov(C,50,S) AND Month() = 10
- Select the Sell Order tab and enter the following formula:
Month() = 5
- Click OK to close the system editor.
—William Golson
MetaStock Technical Support
Thomson Reuters
BACK TO LIST

AMIBROKER: OCTOBER 2012 TRADERS’ TIPS CODE
In “A Seasonal Strategy With Leveraged ETFs” in this issue, author Gerald Gardner presents a simple trading system based on the Halloween indicator.
A ready-to-use formula for the article follows. To backtest the system, enter the formula in the AFL Editor, then press “Backtest.” You may also want to limit the analysis to a watchlist consisting of just the DBC and DDM symbols using the “filter” setting in the analysis window.
SetPositionSize( 50, spsPercentOfEquity ); // 50% allocation size
SetOption("MaxOpenPositions", 2 ); // 2 positions max
SetTradeDelays( 1, 1, 1, 1 ); // trade next day

// buy in October if close is above 50-day moving average
Buy = Month() == 10 AND C > MA( C, 50 );
// sell in May and go away
Sell = Month() == 5;
A sample chart is shown in Figure 5.
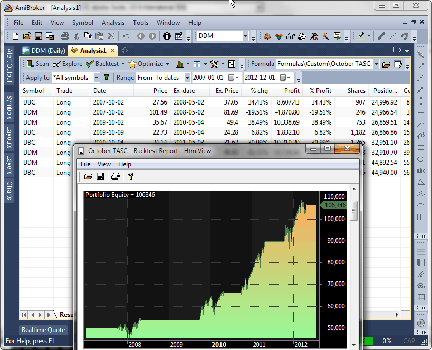
FIGURE 5: AMIBROKER. Here is the trade list and equity curve produced by a backtest of the Halloween indicator system on the DDM/DBC pair. Note that this chart uses unadjusted data, while the author used dividend-adjusted data. Tests performed on unadjusted data is closer to reality and results in slightly smaller profits than those presented in the article.
—Tomasz Janeczko, AmiBroker.com
www.amibroker.com
BACK TO LIST

NEUROSHELL TRADER: OCTOBER 2012 TRADERS’ TIPS CODE
A seasonal trading system as described by Gerald Gardner in “A Seasonal Strategy With Leveraged ETFs” in this issue can be easily implemented with a few of NeuroShell Trader’s 800+ indicators.
After loading a daily chart with the desired ETFs as different chart pages, you can recreate the trading system by selecting “New Trading Strategy” from the Insert menu. Enter the following in the appropriate locations of the Trading Strategy Wizard:
Generate a buy long market order if all of the following are true:

October Flag ( Date )
Price>Avg( Close, 50 )

Generate a sell long market order if all of the following are true:

May Flag ( Date )
If you have NeuroShell Trader Professional, you can also choose whether the moving average parameter should be optimized. After backtesting the trading strategy, use the “Detailed Analysis” button to view the backtest and trade-by-trade statistics for the strategy.
Users of NeuroShell Trader can go to the Stocks & Commodities section of the NeuroShell Trader free technical support website to download a copy of this or any past Traders’ Tips.
A sample chart is shown in Figure 6.
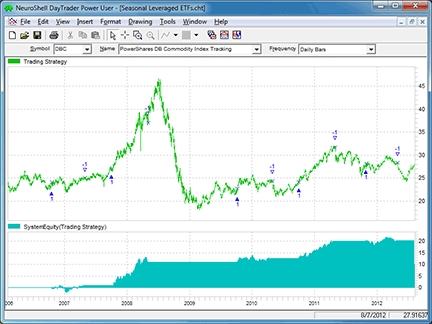
FIGURE 6: NEUROSHELL TRADER. This NeuroShell Trader chart displays the seasonal strategy applied to PowerShares DB Commodity Index Tracking (DBC).
—Marge Sherald, Ward Systems Group, Inc.
301 662-7950, sales@wardsystems.com
www.neuroshell.com
BACK TO LIST

AIQ: OCTOBER 2012 TRADERS’ TIPS CODE
The AIQ code and EDS file for Gerald Gardner’s article in this issue, “A Seasonal Strategy With Leveraged ETFs,” is provided at the following website: www.TradersEdgeSystems.com/traderstips.htm.
The code is as follows:
! SEASONAL STRATEGY WITH LEVERAGED ETFs
! Author: Gerald Gardner
! Coded by: Richard Denning 8/14/12
! www.TradersEdgeSystems.com

! ABBREVIATIONS:
C 	is [close].
C1 	is valresult(C,1).
O	is [open].
H 	is [high].
H1	is valresult(H,1).
L 	is [low].
L1	is valresult(L,1).
V	is [volume].
PEP	is {position entry price}.
PD	is {position days}.
OSD 	is offsettodate(month(),day(),year()).

! UDFs AND RULES FOR STRATEGY:
SMA50	is simpleavg(C,50).
OK_BUY  if (month() >= 1 and month() <= 4)
	or (month() >= 10 and month() <=12).
BUY	if OK_BUY and C > SMA50.
SELL	if month() = 5.
To test Gardner’s seasonal system with the leveraged exchanged traded funds (ETFs) DBC and DDM using AIQ’s Portfolio Manager, a trading simulation was run with the following capitalization and cost settings:
- Maximum of two open positions
- Size each position at 50 % of mark-to-market total capital
- Take no more than two new positions per day
- Compute the mark-to-market capital each day
- Three cents per share was deducted for each round turn trade.
In Figure 7, I show the resulting statistics and equity curve compared to the S&P 500 index (SPX). For the period 9/1/2006 to 8/13/2012, the system returned an average internal rate of return of 13.7% with a maximum drawdown of 32% on 3/5/2009. These statistics differ from the author’s due to my test starting earlier, and also, I picked up three trades that the author did not show in his list of trades with returns of -15.4%, -8.0%, and 1.0%. These differences may be due to differences in our data. In my test, there were only 12 trades and I would like to see more trades before I would rely on this as a trading strategy. This is the problem with testing systems on ETFs — there is not enough data.
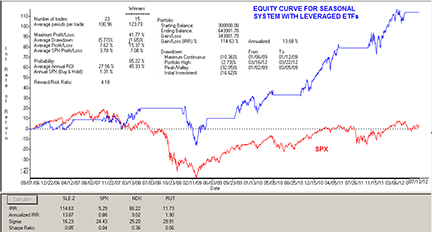
FIGURE 7: AIQ, EQUITY CURVE. Here is the equity curve for my test system that uses the seasonal system for the period 9/1/2006 to 8/13/2012. Only the ETFs DBC and DDM were traded on each signal.
—Richard Denning
info@TradersEdgeSystems.com
for AIQ Systems
BACK TO LIST

TRADERSSTUDIO: OCTOBER 2012 TRADERS’ TIPS CODE
The TradersStudio code based on Gerald Gardner’s article in this issue, “A Seasonal Strategy With Leveraged ETFs,” is provided at the following websites:
The following code file is provided in the download:
- System: “SEAS_LEV_ETF” (Gerald Gardner’s system for trading leveraged ETFs)
The code is also shown here:
' SEASONAL STRATEGY WITH LEVERAGED ETFs
' Author: Gerald Gardner
' Coded by: Richard Denning 8/14/12
' www.TradersEdgeSystems.com

Sub SEA_LEV_ETF(maLen)
Dim SMA As BarArray
Dim OK_BUY As BarArray

SMA = Average(C,maLen)
OK_BUY = IIF( (Month(Date) >= 10 And Month(Date) <= 12) Or (Month(Date) >= 1 And Month(Date) <=4),1,0)
If C > SMA And OK_BUY = 1 Then Buy("LE",1,0,Market,Day)
If OK_BUY = 0 Then ExitLong("LX","",1,0,Market,Day)

End Sub
Since the ETFs that were used by Gardner do not have enough history and only produce 12 trades using the entire data set that is available, I decided to try using two futures contracts in place of the ETFs. I first tried the CRB index contract (CR) and the Dow Jones index contract (DJ) together with a percent margin trade plan. This resulted in large drawdowns with a relatively small percent of margin used. I then tried the crude oil contract (CL) and the S&P 500 contract (SP) with the percent margin trade plan. I was able to use up to 30% margin with a maximum drawdown of 50%.
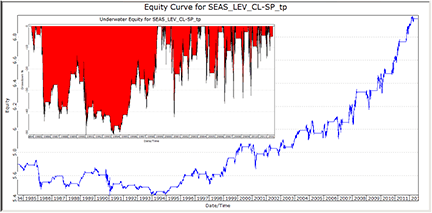
FIGURE 8: TRADERSSTUDIO, EQUITY CURVES. Here are the equity and underwater curves for the CL and SP contracts from 1984 to 2012.
The logarithmic equity curve and the underwater equity curve are shown in Figure 8. The period 1984 to 1994 resulted in a net loss and also had the large 50% drawdowns. The period from 1994 to 2012, on the other hand, appears quite good with much smaller drawdowns of between 30% to 35% and an accelerating rate of return into 2012. The return by year is shown in Figure 9. My test started with $500,000 of capital.
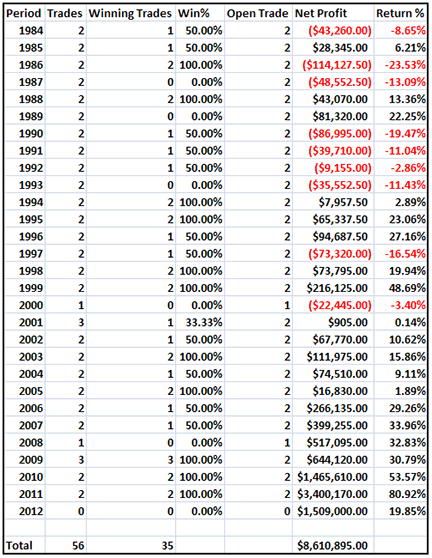
FIGURE 9: TRADERSSTUDIO, TABLE OF RETURNS. Here are returns by year for the CL and SP contracts from 1984 to 2012.
—Richard Denning
info@TradersEdgeSystems.com
for TradersStudio
BACK TO LIST

NINJATRADER: OCTOBER 2012 TRADERS’ TIPS CODE
We have implemented the Halloween strategy based on Gerald Gardner’s article in this issue, “A Seasonal Strategy With Leveraged ETFs.” This automated strategy is available for download at www.ninjatrader.com/SC/October2012SC.zip.
Once it has been downloaded, from within the NinjaTrader Control Center window, select the menu File → Utilities → Import NinjaScript and select the downloaded file. This file is for NinjaTrader version 7 or greater.
You can review the strategy source code by selecting the menu Tools → Edit NinjaScript → Strategy from within the NinjaTrader Control Center window and selecting “HalloweenStrategy.”
A sample chart implementing the strategy is shown in Figure 10.
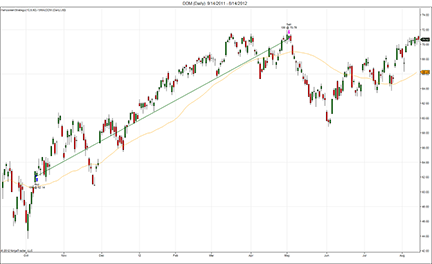
FIGURE 10: NINJATRADER. Here is the strategy applied to a daily chart of the exchange traded fund DDM.
—Raymond Deux and Ryan Millard
NinjaTrader, LLC
www.ninjatrader.com
BACK TO LIST

TRADESIGNAL: OCTOBER 2012 TRADERS’ TIPS CODE
The Halloween indicator described by Gerald Gardner in “A Seasonal Strategy With Leveraged ETFs” in this issue can easily be used with our online charting tool at www.trade-signalonline.com. Just check the Infopedia section for our lexicon. You will see the indicator and the functions, which you can make available for your personal account. Click on it and select “Open script.” You can then apply the indicator to any chart you wish. (See Figure 11.)
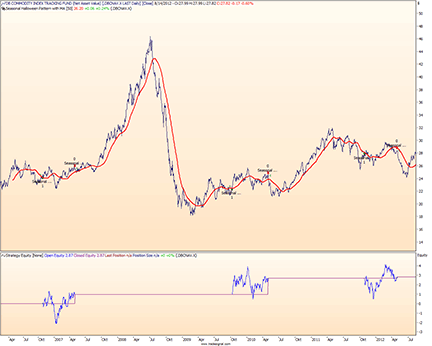
FIGURE 11: TRADESIGNAL ONLINE. Here is a sample TradeSignal Online chart with the seasonal Halloween strategy on a daily chart of the PowerShares DB Commodity Index Tracking Fund (DBC).
Source code for seasonal Halloween pattern with MA.eqs

Meta:
	Weblink("https://www.tradesignalonline.com/lexicon/edit.aspx?id=18700"),
	Synopsis("A Seasonal Strategy with the Helloween Indicator. TAS&C 10/2012"),
	Subchart( False );

Inputs:
	SMA_Period( 50 , 1 );

If Month( Date ) = 10 And Close Crosses Over Average( Close, SMA_Period ) Then
	Buy This Bar on CLose;

If Month( Date ) = 5 Then
	Sell This Bar on Close;

DrawLine( Average( Close, SMA_Period ), "SMA", StyleSolid, 2, Red );

// *** Copyright tradesignal GmbH ***
// *** www.tradesignal.com ***
—Henning Blumenthal, Tradesignal GmbH
support@tradesignalonline.com
www.TradesignalOnline.com, www.Tradesignal.com
BACK TO LIST

UPDATA: OCTOBER 2012 TRADERS’ TIPS CODE
Our Traders’ Tip for this month is based on “A Seasonal Strategy With Leveraged ETFs” in this issue. In the article, author Gerald Gardner proposes an anomaly in market cycles that has persisted in the US equity market for a number of decades. The strategy based on this pattern calls for stocks to be purchased on (or the first trading day after) October 1 of the year and held until May 1 (or the first trading day after), at which time they are sold.
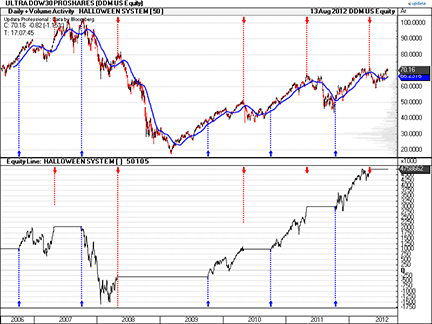
FIGURE 12: UPDATA. Here is a sample Updata chart with the seasonal Halloween strategy on a daily chart of the ProShares ETF UltraPro Dow30.
The Updata code for this strategy has been placed in the Updata Library and may be downloaded by clicking the Custom menu and System Library. Those who cannot access the library due to a firewall may paste the code shown here into the Updata Custom editor and save it.
PARAMETER "Avg Period" #PERIOD=50
PARAMETER "Buy Month" #BUYMONTH=10
PARAMETER "Sell Month" #SELLMONTH=5
@AVG=0
NAME "HALLOWEEN SYSTEM [" #PERIOD "]" ""
INDICATORTYPE TOOL
PLOTSTYLE THICK2 RGB(0,0,255)
FOR #CURDATE=#PERIOD TO #LASTDATE
   @AVG=MAVE(#PERIOD)
   'ENTRY & EXIT
   IF #CURMONTH=#BUYMONTH AND #CURDAY>=1 AND CLOSE>@AVG
      BUY OPEN
   ENDIF
   IF #CURMONTH=#SELLMONTH AND #CURDAY>=1 AND ORDERISOPEN=1
      SELL OPEN
   ENDIF
   @PLOT=@AVG
NEXT
—Updata support team
support@updata.co.uk
www.updata.co.uk
BACK TO LIST

TRADE NAVIGATOR: OCTOBER 2012 TRADERS’ TIPS CODE
We can recreate and test the strategy described by Gerald Gardner in “A Seasonal Strategy With Leveraged ETFs” in this issue for Trade Navigator.
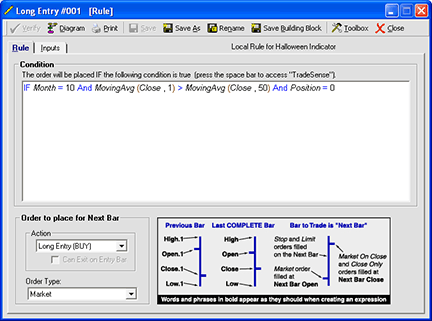
To set up the strategy, go to the strategies tab in the Trader’s Toolbox. Click on the New button. Click the New Rule button. To create the long entry rule, input the following code:
IF Month = 10 And MovingAvg (Close , 1) > MovingAvg (Close , 50) And Position = 0
Set the action to “long entry (buy)” and the order type to “market.” Click on the save button. Type a name for the rule and then click the OK button.
Repeat these steps for the long exit rule using the following code:
IF Month = 5 And Position > 0
Set the action to “long exit (sell)” and the order type to “market.”
Be sure to set the option to “allow entries to reverse” on the settings tab on the strategy screen.
Save the strategy by clicking the save button, typing a name for the strategy, and then clicking the OK button.
You can test the new strategy by clicking the run button to see a report, or you can apply the strategy to a chart for a visual representation of where the strategy would place trades over the history of the chart.
Genesis Financial Technologies is providing this strategy as a special downloadable file for Trade Navigator. Click on the blue phone icon in Trade Navigator, select “Download special file,” type “SC201210,” and click on the start button.
—Michael Herman
Genesis Financial Technologies
www.TradeNavigator.com
BACK TO LIST
MICROSOFT EXCEL: OCTOBER 2012 TRADERS’ TIPS CODE
The Halloween indicator presented in Gerald Gardner’s article in this issue, “A Seasonal Strategy With Leveraged ETFs,” is an interesting example of how it’s possible to exploit the effects of seasonality in the marketplace.
The Excel example presented here tracks Gardner’s examples well; it finds the same buy and sell signals and trades at the prices documented in Figure 3 of the article.
However, the overall financial results do not quite match up with Gardner’s example, as we did not have access to the Wealth-Lab automatic position-sizing settings and trade commission settings used in Gardner’s model. As an approximation for these missing bits, I have provided a “max percent at risk” control setting, which the user may adjust to influence position size in this model.
Another simplification we used is that each index is treated as a separately traded account — no comingling of funds. Each starts with $25,000 and trades are simulated per the indicator. A sample equity curve for the system is shown in Figure 13.
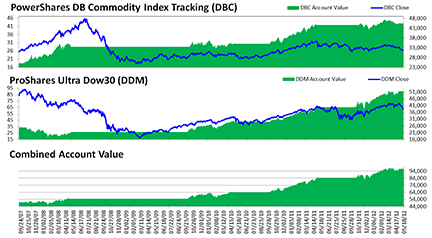
FIGURE 13: EXCEL, EQUITY CURVE. Here’s a sample equity curve for the seasonal system discussed in Gerald Gardner’s article.
The spreadsheet file we created for this Traders’ Tip can be downloaded here: Seasonal Leveraged ETF Strategy.xlsm.
—Ron McAllister
Excel and VBA programmer
rpmac_xltt@sprynet.com
BACK TO LIST

TRADINGSOLUTIONS: OCTOBER 2012 TRADERS’ TIPS CODE
In “A Seasonal Strategy With Leveraged ETFs” in this issue, author Gerald Gardner presents a simple seasonal strategy for trading ETFs.
TradingSolutions code for the system is shown here and is also available as a function file that can be downloaded from the TradingSolutions website (www.tradingsolutions.com) in the Free Systems section. As with many indicators, this system or its inputs could make good inputs to neural network predictions.
System: Halloween System
Inputs: Close

Enter Long
	1.	EQ (Month( ), 10)
	2.	GT (Close, MA (Close, 50))

Exit Long
	1.	EQ (Month( ), 5)
—Gary Geniesse
NeuroDimension, Inc.
800 634-3327, 352 377-5144
www.tradingsolutions.com
BACK TO LIST
Originally published in the October 2012 issue of
Technical Analysis of Stocks & Commodities magazine.
All rights reserved. © Copyright 2012, Technical Analysis, Inc.
Return to
Contents


