TRADING SYSTEMS
The Volatility Index As A Forecasting Tool
Finding a trading system that beats the buy & hold method is a good find, especially in a volatile market. Here is a trading system that uses the volatility index as a forecasting tool and outperforms the buy & hold approach.
Can the volatility index (VIX) be used to predict the future of the Standard & Poor’s 500? New ideas have arisen in academic literature that suggest that combining technical analysis with the VIX can result in a predictive model that will beat the buy & hold of the S&P 500. James Kozyra and Camillo Lento tested nine trading rules and found that eight of the nine produced positive results.
The VIX is often referred to as the fear index or fear gauge. It represents the implied volatility in the stock market for the next 30 days. The VIX is calculated in real time by the Chicago Board Options Exchange (CBOE) and is a weighted blend of option prices for the S&P 500. The formula that calculates the index takes current market prices for all out-of-the-money options for the first and second nearest months.
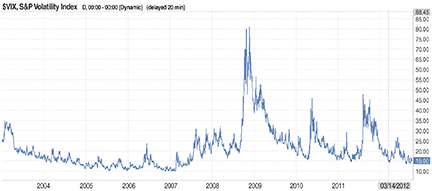
Figure 1 shows the VIX from 2003 to October 2012. Note how it is mostly flat to down and is punctuated with violent spikes. The spikes in the data occur during times when the S&P 500 is selling off. Thus, it is safe to say that the VIX is negatively correlated with the S&P 500.

FIGURE 1: THE VOLATILITY INDEX (VIX) FROM 2003 TO OCTOBER 2012. Note how it is mostly flat to down and is punctuated with violent spikes. The spikes in the data occur during times when the S&P 500 is selling off.
Using the VIX to forecast
The most robust trading rule is a simple 50-day moving average crossover of the VIX. It was able to produce 12.7% annual returns over the period from January 1999 through July 2009. These performances exceed the buy & hold approach by 12.49%, leading them to conclude that the VIX can predict the S&P 500. For the period, buy & hold yielded a total of 2.28% or an annualized yield of just 0.21%.
The study, however, needs work to turn it into a trading system for the retail investor; most notably, the study goes long and short, based on whether the VIX is above its 50-day moving average. In addition, trading costs are not included in the study. After running the numbers through a simulation, I concluded that moving average whipsaws must be reduced and commission accounted for in profit calculations. I did not include short sales as part of the new system.