TRADERS’ TIPS
December 2012
Here is this month’s selection of Traders’ Tips, contributed by
various developers of technical analysis software to help readers more easily
implement some of the strategies presented in this and other issues.
Other code appearing in articles in this issue is posted in the Subscriber
Area of our website at https://technical.traders.com/sub/sublogin.asp.
Login requires your last name and subscription number (from mailing label).
Once logged in, scroll down to beneath the “Optimized trading systems” area
until you see “Code from articles.” From there, code can be copied
and pasted into the appropriate technical analysis program so that no retyping
of code is required for subscribers.
You can copy these formulas and programs for easy use in your spreadsheet
or analysis software. Simply “select” the desired text
by highlighting as you would in any word processing program, then use your
standard key command for copy or choose “copy” from the browser
menu. The copied text can then be “pasted” into any open spreadsheet
or other software by selecting an insertion point and executing a paste command.
By toggling back and forth between an application window and the open web
page, data can be transferred with ease.
For this month’s Traders’ Tips, the focus is Trent Gardner’s article in this issue, “Using VIX To Forecast The S&P 500.” Here we present the December 2012 Traders’ Tips code.
Code for Wealth-Lab is already provided in Gardner’s article by the author. Subscribers will find this code in the Subscriber Area of our website, Traders.com. (Click on “Article Code” from our homepage.) Presented here is additional code and possible implementations for other software.

TRADESTATION: DECEMBER 2012 TRADERS’ TIPS CODE
In “Using VIX To Forecast The S&P 500” in this issue, author Trent Gardner describes the use of the VIX (volatility index) to forecast movement of the S&P 500. The VIX is compared to its 50-day simple moving average, and the number of consecutive days above or below the moving average is tracked. When the number of consecutive days reaches 11, a buy or sell is generated based on whether the VIX is above or below its moving average.
In his article, Gardner describes trading the exchange traded funds (ETFs) SPY and DDM and the rules for entry and exit. We are providing a strategy that illustrates the use of the VIX in Data2 as the trigger for a buy or sell of the symbol in Data1 — SPY or DDM, in this case. The moving average length and number of consecutive bars are coded as inputs and can be optimized using TradeStation’s backtest engine.
To download the EasyLanguage code for the strategy, first navigate to the EasyLanguage FAQs and Reference Posts Topic in the EasyLanguage Support Forum (https://www.tradestation.com/Discussions/Topic.aspx?Topic_ID=47452), scroll down, and click on the link labeled “Traders’ Tips, TASC.” Then select the appropriate link for the month and year. The ELD filename is “_TASC_VIX_Timing.ELD.”
The EasyLanguage code for this strategy is shown here. A sample chart implementing the strategy code is shown in Figure 1.
_TASC_VIX_Timing ( Strategy )

{ TASC Article, December, 2012 }
{ Using VIX to Forecast The S&P 500 }
{ Trent Gardner }

inputs:
	MALength( 50 ), { length for SMA of VIX }
	NumConsecBars( 11 ) ; { number of consecutive bars
	 above or below VIX SMA to trigger a sell or buy }

variables:
	MA_VIX( 0, Data2 ),
	ConsecAboveMA( 0 ),
	ConsecBelowMA( 0 ) ;

{ Calculate VIX Simple Moving Average }
MA_VIX = Average( Close Data2, MALength ) of Data2 ;

if Close of Data2 > MA_VIX then
	begin
	ConsecAboveMA = ConsecAboveMA + 1 ;
	ConsecBelowMA = 0 ;
	end
else if Close of Data2 < MA_VIX then
	begin
	ConsecAboveMA = 0 ;
	ConsecBelowMA = ConsecBelowMA + 1 ;
	end
else { Close Data2 = MA_VIX }
	begin
	ConsecAboveMA = 0 ;
	ConsecBelowMA = 0 ;
	end ;

{ Buy }
if ConsecBelowMA[1] = NumConsecBars then
	Buy ( "VIX Timing LE" ) next bar at market ;

{ Sell }
if ConsecAboveMA[1] = NumConsecBars then
	Sell ( "VIX Timing LX" ) next bar at market ;
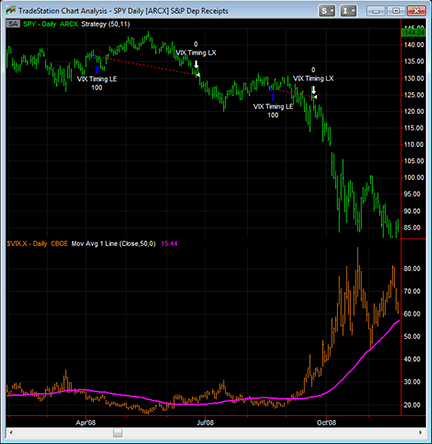
FIGURE 1: TRADESTATION. This daily bar chart of SPY (an ETF based on the S&P 500) and $VIX.X (VIX index in Data2) demonstrates the strategy code applied to a chart. The magenta line on $VIX.X is the 50-bar simple moving average.
This article is for informational purposes. No type of trading or investment recommendation, advice, or strategy is being made, given, or in any manner provided by TradeStation Securities or its affiliates.
—Chris Imhof
TradeStation Securities, Inc.
A subsidiary of TradeStation Group, Inc.
www.TradeStation.com
BACK TO LIST

METASTOCK: DECEMBER 2012 TRADERS’ TIPS CODE
Trent Gardner’s article in this issue, “Using VIX To Forecast The S&P 500,” describes a system to trade the SPY and DDM stock ETFs using the VIX.
The formulas for the VIX timing system and the steps to enter them in MetaStock are shown here. The formulas assume Reuters Datalink ticker symbols and online data. If you are using a different data vendor, the first line of each formula will need to be changed to the symbol that your data provider uses.
To set up the system test:
- Select Tools → Enhanced System Tester
- Click “New”
- Enter the name
- Select the “Buy order” tab and enter the following formula:
s1:= Security("Online:.VIX", C);
Ref(Sum(s1<Mov(s1,50,S), 11),-1) = 11
- Select the “Sell order” tab and enter the following formula:
s1:= Security("Online:.VIX", C);
Ref(Sum(s1>Mov(s1,50,S), 11),-1) = 11
- Click OK to close the system editor.
If you wish to include short trades in the system, copy the sell order to the sell-short tab and copy the buy order to the buy-to-cover tab.
—William Golson
MetaStock Technical Support
Thomson Reuters
BACK TO LIST

eSIGNAL: DECEMBER 2012 TRADERS’ TIPS CODE
For this month’s Traders’ Tip, we’ve provided the formula VIX_TimingSystem.efs based on Trent Gardner’s article in this issue, “Using VIX To Forecast The S&P 500.”
The study contains formula parameters to set the colors of the long and short signals, SMA periods, and the day limit, which may be configured through the Edit Chart window.
To discuss this study or download a complete copy of the formula code, please visit the EFS Library Discussion Board forum under the Forums link from the support menu at www.esignal.com or visit our EFS KnowledgeBase at https://www.esignal.com/support/kb/efs/. The eSignal formula scripts (EFS) are also available for copying and pasting below and can be downloaded here.
/*********************************
Provided By:
eSignal (Copyright c eSignal), a division of Interactive Data
Corporation. 2012. All rights reserved. This sample eSignal
Formula Script (EFS) is for educational purposes only and may be
modified and saved under a new file name.  eSignal is not responsible
for the functionality once modified.  eSignal reserves the right
to modify and overwrite this EFS file with each new release.

Description:
Using VIX To Forecast The S&P 500 by Trent Gardner

Version:            1.00  12/10/2012

Formula Parameters:                     Default:
Long Position Color                     lime
Short Position Color                    red

SMA Period                              50

Days Limit                              11

Notes:
The related article is copyrighted material. If you are not a subscriber
of Stocks & Commodities, please visit www.traders.com.

**********************************/

var fpArray = new Array();

function preMain()
{
    setStudyTitle("VIX_TimingSystem");

    setIntervalsBackfill(true);
    setPriceStudy(true);

    var x=0;

    fpArray[x] = new FunctionParameter("gBuyColor", FunctionParameter.COLOR);
    with(fpArray[x++])
    {
        setName("Long Position Color");
        setDefault(Color.lime);
    }

    fpArray[x] = new FunctionParameter("gSellColor", FunctionParameter.COLOR);
    with(fpArray[x++])
    {
        setName("Short Position Color");
        setDefault(Color.red);
    }


    fpArray[x] = new FunctionParameter("gSMAPeriod", FunctionParameter.NUMBER);
    with(fpArray[x++])
    {
        setName("SMA Period");

        setLowerLimit(1);
        setDefault(50);
    }


    fpArray[x] = new FunctionParameter("gDaysLimit", FunctionParameter.NUMBER);
    with(fpArray[x++])
    {
        setName("Days Limit");

        setLowerLimit(1);
        setDefault(11);
    }
}

var bInit = false;
var bVersion = null;

var xLow = null;
var xSMA = null;

var xSMA50 = null;


function main(gBuyColor,gSellColor,gSMAPeriod,gDaysLimit)
{
    if (bVersion == null) bVersion = verify();
    if (bVersion == false) return;

    if(!bInit)
    {
        xLow = low(sym("$VIX"));
        xSMA = sma(gSMAPeriod,xLow);


        xSMA50 = sma(gSMAPeriod);

        bInit = true;
    }

    var vLow   = xLow.getValue(-gDaysLimit);
    var vSMA   = xSMA.getValue(-gDaysLimit);

    var vSMA50 = xSMA50.getValue(-gDaysLimit);


    if ((vLow == null) || (vSMA == null) || (vSMA50 == null))
        return;


    var cntUp = 0;

    var cntDown = 0;


    for (i=-gDaysLimit; i<0; i++)

    {

        if (xLow.getValue(i)>xSMA.getValue(i)) cntUp++;

        if (xLow.getValue(i)<xSMA.getValue(i)) cntDown++;

    }


    // Back Testing formulas are not for real time analysis.
    // Therefore, prevent processing and exit at bar 0.

    if (getCurrentBarIndex() != 0)
    {
            var bLStrategy = Strategy.isLong();


            if (!bLStrategy)
            {

                if (cntDown>=gDaysLimit)

                {
                   Strategy.doLong("Enter Long", Strategy.MARKET, Strategy.THISBAR);
                   drawTextRelative(0, BelowBar1, "Long", Color.black, gBuyColor, Text.PRESET, null, null);

                }
            }
            else
            {

                if (cntUp>=gDaysLimit)

                {
                    Strategy.doShort("Enter Short", Strategy.MARKET, Strategy.THISBAR);
                    drawTextRelative(0, AboveBar1, "Short", Color.black, gSellColor, Text.PRESET, null, null);

                }
            }

    }


    return xSMA50.getValue(0);
}


function verify() {
    var b = false;
    if (getBuildNumber() < 779) {
        drawTextAbsolute(5, 35, "This study requires version 8.0 or later.",
        Color.white, Color.blue, Text.RELATIVETOBOTTOM|Text.RELATIVETOLEFT|Text.BOLD|Text.LEFT,
        null, 13, "error");
        drawTextAbsolute(5, 20, "Click HERE to upgrade.@URL=https://www.esignal.com/download/default.asp",
        Color.white, Color.blue, Text.RELATIVETOBOTTOM|Text.RELATIVETOLEFT|Text.BOLD|Text.LEFT,
        null, 13, "upgrade");
        return b;
    } else {
        b = true;
    }
    return b;
}
A sample chart is shown in Figure 2.
FIGURE 2: eSIGNAL
—Jason Keck
eSignal, an Interactive Data company
800 779-6555, www.eSignal.com
BACK TO LIST

THINKORSWIM: DECEMBER 2012 TRADERS’ TIPS CODE
In “Using VIX To Forecast The S&P 500” in this issue, author Trent Gardner discusses how the VIX index is calculated and how this index can be utilized. He uses a moving average of the VIX to determine entry and exit points of broad-based indexes like the S&P 500 and the Dow Jones Industrial Average. This strategy is put into practice by using ETFs that are designed to trace those indexes, but the strategy can also be displayed on any symbol using thinkorswim charts (Figure 3).
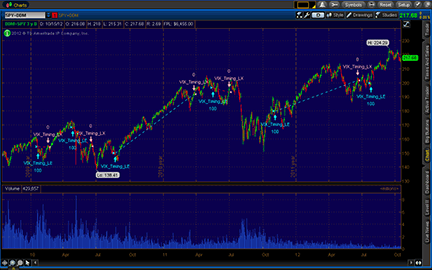
FIGURE 3: THINKORSWIM
For thinkorswim users, we have created a strategy for you in our proprietary scripting language, thinkScript. Once the strategy has been added to your chart, you can right-click on the name of the strategy on the price graph and choose “Show report.” This will allow you to see how the strategy has performed over the charted time frame. Adjust the parameters of the strategy within the Edit Studies window to fine-tune your entry and exit points.
The strategy:
- From TOS charts, select Studies → Edit studies
- Select the “Strategies” tab in the upper left-hand corner
- Select “New” in the lower left-hand corner
- Name the oscillator study (such as “Vix_Timing”)
- Click in the script editor window, remove “plot data = close,” and paste in the following:
input smaLength = 50;
input trendLength = 11;

def closeVix = close("VIX");
def smaVix = Average(closeVix, smaLength);

AddOrder(OrderType.BUY_AUTO,
    Sum(closeVix < smaVix, trendLength)[1] == trendLength and
        closeVix > smaVix,
    tickcolor = GetColor(1),
    arrowcolor = GetColor(1),
    name = "VIX_Timing_LE");
AddOrder(OrderType.SELL_TO_CLOSE,
    Sum(closeVix > smaVix, trendLength)[1] == trendLength and
        closeVix < smaVix,
    tickcolor = GetColor(2),
    arrowcolor = GetColor(2),
    name = "VIX_Timing_LX");
—thinkorswim
A division of TD Ameritrade, Inc.
www.thinkorswim.com
BACK TO LIST

AMIBROKER: DECEMBER 2012 TRADERS’ TIPS CODE
In “Using VIX To Forecast The S&P 500,” author Trent Gardner presents a simple trading system based on the volatility index (VIX) and its 50-day moving average.
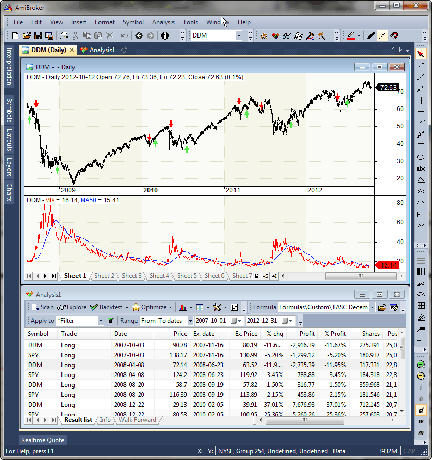
FIGURE 4: AMIBROKER. Here is a daily chart of DDM (upper chart pane) with VIX and its 50-day moving average (lower chart pane) plus a list of trades based on the VIX trading system (bottom window).
A ready-to-use formula based on the article is presented here. To display the VIX and its 50-day moving average on a chart (Figure 4), simply input the formula in the formula editor and press “Apply indicator.” To perform a historical backtest of the system, use the “Send to analysis window” button in the formula editor. In the analysis window you can adjust the start and end dates as well as the other backtest settings.
LISTING 1.
function ComeDown( series )
{
  IsDown = series < MA( series, 50 );
  return Ref( Sum( IsDown , 11 ), -1 );
}

function ComeUp( series )
{
  IsAbove = series > MA( series, 50 );
  return Ref( Sum( IsAbove , 11 ), -1 );
}

series = Foreign("∧VIX", "C" );

Plot( series, "VIX", colorRed );
Plot( MA( series, 50 ), "MA50", colorBlue );

Buy = ComeDown( series ) > 10;
Sell = ComeUp( series ) > 10;

SetPositionSize( 50, spsPercentOfEquity );
—Tomasz Janeczko, AmiBroker.com
www.amibroker.com
BACK TO LIST

WEALTH-LAB: DECEMBER 2012 TRADERS’ TIPS CODE
This Traders’ Tip is based on “Using VIX To Forecast The S&P 500” by Trent Gardner in this issue.
Counting how many times a DataSeries was above/below another DataSeries (for example, a moving average) can be performed using the SeriesIsAbove/SeriesIsBelow indicators available in our Community Indicators library. Considering this, when building Wealth-Lab 6 code for this month’s trading strategy, we decided to concentrate on the pure charting side of things. Situations when the VIX’s low price was staying above or below its moving average for 11 trading sessions straight are highlighted in bluish and reddish color (Figure 5).
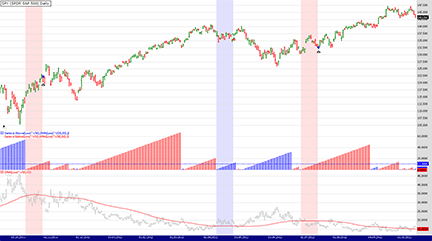
FIGURE 5: WEALTH-LAB, SPY WITH VIX OVERLAY. Here is a daily chart of SPY with a VIX overlay illustrating Trent Gardner’s approach described in his article in this issue.
This additional library is available for download to Wealth-Lab customers from our site at www.wealth-lab.com (in the Extensions section). To avoid copy/paste, we suggest that Wealth-Lab users download the code for the trading strategy by clicking the download button in Wealth-Lab’s “Open strategy” dialog (Figure 6).
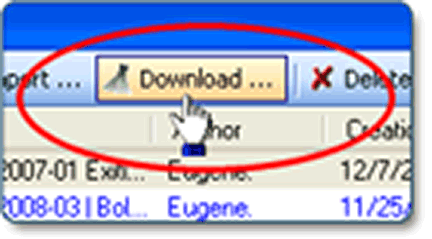
FIGURE 6: WEALTH-LAB, “OPEN STRATEGY” DIALOG. Use the download button to download trading strategies in Wealth-Lab 6.
C# Code:

using System;
using System.Collections.Generic;
using System.Text;
using System.Drawing;
using WealthLab;
using WealthLab.Indicators;
using Community.Indicators;

namespace WealthLab.Strategies
{
	public class Gardner12_2012 : WealthScript
	{
		protected override void Execute()
		{
			Bars vix = GetExternalSymbol( "∧VIX", true );
			SMA vixSma = SMA.Series( vix.Low, 50 );
			SeriesIsAbove sa = SeriesIsAbove.Series( vix.Low, vixSma, 1);
			SeriesIsBelow sb = SeriesIsBelow.Series( vix.Low, vixSma, 1);

			for (int bar = GetTradingLoopStartBar(vixSma.FirstValidValue); bar < Bars.Count; bar++)
			{
				if (IsLastPositionActive)
				{
					if( sa[bar] >= 11 ) {
						for( int i = bar; i > bar-11; i-- )
							SetBackgroundColor( i, Color.FromArgb( 30, Color.Blue ) );
						SellAtMarket( bar+1, LastPosition );
					}
				}
				else
				{
					if( sb[bar] >= 11 ) {
						for( int i = bar; i > bar-11; i-- )
							SetBackgroundColor( i, Color.FromArgb( 30, Color.Red ) );
						BuyAtMarket( bar+1 );
					}
				}
			}

			HideVolume();
			ChartPane psb = CreatePane( 30, false, true );
			ChartPane vixPane = CreatePane( 50, false, true);
			PlotSymbol( vixPane, vix, Color.Silver, Color.Silver);
			PlotSeries( vixPane, vixSma, Color.Red, LineStyle.Solid, 1 );
			PlotSeries( psb, sa, Color.Blue, LineStyle.Histogram, 2 );
			PlotSeries( psb, sb, Color.Red, LineStyle.Histogram, 2 );
			DrawHorzLine( psb, 11, Color.Blue, LineStyle.Dashed, 1 );
		}
	}
}
—Wealth-Lab team
MS123, LLC
www.wealth-lab.com
BACK TO LIST

NEUROSHELL TRADER: DECEMBER 2012 TRADERS’ TIPS CODE
The VIX-based timing system described by author Trent Gardner in his article in this issue, “Using VIX To Forecast The S&P 500,” can be easily implemented with a few of NeuroShell Trader’s 800+ indicators. After loading a daily chart with SPY and DDM as different chart pages, insert the VIX data series using “Other instrument data” from the Insert menu. Select “New trading strategy” from the Insert menu and enter the following in the appropriate locations of the Trading Strategy Wizard:
Generate a buy-long market order if all of the following are true:
A=B( Lag( Sum( A<B( VIX Low, MovAvg( VIX Low, 50) ) ) ) )
Generate a sell-long market order if all of the following are true:
A=B( Lag( Sum( A>B( VIX Low, MovAvg( VIX Low, 50) ) ) ) )
If you have NeuroShell Trader Professional, you can also choose whether the moving average and summation window size parameters should be optimized. After backtesting the trading strategy, use the “Detailed Analysis” button to view the backtest and trade-by-trade statistics for the strategy.
Users of NeuroShell Trader can go to the Stocks & Commodities section of the NeuroShell Trader free technical support website to download a copy of this or any previous Traders’ Tips.
A sample chart is shown in Figure 7.
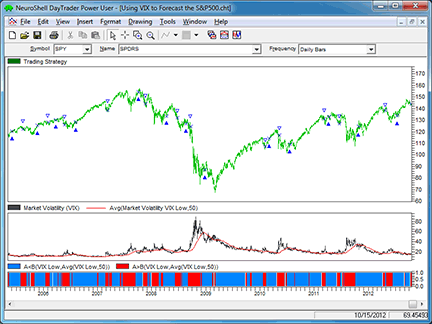
FIGURE 7: NEUROSHELL TRADER. This NeuroShell Trader chart displays the VIX-based timing strategy applied to SPY.
—Marge Sherald, Ward Systems Group, Inc.
301 662-7950, sales@wardsystems.com
www.neuroshell.com
BACK TO LIST

AIQ: DECEMBER 2012 TRADERS’ TIPS
CODE
The AIQ code based on Trent Gardner’s article in this issue, “Using VIX To Forecast The S&P 500,” is provided at the following website: www.TradersEdgeSystems.com/traderstips.htm and is shown below.
To test Gardner’s VIX timing system, I used the NASDAQ 100 list of stocks and AIQ’s Portfolio Manager. A long-only trading simulation was run with the following capitalization, cost, and exit settings:
- Maximum of 10 open positions
- Size each position at 10 % of mark-to-market total capital
- Take no more than 10 new positions per day
- Compute the mark-to-market capital each day
- Three cents per share was deducted for each round-turn trade
- Select trades based on the highest 28-bar RSI reading
- Exit trades only with a system exit — use no loss stop or profit target stop
In Figure 8, I show the resulting statistics and long-only equity curve compared to the S&P 500. For the period 4/1/1993 to 10/16/2012, the system returned an average internal rate of return of 22.9% with a maximum drawdown of 19.5% on 10/27/1997.
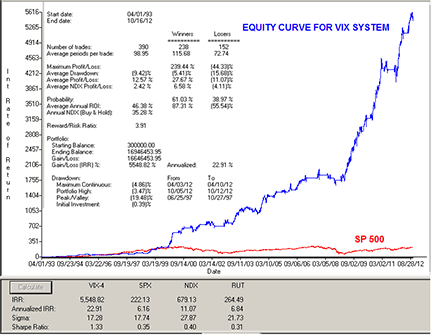
FIGURE 8: AIQ. Here is a sample long-only equity curve compared to the S&P 500 for the test period 4/1/1993 to 10/16/2012 trading the NASDAQ 100 list of stocks.
The code and EDS file can be downloaded from www.TradersEdgeSystems.com/traderstips.htm.
!USING VIX TO FORECAST THE S&P 500
!Author: Trent Gardner
!Coded by: Richard Denning 10/15/12
!www.TradersEdgeSystems.com

!INPUTS:
maLen is 50.
count is 11.

!UDFs USED BY SYSTEMS:
C is [close].
L is [low].
Vidx is "VIX".
VIXlow is TickerUDF(vidx,L).
VIXma is simpleAvg(VIXlow,maLen).
VIXabove is countof(VIXlow > VIXma,count,0).
VIXbelow is countof(VIXlow < VIXma,count,0).

HD if hasdatafor(maLen+10)>= maLen.
HDvIdx if TickerRule(Vidx,HD).

!AUTHORS SYSTEM:
Buy if VIXbelow = count and HD and HDvIdx.
ExitBuy if VIXabove = count.

!TRADE RANKER FOR CHOOSING WHICH TRADES TO TAKE:
!RSI WILDER
!To convert Wilder Averaging to Exponential Averaging use this formula:
!ExponentialPeriods = 2 * WilderPeriod - 1.

U 	is [close]-val([close],1).
D 	is val([close],1)-[close].

W1	is 3.
rsiLen1	is 2 * W1 - 1.
AvgU 	is ExpAvg(iff(U>0,U,0),rsiLen1).
AvgD 	is ExpAvg(iff(D>=0,D,0),rsiLen1).
rsi3o 	is 100-(100/(1+(AvgU/AvgD))).

W2	is 21.
rsiLen2	is 2 * W2 - 1.
AvgU2 	is ExpAvg(iff(U>0,U,0),rsiLen2).
AvgD2 	is ExpAvg(iff(D>=0,D,0),rsiLen2).
rsi21o 	is 100-(100/(1+(AvgU2/AvgD2))).

W3	is 4.
rsiLen3	is 2 * W3 - 1.
AvgU3 	is ExpAvg(iff(U>0,U,0),rsiLen3).
AvgD3 	is ExpAvg(iff(D>=0,D,0),rsiLen3).
rsi4 	is 100-(100/(1+(AvgU3/AvgD3))).

W4	is 28.
rsiLen4	is 2 * W4 - 1.
AvgU4 	is ExpAvg(iff(U>0,U,0),rsiLen4).
AvgD4 	is ExpAvg(iff(D>=0,D,0),rsiLen4).
rsi28 	is 100-(100/(1+(AvgU4/AvgD4))).
—Richard Denning
info@TradersEdgeSystems.com
for AIQ Systems
BACK TO LIST

TRADERSSTUDIO: DECEMBER 2012 TRADERS’ TIPS CODE
The TradersStudio code based on “Using VIX To Forecast The S&P 500” by Trent Gardner is provided at the following websites:
The following code files are provided in the download:
- Function: “COUNTOF” is a helper function that returns the number of times a rule is true
- System: “VIX_COUNT” is Gardner’s system plus my modified system.
Parameters:
- useTrendFilter if = 1 then use my modified system, otherwise, use Gardner’s original system
- maLen = moving average length for VIX average of lows
- count = number of required days that the VIX or SP must be above or below its respective moving average
- maMult = multiple of the maLen that is used to get the length of the moving average for the SP contract.
I tested using the S&P 500 futures contract (SP) and the VIX using data from Pinnacle Data. I did an initial test of the author’s system and found that there was more drawdown than I would like to see. As a result of the first test, I added a trend filter that requires the SP close to be above its moving average for the same number of days that the VIX must be below its moving average. The moving average on the SP contract is a multiple (input parameter=”maMult”) of the moving average used on the VIX. The modified system exits when either the VIX is above its moving average for the required days or the SP contract is below its moving average the same required days.
Figure 9 shows the equity curve and underwater equity curve resulting from trading one contract and using a fully optimized parameter set for the modified system. For the test period 1996 to 2012, the system with fully optimized parameters trading long-only showed a total profit of $224,813 with a maximum drawdown of $53,875.
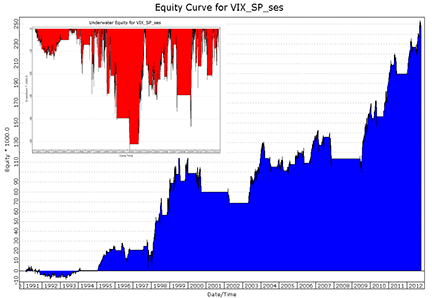
FIGURE 9: TRADERSSTUDIO, EQUITY CURVE. Here are sample equity and underwater equity curves for system described by Gardner with the added trend filter from 1991 to 2012. This is for the fully optimized set of parameters.
Optimized parameters often show overly rosy results compared to actual trading going forward. TradersStudio has the walk-forward testing tool that helps us to evaluate how much deterioration there might be when actually trading a system. I ran a walk-forward test on the modified system using an optimization window of approximately four years with a forward-testing window of approximately one year.
The results of the one-year forward tests pieced together are shown in Figure 10. The equity curve is now not as good-looking and the underwater equity curve is also worse. For the test period of 1996 to 2012, the system with walk-forward parameters trading long-only showed lower total profit of $140,025 with a higher maximum drawdown of $72,200.
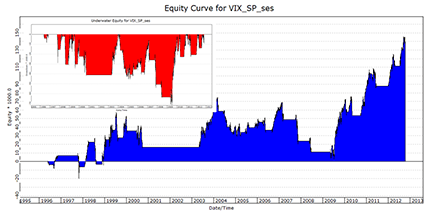
FIGURE 10: TRADERSSTUDIO, WALK-FORWARD EQUITY CURVES. Here are sample walk-forward equity and underwater equity curves for Gardner’s system with the added trend filter from 1996 to 2012. The first four years are skipped due to the initial optimization period.
—Richard Denning
info@TradersEdgeSystems.com
for TradersStudio
BACK TO LIST

TC2000: DECEMBER 2012 TRADERS’ TIPS CODE
This Traders’ Tip is for TC2000 version 12.3, based on Trent Gardner’s article in this issue, “Using VIX To Forecast The S&P 500.”
In TC2000.com, you can use the Custom % True Indicator to set up the buy and sell indicators from Gardner’s article and set alerts so you’re notified when to buy and sell.
A “Custom % True” indicator will display a value of 100 when the underlying condition is true. If you set the period on the indicator to a number, 11 for example, the value of the indicator will be 100 if the condition is true for each of the previous 11 bars. If it is only true six of the 11 bars, the indicator value would be 54.55 (or 54.55%).
In Figure 11, the buy and sell signal lines are plotted on the VIX-X chart between DDM and SPY.
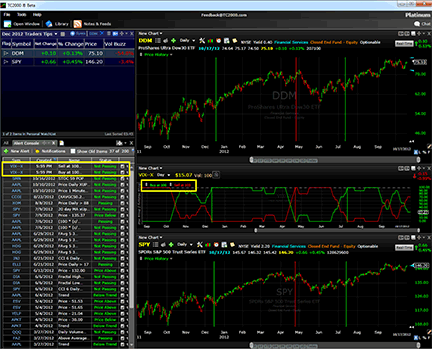
FIGURE 11: TC2000. The workspace shows three charts: one of DDM at the top, VIX-X in the middle, and SPY on the bottom. The price pane of the VIX-X chart is pinned off to the side to save screen real estate, leaving only the buy and sell indicators visible. The buy and sell points are further defined on the charts by colored vertical lines drawn for illustrative purposes.
Buy signal: Custom % True Indicator on a daily chart of VIX-X using the formula:
C < AVGL50
Set the moving average period to 11. The value of this indicator will be 100 when the VIX has closed below its 50-period average low for 11 consecutive days.
Sell signal: Custom % True Indicator on a daily chart of VIX-X using the formula:
C > AVGL50
Set the moving average period to 11. The value of this indicator will be 100 when the VIX has closed above its 50-period average low for 11 consecutive days.
You can set alerts on both the buy and sell indicators to alert you when either indicator’s value is above 99. Once you set the alerts, you don’t really need to look at the charts again. You’ll get an email and/or text message whenever either alert fires.
For a free trial of TC2000, visit www.TC2000.com.
—Patrick Argo
Worden Brothers, Inc.
www.Worden.com
BACK TO LIST

NINJATRADER: DECEMBER 2012 TRADERS’ TIPS CODE
VixATS, as discussed in “Using VIX To Forecast The S&P 500” by Trent Gardner in this issue, has been implemented as an automated strategy available for download at www.ninjatrader.com/SC/December2012SC.zip.
Once downloaded, from within the NinjaTrader Control Center window, select the menu File → Utilities → Import NinjaScript and select the downloaded file. This file is for NinjaTrader version 7 or greater.
You can review the strategy source code by selecting the menu Tools → Edit NinjaScript → Strategy from within the NinjaTrader Control Center window and selecting “VixATS.”
NinjaScript uses compiled DLLs that run native, not interpreted, which provides you with the highest performance possible.
A sample chart implementing the strategy is shown in Figure 12.
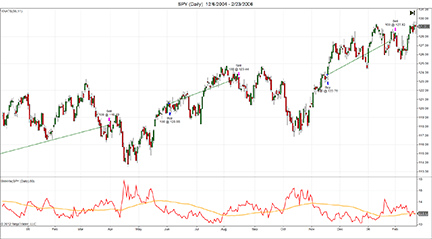
FIGURE 12: NINJATRADER. This screenshot shows VixATS applied to a daily chart of ETF SPY.
—Raymond Deux & Ryan Millard
NinjaTrader, LLC
www.ninjatrader.com
BACK TO LIST

UPDATA: DECEMBER 2012 TRADERS’ TIPS CODE
This Traders’ Tip is based on “Using VIX To Forecast The S&P 500” by Trent Gardner in this issue.
In his article, Gardner smoothes the VIX with a 50-day moving average and seeks to time long entries into the S&P 500 (and the Ultra Dow 30 ETF, DDM), based on the number of periods the VIX spends below its average value. Long positions are closed if a certain amount of time is spent above its average value. All parameter values are flexible and can be optimized within Updata.
A sample chart is shown in Figure 13.
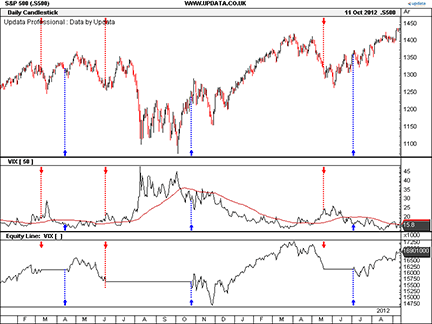
FIGURE 13: UPDATA. Here is the daily S&P 500 with signal arrows from the VIX-based timing method, and the equity curve for that region in the bottom chart pane.
The Updata code for this system is in the Updata Library and may be downloaded by clicking the Custom menu and then “System Library.” Those who cannot access the library due to firewall issues may paste the code below into the Updata Custom editor and save it.
'Using VIX To Forecast The S&P
PARAMETER "VIX Index" ~VIX=Select
PARAMETER "Avg. Period" #AvgPeriod=50
PARAMETER "Count" #Count=11
NAME "VIX [" #AvgPeriod "]" ""
DISPLAYSTYLE 2LINES
INDICATORTYPE CHART
COLOUR2 RGB(200,0,0)
@VIXAvg=0
#ComeDown=0
#ComeUp=0
FOR #CURDATE=#AvgPeriod TO #LASTDATE
    'VIX Count above or Below Avg
    @VIXAvg=SGNL(~VIX,#AvgPeriod,M)
    If ~VIX<@VIXAvg
      #ComeDown=#ComeDown+1
      #ComeUp=0
    ElseIf ~VIX>@VIXAvg
      #ComeDown=0
      #ComeUp=#ComeUp+1
    EndIf
    'System Entries
    If #ComeDown>=#Count
       BUY CLOSE
    ElseIf #ComeUp>=#Count AND ORDERISOPEN=1
       SELL CLOSE
    EndIf
    'Line Plots
    @Plot=~VIX
    @Plot2=@VIXAvg
NEXT
—Updata support team
support@updata.co.uk
www.updata.co.uk
BACK TO LIST

TRADINGSOLUTIONS: DECEMBER 2012 TRADERS’ TIPS CODE
In “Using VIX To Forecast The S&P 500” in this issue, author Trent Gardner presents a moving average crossover system for trading the SPY based on the VIX.
We have coded this system, available as a function file that can be downloaded from the TradingSolutions website in the “free systems” section. The concept of a moving average crossover after a period without crossing has been converted into a pair of support functions.
As with many indicators, this system or its inputs could make good inputs to neural network predictions.
Function: Cross Above MA After Min Bars Below
Short Name: CrossAboveMAAfterBars
Inputs: Value, MAPeriod, MinBars
And (GT (Value, MA (Value, MAPeriod)), GE (Lag (BarsWhile (LE (Value, MA (Value, MAPeriod))), 1), MinBars))
Function: Cross Below MA After Min Bars Above
Short Name: CrossAboveMAAfterBars
Inputs: Value, MAPeriod, MinBars
And (LT (Value, MA (Value, MAPeriod)), GE (Lag (BarsWhile (GE (Value, MA (Value, MAPeriod))), 1), MinBars))
System: VIX Crossing System
Inputs: VIX, MAPeriod, MinBars
Enter Long: CrossAboveMAAfterBars (VIX, MAPeriod, MinBars)
Exit Long: CrossBelowMAAfterBars (VIX, MAPeriod, MinBars)
—Gary Geniesse
NeuroDimension, Inc.
800 634-3327, 352 377-5144
www.tradingsolutions.com
BACK TO LIST

OMNITRADER: DECEMBER 2012 TRADERS’ TIPS CODE
In his article in this issue, “Using VIX To Forecast The S&P 500,” author Trent Gardner discusses a study by James Kozyra and Camillo Lento that tested the viability of the VIX index to forecast the S&P 500. In their testing, this method was shown to produce more than 12% annually over the last decade.
We’re providing OmniLanguage code for the VIX forecasting system, shown below.
#System

'**********************************************************************
'*   VIX Timing System (VIXTIME)
'*     by Ryan Olson
'*	   October,2012
'*
'*	Adapted from Technical Analysis of Stocks and Commodities
'*    December 2012
'*
'*  Summary:
'*
'* 		This system uses a 50 period simple moving average of the VIX index (vAvg).
'*  Signals are generated when there are 11 concecutive bars above or below the vAvg.
'*  For more information see "Using VIX to Forecast The S&P 500", in the December 2012
'*  edition of Technical Analysis of Stocks and Commodities.
'*
'*  Parameters:
'*
'*  nUpCount= Counts number of closing bars above vAvg
'*
'*  nDnCount = Counts number of closing bars below vAvg
'*
'*  vAvg= Identifies the Simple Moving Average of the $VIX
'*
'*  vCls= Identifies the close price of the $VIX
'*
'*  Plot= Plots the vAvg price on price chart
'*
'*  Counter= Changes the number of bars required for long/short postions
'*
'********************************************************************

#PARAM "Periods", 50, 1, 50
#PARAM "Counter", 11, 1, 20

Dim nUpCount as Integer = 0
Dim nDnCount as Integer = 0
Dim vAvg as Integer
Dim vCls as Single


'Get close and Simple Moving Average of $VIX
vCls = GetClose("$VIX")
vAvg = SMA(GetClose("$VIX"), Periods)

'Long Position
If vCls <= vAvg then
	nUpCount += 1
Else
	nUpCount = 0
End If

If nUpCount = Counter then
	signal = LongSignal
End If

'Short Postion

If vCls >= vAvg then
	nDnCount += 1
Else
	nDnCount = 0
End If

If nDnCount = Counter then
	Signal = ShortSignal
End If


SetScales(0,100)
Plot("Vix", vCLS)
Plot("MA", vAVG)
To use the code, save or copy the file into the VBA folder of your OmniTrader or VisualTrader directory. Then, the next time you start OT or VT, the system will be available for use. If desired, the calculations can be modified using the Omni-Language IDE.
A sample chart is shown in Figure 14.
FIGURE 14: OMNITRADER. This shows the SPY with the VIX timing forecast system plotted. Note how the system correctly displays profitable entries using the method of 11 consecutive days below the moving average.
—Ryan Olson, Nirvana Systems, Inc.
www.omnitrader.com
BACK TO LIST

TRADE NAVIGATOR: DECEMBER 2012 TRADERS’ TIPS CODE
Trade Navigator offers everything needed to recreate the strategy discussed in “Using VIX To Forecast The S&P 500” by Trent Gardner in this issue.
Note that since the article did not discuss any exit rules, the strategy presented here reverses but does not exit. You can add exit rules and/or Quick Stops if desired.
You can create the strategy used in the Using VIX To Forecast The S&P 500 article by using the following TradeSense™ code.
First, open the Trader’s Toolbox, click on the Strategies tab and click the New button.
Click the New Rule button, select No when the Condition Builder option comes up.
Enter the following code for the Up rule:
IF (Consecutive (High > MovingAvg (High , 50)) = 11) Of "$VIX"
Under Action select Short Entry (SELL)
Order Type: Market
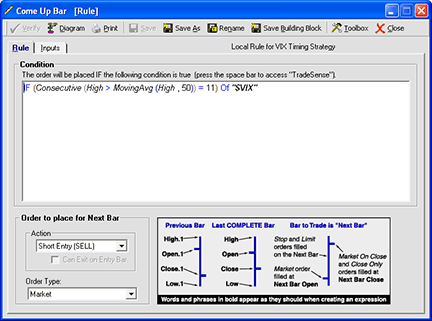
CREATING A RULE
Click the Save button, enter a name for the Rule and click the OK button.
For the Down rule use the following code:
IF (Consecutive (Low < MovingAvg (Low , 50)) = 11) Of "$VIX"
Under Action select Long Entry (BUY)
Order Type: Market
Click the Save button, enter a name for the Rule and click the OK button.
Click the Save button in the new strategy toolbar, type a name for the strategy and click the OK button.
Now that you have created the strategy in Trade Navigator™ you can run it on a chart, backtest it in strategies or run it in a strategy basket with other strategies and/or on multiple symbols and more.
Note that you can also use these rules as highlight markers or bars on Trade Navigator™ charts by creating a function or custom highlight bar without the IF at the beginning of the code as follows.
VIX Timing Up highlight:
(Consecutive (High > MovingAvg (High , 50)) = 11) Of "$VIX"
VIX Timing Down highlight:
(Consecutive (Low < MovingAvg (Low , 50)) = 11) Of "$VIX"
Genesis Financial Technologies is providing a library called “VIX timing system” that includes this strategy and a strategy basket that applies the strategy to ProShares Ultra Dow30 (DDM) and SPDR S&P 500 ETF Trust (SPY). You can download a special file named “SC201212,” downloadable through Trade Navigator.
—Michael Herman
Genesis Financial Technologies
www.TradeNavigator.com
BACK TO LIST

SHARESCOPE: DECEMBER 2012 TRADERS’ TIPS CODE
We’re providing a ShareScope script to apply the strategy described in Trent Gardner’s article in this issue, “Using VIX To Forecast The S&P 500.” It is for use on the S&P 500 daily bar chart and uses data from the VIX and its 50-day simple moving average. When the VIX has been above its 50-day MA for 11 straight days, a sell signal is placed on the S&P 500. A buy signal is generated when the VIX has been below its 50-day MA for 11 straight days.
The script is shown below and can be downloaded here.
//@Name:VIX Forecaster
//@Description:Uses VIX data to generate buy/sell signals. Display the script on an S&P 500 chart or an S&P ETF. As described on Stocks & Commodities, December 2012.
//@Type:Historical

var period = 50;
var lookback = 11;

function init(status)
{
	if (status == Loading || status == Editing)
	{
		period = storage.getAt(0);
		lookback = storage.getAt(1);
	}
	if (status == Adding || status == Editing)
	{
		dlg = new Dialog("Settings...", 145, 55);
		dlg.addOkButton();
		dlg.addCancelButton();
		dlg.addIntEdit("INT1",8,-1,-1,-1,"","SMA period",period,2,1000);
		dlg.addIntEdit("INT2",8,-1,-1,-1,"","Counter",lookback,2,1000);
		if (dlg.show()==Dialog.Cancel)
			return false;
		period = dlg.getValue("INT1");
		lookback = dlg.getValue("INT2");

		storage.setAt(0, period);
		storage.setAt(1, lookback);
	}
}
function onNewChart()
{
	draw();
}

function draw()
{
	var share = getCurrentShare();
	var data = getShare("USI:VIX").getPriceArray();
	var ma1 = new MA(period);
	var sma = [];
	var inTrade = false;

	for (var i=0;i<data.length;i++)
	{
		sma[i] = ma1.getNext(data[i].close);
		if (i>=lookback && !inTrade)
		{
			var count=0;
			for (var j=0;j<lookback;j++)
			{
				if (data[i-j].close>sma[i-j]) break;
				count++;
			}
			if (count==lookback && data[i].dateNum>=bars[0].dateNum)
			{
				setPenColour(Colour.Green);
				setBrushColour(Colour.Green);
				inTrade = true;
				drawSymbol([data[i].dateNum,43200], share.getPriceOnDate(data[i].date).low, Symbol.TriangleUp, "", BoxAlign.Centre|BoxAlign.Below);
			}
		}
		if (i>=lookback && inTrade)
		{
			var count=0;
			for (var j=0;j<lookback;j++)
			{
				if (data[i-j].close<sma[i-j]) break;
				count++;
			}
			if (count==lookback)
			{
				setPenColour(Colour.Red);
				setBrushColour(Colour.Red);
				inTrade = false;
				drawSymbol([data[i].dateNum,43200], share.getPriceOnDate(data[i].date).high, Symbol.TriangleDown, "", BoxAlign.Centre|BoxAlign.Above);
			}
		}
	}
}
—Tim Clarke, Sharescope
www.sharescript.co.uk
BACK TO LIST
MICROSOFT EXCEL: DECEMBER 2012 TRADERS’ TIPS CODE
In “Using VIX To Forecast The S&P 500” in this issue, author Trent Gardner’s treatment of VIX as an indicator is simple, straightforward, and, under my limited testing, appears to be quite powerful.
While Gardner’s article only deals with long trade simulations, it is apparent that this would be easily applied to shorting as well.
The chart example provided here uses vertical bars to flag buy and sell execution dates, which Gardner has realistically delayed one day from the end-of-day system signals.
There are some differences in this Excel trading simulation when compared to Gardner’s documented trades: the backtest simulation included in this spreadsheet does not allow for commissions. Looking at the numbers in the trade table in Gardner’s Figure 12 in his article shows that his Wealth-Lab simulation did provide some allowance for commissions.
Position-sizing used in this spreadsheet is calculated by way of a user-specified percentage of the account cash available at trade time. Here, cash available is the rollup of initial cash and previously closed trade results.
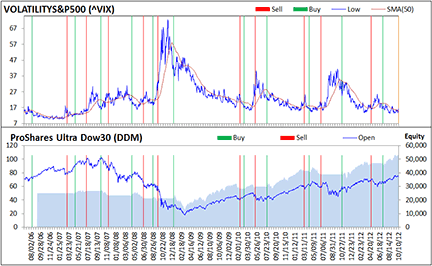
FIGURE 15: MICROSOFT EXCEL, VIX INDICATOR. Here’s an example of the VIX indicator as projected onto ProShares. A trading simulation equity curve is shown in the background.
This Excel version of the VIX indicator hits all of the buy and sell trade dates listed in Gardner’s example (see Figure 15 shown here). The DDM example shown here also hits all of the trade prices. However, my testing with SPY matches prices on recent trades but differs by as much as +0.50 on trades prior to 3/8/2010. See Figure 16 for a trade results summary.
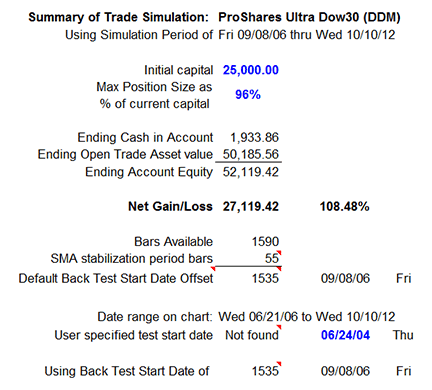
FIGURE 16: MICROSOFT EXCEL, BACKTEST RESULTS
This just confirms what Sunny Harris wrote last year in the S&C article “How Good Is Your Data?” (February 2011 S&C) — in essence, data from your source may not exactly match data from my source.
The spreadsheet file for this Traders’ Tip can be downloaded here. To successfully download it, follow these steps:
- Right-click on the link to the Excel file, then
- Select “save as” to place a copy of the spreadsheet file on your hard drive.
—Ron McAllister
Excel and VBA programmer
rpmac_xltt@sprynet.com
BACK TO LIST
Originally published in the December 2012 issue of
Technical Analysis of Stocks & Commodities magazine.
All rights reserved. © Copyright 2012, Technical Analysis, Inc.
Return to
Contents