TRADING SYSTEMS
Getting Into The Game
When a trend has already begun, does that mean it’s too late to get in? Not necessarily. This trading technique can help you get into a trend so you don’t have to miss trading opportunities.
Computer charting software that allows traders to create their own custom studies and formulas opens the door to a world of experimentation that could lead to the development of a new trading indicator. But it isn’t always necessary to go to those lengths in order to find useful trading tools. Sometimes simply combining the components of one well-known indicator with another is enough to create a type of synergy that can enhance trading.
For several years, one of my templates for short-term trading has included something I call the DMI stochastic, which I use mainly to identify potential entries into an existing trend. The template consists of a trend-identifying oscillator based on indicators from J. Welles Wilder’s directional movement index (DMI) and also a momentum indicator derived from that oscillator. Together, they offer two indicators that capture three powerful technical analysis basics: trend, momentum, and support/resistance. While not as reliable for intraday trading, they work well in 60-minute, end-of-day (EOD), and weekly time frames. This article shows how to create and apply these indicators using EOD charts.
DMI OSCILLATOR
Within the suite of indicators that make up Wilder’s directional movement index (DMI) are the plus directional movement indicator (+DI) and the minus directional movement indicator (-DI). They provide the foundation for the more widely recognized average directional index (ADX). Whereas the ADX offers information about the strength of price movement but not its direction, the +DI and -DI furnish information about the positive or negative direction of price movement over a period of time.
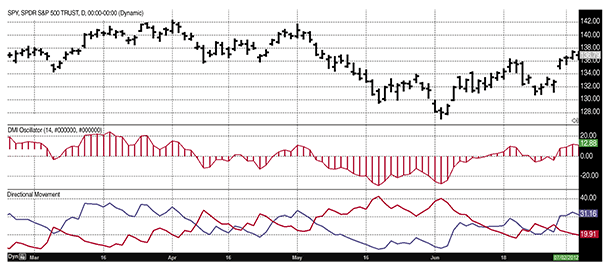
Wilder provides complete information about the function and construction of all the components that make up the directional movement index in his 1978 book, New Concepts In Technical Trading Systems. In general, the plus and minus components of the DMI focus on that portion of the current bar’s trading range that is outside the range of the previous price bar. If it is higher, it is considered to be positive (+) and if it is lower, it is labeled negative (-). These values are divided by the true range and averaged over time, usually 14 periods. A move by the +DI above the -DI indicates that positive or upward price direction has overtaken negative or downward price direction. Conversely, when +DI falls below -DI, declining price either from selling pressure or lack of upward price momentum is taking control. Potential changes in direction or trend occur when the lines intersect.

FIGURE 1: SPY WITH DIRECTIONAL INDICATORS. The lower panel of this chart displays the 14-period plus and minus directional indicators as they are usually plotted in charting software. The middle panel shows a 14-period DMI oscillator in histogram form that crosses above and below a zero line.