TRADERS’ TIPS
January 2013
Here is this month’s selection of Traders’ Tips, contributed by
various developers of technical analysis software to help readers more easily
implement some of the strategies presented in this and other issues.
Other code appearing in articles in this issue is posted in the Subscriber
Area of our website at https://technical.traders.com/sub/sublogin.asp.
Login requires your last name and subscription number (from mailing label).
Once logged in, scroll down to beneath the “Optimized trading systems” area
until you see “Code from articles.” From there, code can be copied
and pasted into the appropriate technical analysis program so that no retyping
of code is required for subscribers.
You can copy these formulas and programs for easy use in your spreadsheet
or analysis software. Simply “select” the desired text
by highlighting as you would in any word processing program, then use your
standard key command for copy or choose “copy” from the browser
menu. The copied text can then be “pasted” into any open spreadsheet
or other software by selecting an insertion point and executing a paste command.
By toggling back and forth between an application window and the open web
page, data can be transferred with ease.

For this month’s Traders’ Tips, the focus is Barbara
Star’s article in this issue, “The DMI Stochastic.” Here
we present the January 2013 Traders’ Tips code.
Source code for eSignal is already provided in Star’s
article by the author, and subscribers will find this code in the Subscriber
Area of our website, Traders.com. (Click
on “Article
Code” from our homepage.) Presented here is additional code and
possible implementations for other software.

TRADESTATION: JANUARY 2013 TRADERS’ TIPS
CODE
In the article “The DMI Stochastic” in
this issue, author Barbara Star describes the use of a DMI oscillator indicator
and a DMI stochastic indicator to help time entries into markets.
Potential long entries exist when the DMI oscillator is above zero and the
DMI stochastic is oversold and potential short entries exist when the DMI oscillator
is below zero and the DMI stochastic is overbought. For more on entry conditions,
please reference Star’s article.
Based on this, we are providing four studies with two accompanying functions.
The four studies have been applied to a chart of IBM and can be seen in the
chart in Figure 1. The PaintBar study was used to paint the bars red or blue
based on the DMI oscillator value (above or below zero). The ShowMe (dot markers
in price subgraph) study is used to identify reversals of the DMI stochastic
as described by Star.
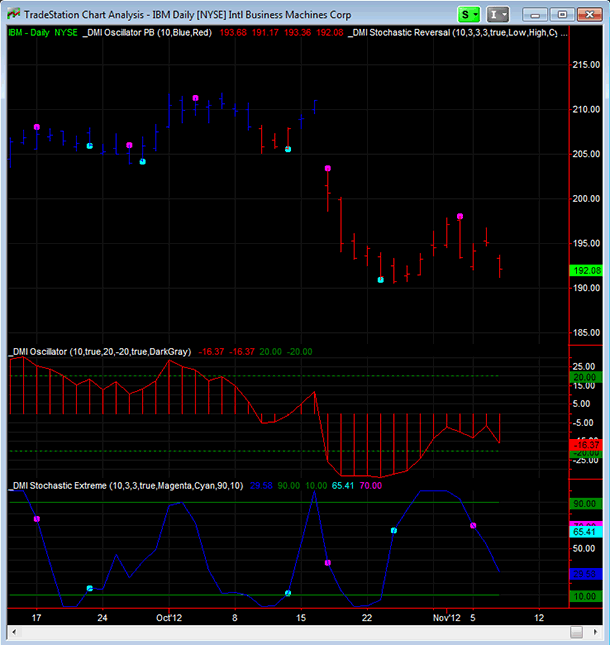
FIGURE 1: TRADESTATION, FOUR STUDIES. Here is a daily
bar chart of IBM with the four studies applied.
The two indicators provided here are for the DMI oscillator and the DMI stochastic
extreme as described in the article. Once you have the studies applied to your
chart, you can save this analysis group to allow for quicker application to
another chart. To save the analysis group once you have the chart set up as
desired, from the main platform, select Format→Save Analysis Group from
the menus.
To download the EasyLanguage code for this strategy, first navigate to the
EasyLanguage FAQs and Reference Posts Topic in the EasyLanguage Support Forum
(https://www.tradestation.com/Discussions/Topic.aspx?Topic_ID=47452),
scroll down, and click on the link labeled “Traders’ Tips, TASC.” Then
select the appropriate link for the month and year. The ELD filename is “_DMI_Stochastic.ELD.”
The EasyLanguage code is also shown below.
_DMI Oscillator ( Indicator )

{ "The DMI Stochastic" }
{ Barbara Star, PhD }
{ TASC, January 2013  }

inputs:
	int DMILength( 10 ), { DMI calculation length }
	bool PlotOBandOSLines( true ),
	double OverBought( 20 ),
	double OverSold( -20 ),
	bool ColorCellBGOnOBorOS( true ), { if true, cell
	 background color will be if DMI Oscillator is in
	 overbought or oversold territory }
	int BackgroundColorOnOBorOS( DarkGray ) ; { if
	 ColorCellBGOnOBorOS is true, this input specifies
	 the color to which the cell background will be
	 changed;  if ColorCellBGOnOBorOS is false, then
	 this input has no effect }

variables:
	intrabarpersist bool InAChart( false ),
	double DMIOsc( 0 ) ; { holds DMI Oscillator
	 value }

once { determine if the application is a chart  }
	InAChart =
	 GetAppInfo( aiApplicationType ) = cChart ;

{ calculate the DMI oscillator value }
DMIOsc = _DMI_Oscillator( DMILength ) ;

{ plot the DMI oscillator value }
Plot1( DMIOsc, "DMIOsc" ) ;
if InAChart then
	Plot2( DMIOsc, "DMIOscL" ) ; { line plot }

if PlotOBandOSLines then
	begin
	Plot3( OverBought, "OverBought" ) ;
	Plot4( OverSold, "OverSold" ) ;
	end ;

{ grid application specifics }
if ColorCellBGOnOBorOS then { if true, set the
 background color if the DMI Oscillator is overbought
 or oversold; note that SetPlotBGColor has no effect
 in Charting }
	begin
	if DMIOsc > OverBought then
		SetPlotBGColor( 3,
		 BackgroundColorOnOBorOS ) ;
	if DMIOsc < OverSold then
		SetPlotBGColor( 4,
		 BackgroundColorOnOBorOS ) ;
	end ;

{ alerts }
if AlertEnabled then
	begin
	if DMIOsc > OverBought then
		Alert( "DMI Oscillator overbought." ) ;
	if DMIOsc < OverSold then
		Alert( "DMI Oscillator oversold." ) ;
	end ;


_DMI Stochastic Extreme ( Indicator )

{ "The DMI Stochastic" }
{ Barbara Star, PhD }
{ TASC, January 2013  }

inputs:
	int DMILength( 10 ), { DMI calculation length }
	int HLPeriod( 3 ),
	int SumPeriod( 3 ),
	bool PlotMarkers( true ),
	int OBCrossColor( Magenta ), { dot color for cross
	 of OverBought level }
	int OSCrossColor( Cyan ), { dot color for cross of
	 OverSold level }
	double OverBought( 90 ), { overbought level }
	double OverSold( 10 ) ; { oversold level }

variables:
	double DMIStoch( 0 ) ; { holds DMI Stochastic
	 value }

DMIStoch = _DMI_Stochastic_Extreme( DMILength,
 HLPeriod, SumPeriod ) ;

{ plots }
Plot1( DMIStoch, "DMIStoch" ) ;
Plot2( OverBought, "OverBought" ) ;
Plot3( OverSold, "OverSold" ) ;

{ alerts and markers }
if DMIStoch crosses over OverSold then
	begin
	if PlotMarkers then
		Plot4( DMIStoch, "OSCross", OSCrossColor ) ;
	Alert( "DMIStoch crossed over oversold." ) ;
	end;

if DMIStoch crosses under OverBought then
	begin
	if PlotMarkers then
		Plot5( DMIStoch, "OBCross", OBCrossColor ) ;
	Alert( "DMIStoch crossed under overbought." ) ;
	end ;


_DMI Oscillator PB ( PaintBar )

{ "The DMI Stochastic" }
{ Barbara Star, PhD }
{ TASC, January 2013  }

inputs:
	int DMILength( 10 ), { DMI calculation length }
	int UpColor( Blue ), { PaintBar color if DMI
	 Oscillator is greater than 0 }
	int DownColor( Red ) ; { PaintBar color if DMI
	 Oscillator is less than or equal to 0 }

variables:
	double DMIOsc( 0 ), { holds DMI Oscillator value }
	int PlotColor( 0 ) ; { PaintBar Color }

{ calculate the DMI oscillator value }
DMIOsc = _DMI_Oscillator( DMILength ) ;

{ set PaintBar color based on DMI Oscillator value }
if DMIOsc > 0 then
	PlotColor = UpColor
else
	PlotColor = DownColor ;

PlotPaintBar( High, Low, Open, Close, "DMIOscPB",
 PlotColor ) ;


_DMI Stochastic Reversal ( ShowMe )

{ "The DMI Stochastic" }
{ Barbara Star, PhD }
{ TASC, January 2013  }

inputs:
	int DMILength( 10 ), { DMI calculation length }
	int HLPeriod( 3 ),
	int SumPeriod( 3 ),
	int DMIStochMALength( 3 ),
	bool PlotMarkers( true ),
	double CrossOverPlotPrice( Low ), { dot location
	 when DMIStoch crosses over its moving average }
	double CrossUnderPlotPrice( High ), { dot location
	 when DMIStoch crosses under its moving average }
	int CrossOverColor( Cyan ), { dot color for
	 DMIStoch cross over moving average }
	int CrossUnderColor( Magenta ) ; { dot color for
	 DMIStoch cross under  moving average }

variables:
	double DMIStoch( 0 ), { holds DMI Stochastic
	 value }
	double DMIStochMA( 0 ) ; { moving average of DMI
	 Stochastic value }

DMIStoch = _DMI_Stochastic_Extreme( DMILength,
 HLPeriod, SumPeriod ) ;

DMIStochMA = Average( DMIStoch, DMIStochMALength ) ;

if CurrentBar > DMIStochMALength then { ensure
 adequate bars have been calculated to obtain valid
 values }
	begin
	if DMIStoch crosses over DMIStochMA then
		begin
		if PlotMarkers then
			Plot1( CrossOverPlotPrice, "CrossOver",
			 CrossOverColor ) ;
		Alert( "DMIStoch crossed over MA." ) ;
		end ;

	if DMIStoch crosses under DMIStochMA then
		begin
		if PlotMarkers then
			Plot2( CrossUnderPlotPrice, "CrossUnder",
			 CrossUnderColor ) ;
		Alert( "DMIStoch crossed under MA." ) ;
		end ;
	end ;


_DMI_Oscillator ( Function )

{ "The DMI Stochastic" }
{ Barbara Star, PhD }
{ TASC, January 2013  }

inputs:
	int DMILength( numericsimple ) ; { length for
	 DMI calculations }

variables:
	double DMIPlusValue( 0 ),
	double DMIMinusValue( 0 ),
	double DMIOsc( 0 ) ;

once { function designed for Daily, Weekly, or Monthly
 bars}
	begin
	if BarType < 2 or BarType > 4 then
		RaiseRunTimeError( "_DMI_Oscillator " +
		 "function designed to work with Daily, " +
		 "Weekly, or Monthly Bars" ) ;
	end ;

DMIPlusValue = DMIPlus( DMILength ) ;
DMIMinusValue = DMIMinus( DMILength ) ;
DMIOsc = DMIPlusValue - DMIMinusValue ;

_DMI_Oscillator = DMIOsc ;

{ force series function, since otherwise this function
can verify as simple, but needs to be called at every
bar to return correct results }
if false then
	Value1 = _DMI_Oscillator[1] ;


_DMI_Stochastic_Extreme ( Function )

{ "The DMI Stochastic" }
{ Barbara Star, PhD }
{ TASC, January 2013  }

inputs:
	int DMILength( numericsimple ), { DMI calc
	 length }
	int HLPeriod( numericsimple ),
	int SumPeriod( numericsimple ) ;

variables:
	double DMIOsc( 0 ), { holds DMI Oscillator
	 value }
	double HighestDMIOsc( 0 ),
	double LowestDMIOsc( 0 ),
	double DMIStoch( 0 ), { holds DMI Stochastic
	 value }
	double SumNumerator( 0 ), { numerator sum }
	double SumDenominator( 0 ), { denominator sum }
	int LoopCounter( 0 ) ;

{ calculate the DMI oscillator value }
DMIOsc = _DMI_Oscillator( DMILength ) ;

HighestDMIOsc = Highest( DMIOsc, HLPeriod ) ;
LowestDMIOsc = Lowest( DMIOsc, HLPeriod ) ;

SumNumerator = 0 ;
SumDenominator = 0 ;

for LoopCounter = 0 to SumPeriod - 1
	begin
	SumNumerator += DMIOsc[LoopCounter] -
	 LowestDMIOsc[LoopCounter] ;
	SumDenominator += HighestDMIOsc[LoopCounter] -
	 LowestDMIOsc[LoopCounter] ;
	end ;

if SumDenominator > 0 then
	DMIStoch = SumNumerator / SumDenominator * 100 ;

_DMI_Stochastic_Extreme = DMIStoch ;
This article is for informational purposes. No type of trading or investment
recommendation, advice, or strategy is being made, given, or in any manner
provided by TradeStation Securities or its affiliates.
—Chris Imhof
TradeStation Securities, Inc.
www.TradeStation.com
BACK TO LIST

METASTOCK: JANUARY 2013 TRADERS’ TIPS
CODE
Barbara Star’s article in this issue, “The
DMI Stochastic,” includes multiple formulas. The MetaStock version
of those formulas are listed here, courtesy of Star.
Name:  DMI Osc
Formula:

PDI(10)-MDI(10)

Change the line style to a histogram.  Once the histogram is plotted, place a one period simple moving average on the DMI Oscillator to outline the shape.


Name:  DMI Stochastic
Formula:

 (Sum(PDI(10)-MDI(10)-LLV(PDI(10)-MDI(10 ),3),3)/
Sum(HHV(PDI(10)-MDI(10),3)-LLV(PDI(10)-MDI(10 ),3),3))*100


Expert Advisor:

Highlights:

Name: DMI Oscillator Above Zero
Color: Blue
Formula:

Fml("DMI Osc") > 0


Name: DMI Oscillator Below Zero
Color: Red
Formula:

Fml("DMI Osc") < 0


Symbols:

Name: Lower Extreme
Symbol: Up Arrow
Color: Green
Position: Below Prices
Formula:

(Fml("DMI Stochastic")>10)AND When(Ref(Fml("DMI Stochastic"),-1)<=10)


Name: Upper Extreme
Symbol: Down Arrow
Color: Red
Position: Above Prices
Formula:

(Fml("DMI Stochastic")<90)AND When(Ref(Fml("1 A DMI Stochastic"),-1)>=90)


Name: Reversal Alerts to Upside
Symbol: Diamond
Color: Green
Position: Below Prices
Formula:

Cross(Fml("DMI Stochastic"),Mov(Fml("DMI Stochastic"),3,S))


Name: Reversal Alerts to Downside
Symbol: Diamond
Color: Red
Position: Above Prices
Formula:

Cross(Mov(Fml("DMI Stochastic"),3,S),(Fml("DMI Stochastic")))
—William Golson, MetaStock Technical Support
Thomson Reuters
www.metastock.com
BACK TO LIST

THINKORSWIM: JANUARY 2013 TRADERS’ TIPS
CODE
In “The DMI Stochastic” in this issue,
author Barbara Star provides an in-depth discussion on how to use two classic
technical analysis calculations in conjunction with each other to deliver one
new study. The classic studies used are the directional movement index (DMI)
and a stochastic oscillator. The DMI oscillator combines the trending recognition
of the DMI with the trading level (overbought or oversold) indication of the
stochastic. This results in a much faster and more responsive oscillator that
is based on trending direction.
We have created several studies for thinkorswim users in our proprietary scripting
language, thinkScript. Adjust the parameters of the study within the Edit Studies
window to fine-tune behavior.
A sample chart is shown in Figure 2.
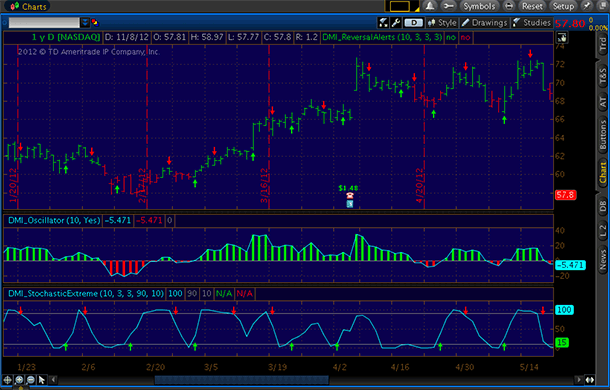
FIGURE 2: THINKORSWIM. Here are the DMI oscillator and
DMI stochastic extreme oscillator on a thinkorswim chart of the NASDAQ.
The studies:
- From TOS charts, select Studies → Edit Studies
- Select the “Studies” tab in the upper left-hand corner
- Select “New” in the lower left-hand corner
- Name the oscillator study (such as, “DMI_Oscillator”)
- Click in the script editor window, remove “plot data = close,” and
paste in the thinkorswim code associated with the study that you would like
to add:
DMI_Oscillator:
declare lower;

input length = 10;
input paintBars = yes;

def diPlus = DMI(length)."DI+";
def diMinus = DMI(length)."DI-";

plot Osc = diPlus - diMinus;
plot Hist = Osc;
plot ZeroLine = 0;

Osc.SetDefaultColor(GetColor(1));
Hist.SetPaintingStrategy(PaintingStrategy.HISTOGRAM);
Hist.SetLineWeight(3);
Hist.DefineColor("Positive", Color.UPTICK);
Hist.DefineColor("Negative", Color.DOWNTICK);
Hist.AssignValueColor(if Hist > 0 then Hist.Color("Positive") else Hist.Color("Negative"));
ZeroLine.SetDefaultColor(Color.GRAY);

DefineGlobalColor("Positive", Color.UPTICK);
DefineGlobalColor("Negative", Color.DOWNTICK);
AssignPriceColor(if !paintBars
    then Color.CURRENT
    else if Osc > 0
        then globalColor("Positive")
        else globalColor("Negative"));


DMI_ReversalAlerts:
input length = 10;
input highLowLength = 3;
input sumLength = 3;
input averageLength = 3;

def diPlus = DMI(length)."DI+";
def diMinus = DMI(length)."DI-";
def osc = diPlus - diMinus;
def hh = Highest(osc, highLowLength);
def ll = Lowest(osc, highLowLength);
def stoch = Sum(osc - ll, sumLength) / (Sum(hh - ll, sumLength)) * 100;
def avgStoch = Average(stoch, averageLength);

plot Above = stoch crosses above avgStoch;
plot Below = stoch crosses below avgStoch;

Below.SetDefaultColor(Color.DOWNTICK);
Below.SetPaintingStrategy(PaintingStrategy.BOOLEAN_ARROW_DOWN);
Above.SetDefaultColor(Color.UPTICK);
Above.SetPaintingStrategy(PaintingStrategy.BOOLEAN_ARROW_UP);


DMI_StochasticExtreme:
declare lower;

input length = 10;
input highLowLength = 3;
input sumLength = 3;
input over_bought = 90;
input over_sold = 10;


def diPlus = DMI(length)."DI+";
def diMinus = DMI(length)."DI-";
def osc = diPlus - diMinus;
def hh = Highest(osc, highLowLength);
def ll = Lowest(osc, highLowLength);

plot Stoch = Sum(osc - ll, sumLength) / (Sum(hh - ll, sumLength)) * 100;
plot OverBought = over_bought;
plot OverSold = over_sold;
plot Up = if Stoch crosses above over_sold then over_sold + 5 else Double.NaN;
plot Down = if Stoch crosses below over_bought then over_bought - 5 else Double.NaN;

Stoch.SetDefaultColor(GetColor(1));
OverBought.setDefaultColor(Color.GRAY);
OverSold.setDefaultColor(Color.GRAY);
Up.SetDefaultColor(Color.UPTICK);
Up.SetPaintingStrategy(PaintingStrategy.ARROW_UP);
Up.hideBubble();
Down.SetDefaultColor(Color.DOWNTICK);
Down.SetPaintingStrategy(PaintingStrategy.ARROW_DOWN);
Down.hideBubble();
—thinkorswim
A division of TD Ameritrade, Inc.
www.thinkorswim.com
BACK TO LIST

WEALTH-LAB: JANUARY 2013 TRADERS’ TIPS
CODE
In “The DMI Stochastic” in this issue,
author Barbara Star presents a number of simple but universal oscillator setups
that help get into a position, be it a trade in the direction of trend or a
countertrend opportunity. The author applies stochastics to Wilder’s
directional oscillator (+DI minus -DI), and uses both to identify the trend.
Most discussions of trading techniques are centered around entries into trades.
But in truth, a trading system’s success ultimately depends on exits,
position sizing, and portfolio selection — not entries. Unfortunately,
the DMI stochastic is not a complete trading system. To compensate, we have
added two generic exit strategies to evaluate its performance: a fixed-bars
exit that terminates a position once the specified number of days in the position
has been reached; and a combination of profitable/losing closes. These techniques
can be used to backtest almost any entry style without adding prejudice.
Entry rules
- Pullback entry:
- Buy at the open on the next bar if the DMI oscillator is above zero
and the DMI stochastic crosses above 10.
- Short at the open on the next bar if the DMI oscillator is below zero
and the DMI stochastic crosses below 90.
- Countertrend entry:
- Short at the open on the next bar if the DMI oscillator crosses under
-20.
- Buy at the open on the next bar if the DMI oscillator crosses above
20.
Exit rules
- Fixed bars: Exit at the open on the next bar when the specified number
of days has been reached.
- Profitable and losing closes (a profitable close is a close in the direction
of a trade; vice versa for a losing close):
- Exit at the open on the next bar after reaching the specified number
of profitable closes.
- Exit at the open on the next bar after reaching the specified number
of losing closes.
Both the entries and exits can be applied separately; the choice is up to
the user. To switch between the different entry and exit styles, drag the respective
slider in the “Strategy parameter” box on the lower-left of the
program’s workspace. The resulting strategy is available to Wealth-Lab
users for downloading right inside the program; simply click the “download...” button
in the application's “Open strategy” dialog.
A sample chart is shown in Figure 3 implementing this strategy.
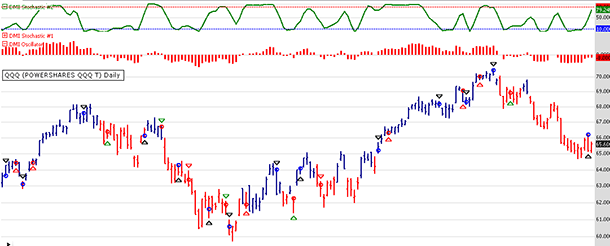
FIGURE 3: WEALTH-LAB. This daily chart of the QQQ illustrates
the application of the DMI oscillator/DMI stochastic.
C# Code:

using System;
using System.Collections.Generic;
using System.Text;
using System.Drawing;
using WealthLab;
using WealthLab.Indicators;

namespace WealthLab.Strategies
{
	public class Star201301 : WealthScript
	{
		private StrategyParameter paramEntryType;
		private StrategyParameter paramExitType;
		private StrategyParameter paramFixedBars;
		private StrategyParameter paramProfitableClosesTrend;
		private StrategyParameter paramProfitableClosesCT;
		private StrategyParameter paramLosingCloses;

		public Star201301()
		{
			paramEntryType = CreateParameter("Entry type", 0, 0, 2, 1);
			paramExitType = CreateParameter("Exit style", 0, 0, 1, 1);
			paramFixedBars = CreateParameter("Fixed bars", 5, 1, 30, 1);
			paramProfitableClosesTrend = CreateParameter("Prft closes (trend)", 10, 1, 15, 1);
			paramProfitableClosesCT = CreateParameter("Prft closes (CT)", 5, 1, 15, 1);
			paramLosingCloses = CreateParameter("Losing closes", 3, 1, 15, 1);
		}

		protected override void Execute()
		{
			int EntryType = paramEntryType.ValueInt == 0 ? 0 : paramEntryType.ValueInt == 1 ? 1 : 2;
			int pBars = 0; int lBars = 0;
			int FixedBars = paramFixedBars.ValueInt;							// Exit after N fixed bars
			int ProfitableClosesTrend = paramProfitableClosesTrend.ValueInt; 	// Number of profitable closes, trend mode
			int ProfitableClosesCounter = paramProfitableClosesCT.ValueInt;		// Number of profitable closes, counter-trend mode
			int LosingCloses = paramLosingCloses.ValueInt;						// Number of losing closes

			DIPlus dmp = DIPlus.Series( Bars,10 ); 								// DMI Oscillator
			DIMinus dmm = DIMinus.Series( Bars,10 );
			DataSeries dmo = dmp - dmm;
			dmo.Description = "DMI Oscillator";
			ChartPane dmoPane = CreatePane( 30,true,true );
			PlotSeries( dmoPane, dmo, Color.Red, LineStyle.Histogram, 3 );

			DataSeries dmiStoch = new DataSeries( dmo, "DMI Stochastic" );		// DMI Stochastic - direct calculation
			Highest hDmo = Highest.Series( dmo, 10 );
			Lowest lDmo = Lowest.Series( dmo, 10 );
			dmiStoch = 100 * ( dmo - lDmo ) / ( hDmo - lDmo );
			dmiStoch = SMA.Series( dmiStoch, 3 );
			dmiStoch.Description = "DMI Stochastic #1";
			ChartPane dmsPane = CreatePane( 30,true,true );
			PlotSeries( dmsPane, dmiStoch, Color.Red, LineStyle.Solid, 2 );

			Bars dmiBars = new Bars("DMI Bars (" + Bars.Symbol+")",Bars.Scale,Bars.BarInterval);
			for(int bar = 0; bar < Bars.Count; bar++)
			{
				dmiBars.Add( Bars.Date[bar], dmo[bar], dmo[bar], dmo[bar], dmo[bar], 0 );
			}

			dmiBars = Synchronize( dmiBars );									// DMI Stochastic - version #2
			DataSeries dmiStoch2 = StochD.Series( dmiBars, 10, 3 );
			dmiStoch2.Description = "DMI Stochastic #2";
			ChartPane dmsPane2 = CreatePane( 30,true,true );
			PlotSeries( dmsPane2, dmiStoch2, Color.Green, LineStyle.Solid, 2 );
			DrawHorzLine( dmsPane2, 10, Color.Blue, LineStyle.Dashed, 1 );
			DrawHorzLine( dmsPane2, 90, Color.Red, LineStyle.Dashed, 1 );
			HideVolume();

			for(int bar = GetTradingLoopStartBar(10); bar < Bars.Count; bar++)
			{
				SetBarColor( bar, dmo[bar] > 0 ? Color.DarkBlue : Color.Red );

				if (IsLastPositionActive)
				{
					Position p = LastPosition;

					if( paramExitType.ValueInt == 0 ) 							// Fixed bars
					{
						if ( bar+1 - p.EntryBar >= FixedBars )
							ExitAtMarket( bar+1, p, "Timed" );
					}
					else
					{															// Profitable/losing closes
						if( p.PositionType == PositionType.Long )
						{
							if( Bars.Close[bar] > p.EntryPrice )
								pBars++;
							else
								if( Bars.Close[bar] < p.EntryPrice )
									lBars++;
						}
						else
						{
							if( Bars.Close[bar] < p.EntryPrice )
								pBars++;
							else
								if( Bars.Close[bar] > p.EntryPrice )
									lBars++;
						}

						if( p.EntrySignal == "Pullback" )
						{
							if( pBars >= ProfitableClosesTrend )
								ExitAtMarket( bar+1, p, "Profitable Closes.Pullback" );
						}
						else
							if( p.EntrySignal == "Countertrend" )
						{
							if( pBars >= ProfitableClosesCounter )
								ExitAtMarket( bar+1, p, "Profitable Closes.CounterTrend" );
						}

						if( lBars >= LosingCloses )
							ExitAtMarket( bar+1, p, "Losing Closes" );
					}
				}
				else
				{
					Position p = null;

					// Pullback entries

					if( EntryType == 0 || EntryType == 1 )
					{
						if( dmo[bar] > 0 && CrossOver( bar, dmiStoch2, 10 ) )
							p = BuyAtMarket( bar+1, "Pullback" );
						if( dmo[bar] < 0 && CrossUnder( bar, dmiStoch2, 90 ) )
							p = ShortAtMarket( bar+1, "Pullback" );
					}

					// Countertrend entries

					if( EntryType == 0 || EntryType == 2 )
					{
						if( p == null )
						{
							if( CrossUnder( bar, dmo, 20 ) )
								p = ShortAtMarket( bar+1, "Countertrend" );
							else
								if( CrossOver( bar, dmo, -20 ) )
								p = BuyAtMarket( bar+1, "Countertrend" );
						}
					}

					if( p != null )
					{
						pBars = 0; lBars = 0;
					}
				}
			}
		}
	}
}
—Eugene
Wealth-Lab team
www.wealth-lab.com
BACK TO LIST

AMIBROKER: JANUARY 2013 TRADERS’ TIPS
CODE
In “The DMI Stochastic” in this issue,
Barbara Star presents a trading technique using the directional movement index
(DMI) and stochastic DMI.
A ready-to-use formula for the DMI is presented in Listing 1 and the formula
for stochastic DMI is given in Listing 2. To display these indicators, simply
type them in the Formula Editor and press “Apply indicator.” A
sample chart is shown in Figure 4.
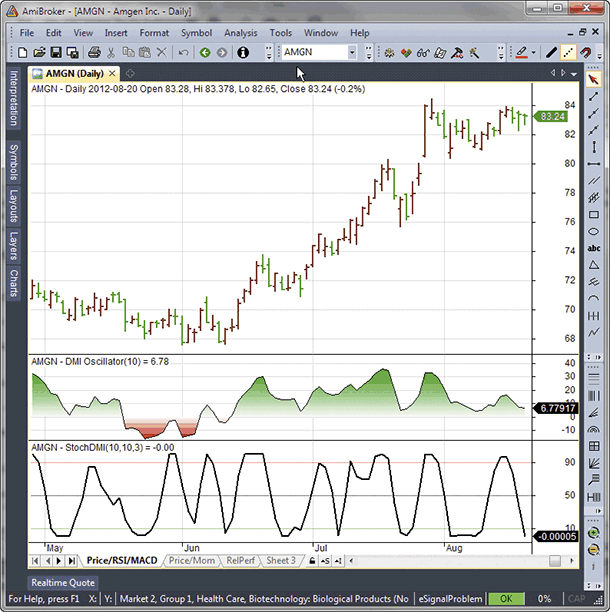
FIGURE 4: AMIBROKER. Here is a daily chart of AMGN with
the DMI oscillator (middle pane) and the stochastic DMI (bottom pane).
LISTING 1.
// DMI Oscillator
Version( 5.60 ); //

range = Param("range", 10, 2, 100 );
DMI = PDI( range ) - MDI( range );

SetGradientFill( colorGreen, colorRed, 0, GetChartBkColor() );
Plot( DMI, "DMI Oscillator" + _PARAM_VALUES(),
      colorDefault, styleLine | styleGradient );
LISTING 2.
function StochDMI( range, srange, smooth )
{
 DMI = PDI( range ) - MDI( range );

 Hd = HHV( DMI, srange );
 Ld = LLV( DMI, srange );

 FSDMI = 100 * Sum( DMI - Ld, smooth ) / Sum( Hd - Ld, smooth );

 return FSDMI;
}

range = Param("DMI range", 10, 1 );
srange = Param("Stoch range", 3, 1 );
smooth = Param("Smoothing range", 3, 1 );


Plot( StochDMI( range, 3, smooth ), "StochDMI" + _PARAM_VALUES(),         colorDefault, styleThick );
PlotGrid( 10, colorGreen );
PlotGrid( 90, colorRed );
PlotGrid( 50 );
—Tomasz Janeczko, AmiBroker.com
www.amibroker.com
BACK TO LIST

NEUROSHELL TRADER: JANUARY 2013
TRADERS’ TIPS CODE
The DMI stochastic and accompanying indicators described by Barbara Star in
her article in this issue, “The DMI Stochastic,” can
be easily implemented with a few of NeuroShell Trader’s 800+ indicators
and Advanced Indicator Set #2. Simply select “New indicator” from
the Insert menu and use the Indicator Wizard to set up the following indicators:
DMI Oscillator:  Subtract( PlusDI( High, Low, Close, 10 ), MinusDI( High, Low, Close, 10 ) )

DMI Stochastic:  Simple Stochastic Slow%D ( DMIOscillator, 10, 3, 3 )

UpTrend Entry:  And2( A>B( DMIOscillator, 0 ), CrossAbove( DMIStochastic, 10 ) )

DownTrend Entry:  And2( A<B( DMIOscillator, 0 ), CrossBelow( DMIStochastic, 90 ) )

Reversal Alert: Or2( MovAvgCrossAbove( DMIStochastic, 1, 3), MovAvgCrossBelow ( DMIStochastic, 1 ,3)

UpTrend Countertrend:  And2( A>B( DMIOscillator, 20 ), CrossBelow( DMIStochastic, 90 ) )

DownTrend Countertrend:  And2( A<B( DMIOscillator, -20 ), CrossAbove( DMIStochastic, 10 ) )
Users of NeuroShell Trader can go to the Stocks & Commodities section
of the NeuroShell Trader free technical support website to download a copy
of this or any past Traders’ Tips.
A sample chart is shown in Figure 5.
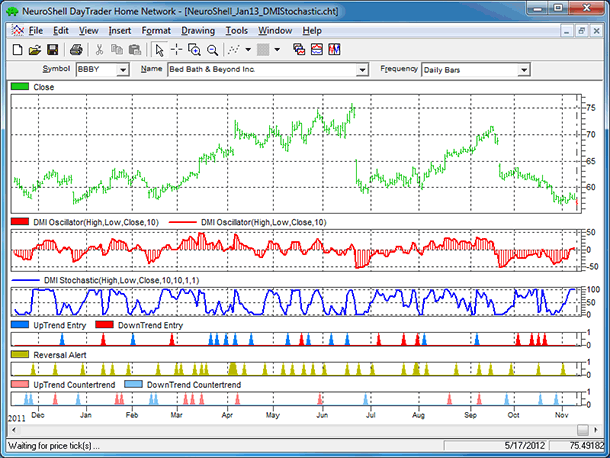
FIGURE 5: NEUROSHELL TRADER. This NeuroShell Trader chart
displays the DMI oscillator, DMI stochastic, trend, reversal, and countertrend
signals.
—Marge Sherald, Ward Systems Group, Inc.
301 662-7950, sales@wardsystems.com
www.neuroshell.com
BACK TO LIST

AIQ: JANUARY 2013 TRADERS’ TIPS
CODE
The AIQ code based on Barbara Star’s article in this issue, “The
DMI Stochastic,” is provided at www.TradersEdgeSystems.com/traderstips.htm.
To test the author’s DMI stochastic indicator, I used the NASDAQ 100
list of stocks and AIQ’s Portfolio Manager. A long-only trading simulation
was run with the following capitalization, cost, and exit settings:
- Maximum of 10 open positions
- Size each position at 10 % of mark-to-market total capital
- Take no more than three new positions per day
- Compute the mark-to-market capital each day
- Three cents per share was deducted for each round-turn trade
- Select trades based on the highest ADX reading
- Exit trades only with a system exit; no loss-stop or profit target stop
used.
I coded three similar test systems. The first is the basic system that uses
the author’s parameters of 10 (buy signal) and 90 (sell signal) on the
DMI stochastic indicator. A stock has a buy signal when it has both a positive
DMI oscillator and the DMI stochastic is below the buy level.
In Figure 6, I show the resulting long-only equity curve compared to the S&P
500 index for the basic system with the 10 buy-level parameter. For the period
12/30/1994 to 11/9/2012, the system returned an average internal rate of return
of 11.6% with a maximum drawdown of 68.7% on 2/6/2003 and a Sharpe ratio of
0.50.
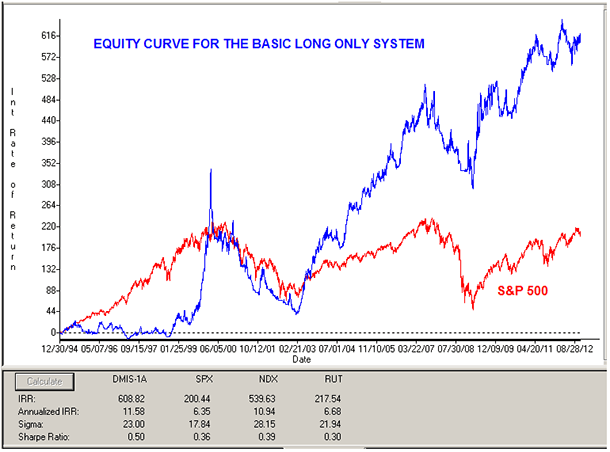
FIGURE 6: AIQ, BASIC SYSTEM VS. S&P 500. Here is
the long-only equity curve (blue) for the basic system compared to the S&P
500 (red) for the test period 12/30/1994 to 11/9/2012 trading the NASDAQ
100 list of stocks.
I also tried increasing the buy-level parameter up to 70, which improved the
return somewhat. I added a trend filter using the 50-bar moving average of
the S&P 500 index, but it resulted in a reduced return without improving
the maximum drawdown very much. The equity curve for this test is not shown.
For the period 12/30/1994 to 11/9/2012, this system returned an average internal
rate of return of 8.5% with a maximum drawdown of 46.1% on 10/2/1998 and a
Sharpe ratio of 0.46.
Finally, I tried adding an ADX filter such that the ADX level had to be above
30 to allow a signal. However, I also left the buy level at the high value
of 70. In Figure 7, I show the resulting long-only equity curve for the basic
system versus this modified ADX system. For the period 12/30/1994 to 11/9/2012,
the system returned an average internal rate of return of 12.1% with a maximum
drawdown of 56.1% on 2/6/2003 and a Sharpe ratio of 0.46.
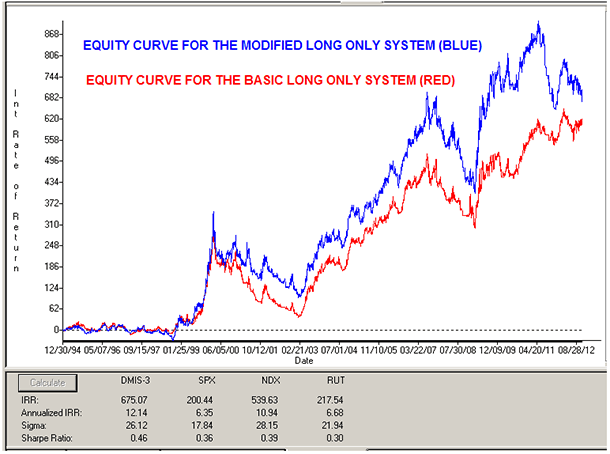
FIGURE 7: AIQ, BASIC SYSTEM VS. MODIFIED SYSTEM. Here,
the long-only equity curves are compared for the modified ADX system (blue)
versus the basic system (red) for the test period 12/30/1994 to 11/9/2012
trading the NASDAQ 100 list of stocks.
The code and EDS file can be downloaded from www.TradersEdgeSystems.com/traderstips.htm,
and is shown below.
!THE DMI STOCHASTIC
!Author: Barbara Star, TASC January 2013
!Coded by: Richard Denning 11/05/12
!www.TradersEdgeSystems.com

!INPUTS:
   wLen is 10.
   sLen is 3.
   buyLvl is 70.
   exitBuyLvl is 0.
   sellLvl is 55.
   exitSellLvl is 0.

!CODING ABREVIATIONS:
   H is [high].
   L is [low].
   C is [close].
   C1 is valresult(C,1).
   H1 is valresult(H,1).
   L1 is valresult(L,1).

! NOTE: Wilder to expontential averaging the formula is:
!  Wilder length * 2 - 1 = exponential averaging length
   eLen is wLen * 2 - 1.

!AVERAGE TRUE RANGE:
   TR  is Max(H-L,max(abs(C1-L),abs(C1-H))).
   ATR  is expAvg(TR,eLen).

!+DM -DM CODE:
   rhigh is (H-H1).
   rlow is (L1-L).
   DMplus is iff(rhigh > 0 and rhigh > rlow, rhigh, 0).
   DMminus is iff(rlow > 0 and rlow >= rhigh, rlow, 0).
   AvgPlusDM is expAvg(DMplus,eLen).
   AvgMinusDM is expavg(DMminus,eLen).

!DMI CODE:
   PlusDMI is (AvgPlusDM/ATR)*100.
   MinusDMI is AvgMinusDM/ATR*100.

!DMI OSCILATOR:
   DMIosc is PlusDMI - MinusDMI.   !Plot as historigram

!STOCHASTIC OF DMI:
   HH is highresult(DMIosc,wLen).
   LL is lowresult(DMIosc,wLen).
   DMI_STOCH is (DMIosc - LL) / (HH - LL) * 100.
   DMI_STO_SK is simpleavg(DMI_STOCH,sLen).
   DMI_STO_SD is simpleavg(DMI_STO_SK,sLen).  !Plot with 90/10 lines

!SYSTEM TO TEST INDICATOR:
 !BASIC SYSTEM WITH AUTHOR'S SUGGESTED PARAMETERS:
   Buy if DMIosc > 0 and DMI_STO_SD <= 10.
   ExitBuy if DMIosc < 0.
   Sell if DMIosc < 0 and DMI_STO_SD <= 90.
   ExitSell if DMIosc > 0.

 !SYSTEM WITH TREND FILTER AND MODIFIED PARAMETERS (LONG ONLY):
   SPXc is tickerUDF("SPX",C).
   SPXma is simpleavg(SPXc,50).
   BuyT if DMIosc > exitBuyLvl
	and DMI_STO_SD <= buyLvl
	and SPXma > valresult(SPXma,10).
   ExitBuyT if DMIosc < exitBuyLvl or SPXma < valresult(SPXma,10).

 !SYSTEM WITH TREND STRENGTH FILTER AND MODIFIED PARAMETERS (LONG ONLY):
   BuyADX if DMIosc > exitBuyLvl
	and DMI_STO_SD <= buyLvl
	and ADX > 30.
   ExitBuyADX if DMIosc < exitBuyLvl.

!SIGNAL RANKING( use ADX):
   ZERO if PlusDMI = 0 and MinusDMI = 0.
   DIsum is PlusDMI + MinusDMI.
   DX is iff(ZERO,100,abs(DMIosc)/DIsum*100).
   ADX is expavg(DX,eLen).

List if C > 0.
—Richard Denning
info@TradersEdgeSystems.com
for AIQ Systems
BACK TO LIST

TRADERSSTUDIO: JANUARY 2013 TRADERS’ TIPS
CODE
The TradersStudio code based on Barbara Star’s article in this issue, “The
DMI Stochastic,” is provided at the following websites:
The following code files are provided in the download:
- Function: “SD” is a helper function that returns the slow D
stochastic of the price inputs
- Function: “DMI_STOCHASTIC” is a function that returns the DMI
stochastic values
- Indicator plot: “DMI_OSC_IND” is the indicator code that plots
the DMI oscillator with a zero line
- Indicator plot: “DMI_STOCHASTIC_IND” is the indicator code
that plots the DMI stochastic indicator with two horizontal lines for the
buy and sell levels
- System: “DMI_STOCHASTIC_SYS” is a system of my design to test
the author’s indicator.
Parameters:
- lenDS = the length used for the DMI oscillator and the DMI stochastic indicators
- buyLvl = maximum value of DMI stochastic for a buy signal
- exitBuyLvl = minimum level on DMI oscillator before an exit for a long
is generated
- sellLvl = minimum value of DMI stochastic for a sell signal
- exitSellLvl = maximum level on DMI oscillator before an exit for a short
is generated
- longOnly — When set to 1, trade long only; when set to 2, trade short
only; when set to zero, trade both long and short.
The rules of the test system are simple. Go long when:
- The DMI oscillator is greater than the exit level for longs indicating
an uptrend, and
- The DMI stochastic is below the buy level.
- Exit longs when the DMI oscillator drops below the exit level for longs.
Go short when:
- The DMI oscillator is less than the exit level for shorts indicating a
downtrend, and
- The DMI stochastic is above the sell level.
- Exit shorts when the DMI oscillator rises above the exit level of shorts.
I set up a test session using the S&P 500 futures contract, SP, using
data from Pinnacle Data. I then optimized the parameters separately for the
long and short side. Note that I did not optimize the length of the DMI but
rather just used the author’s value of 10. Although trading both the
long and short side together resulted in more profit, the equity curve became
erratic compared to trading just the long side.
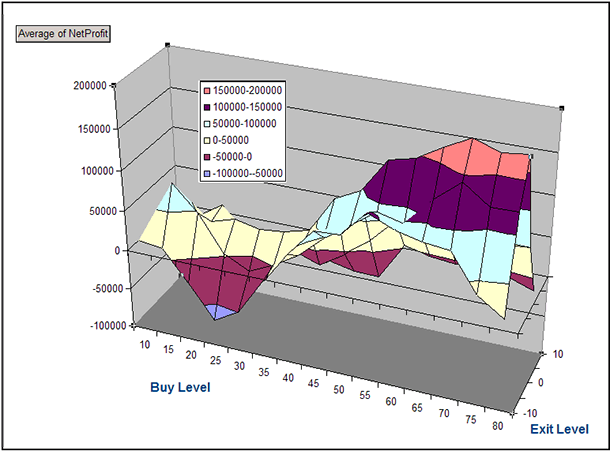
FIGURE 8: TRADERSSTUDIO. Here is a three-dimensional
parameter optimization graph for the system trading the S&P futures contract
for the period 1982 through 2012.
In Figure 8, I show the parameter optimization map for trading just the long
side with the system on the S&P contract from 4/21/1982 through 11/9/2012.
The buy-level parameters between 65 and 80 together with the exit buy levels
between -5 and +5 look good without any spikes in the map. I then ran a backtest
trading one contract for the same period with parameter set buy level = 70
and exit buy level = 0 trading long only. The resulting equity curve and underwater
equity curve are shown in Figure 9. The system returned a profit of $163,650
with a maximum drawdown of $64,150 on 9/25/2002.
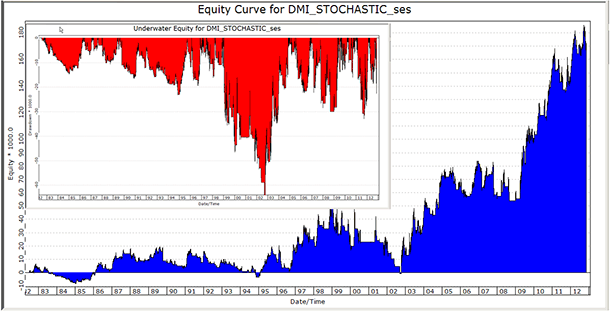
FIGURE 9: TRADERSSTUDIO. Here are the equity & underwater
equity curves for the system using one of the better parameter sets from
the optimization tests (buy level = 70, exit buy level = 0, long only).
'THE DMI STOCHASTIC
'Author: Barbara Star, TASC January 2013
'Coded by: Richard Denning 11/05/12
'www.TradersEdgeSystems.com

Function SD(priceH As BarArray, priceL As BarArray, priceC As BarArray, stochLen, smoLen1, smoLen2)
 Dim HH As BarArray
 Dim LL As BarArray
 Dim Stoch As BarArray
 Dim SK As BarArray
 HH = Highest(priceH,stochLen,0)
 LL = Lowest(priceL,stochLen,0)
 If HH - LL <> 0 Then Stoch = (priceC - LL) / (HH - LL) * 100
 SK = Average(Stoch,smoLen1)
 SD = Average(SK,smoLen2)
End Function
'-------------------------------------------------------------

Function DMI_STOCHASTIC(lenDS)
 Dim DMIosc As BarArray
 DMIosc = dmiplus(lenDS,0) - dmiminus(lenDS,0)
 DMI_STOCHASTIC = SD(DMIosc,DMIosc,DMIosc,lenDS,3,3)
End Function
'-------------------------------------------------------------

Sub DMI_OSC_IND(lenDMI)
 plot1(dmiplus(lenDMI,0)-dmiminus(lenDMI,0))
 plot2(0)
End Sub
'-------------------------------------------------------------

Sub DMI_STOCHASTIC_IND(lenDS,buyLvl,sellLvl)
 plot1(DMI_STOCHASTIC(lenDS))
 PLOT2(buyLvl)
 plot3(sellLvl)
End Sub
'-------------------------------------------------------------

Sub DMI_STOCHASTIC_SYS(lenDS,buyLvl,exitBuyLvl,sellLvl,exitSellLvl,longOnly)
 'lenDS=10,buyLvl=70,exitBuyLvl=0,sellLvl=55,exitSellLvl=0,longOnly=2
 Dim DMIosc As BarArray
 Dim DMI_STOCH As BarArray
 DMI_STOCH = DMI_STOCHASTIC(lenDS)
 DMIosc = dmiplus(lenDS,0)-dmiminus(lenDS,0)

 If longOnly = 1 Or longOnly = 0 Then
    If DMIosc > exitBuyLvl And DMI_STOCH <= buyLvl Then Buy("LE",1,0,Market,Day)
    If DMIosc < exitBuyLvl Then ExitLong("LX","LE",1,0,Market,Day)
 End If
 If longOnly = 2 Or longOnly = 0 Then
    If DMIosc < exitSellLvl And DMI_STOCH >= sellLvl Then Sell("SE",1,0,Market,Day)
    If DMIosc > exitSellLvl Then ExitShort("SX","SE",1,0,Market,Day)
 End If

End Sub
—Richard Denning
info@TradersEdgeSystems.com
for TradersStudio
BACK TO LIST

NINJATRADER: JANUARY 2013 TRADERS’ TIPS
CODE
The indicators DMIOscillator and DMIStochasticExtreme, as discussed in “The
DMI Stochastic” by Barbara Star in this issue, has been implemented
as an indicator available for download at www.ninjatrader.com/SC/January2013SC.zip.
Once you have downloaded it, from within the NinjaTrader Control Center window,
select the menu File → Utilities → Import NinjaScript and select
the downloaded file. This file is for NinjaTrader version 7 or greater.
You can review the indicator source code by selecting the menu Tools → Edit
NinjaScript → Indicator from within the NinjaTrader Control Center window
and selecting DMIOscillator or DMIStochasticExtreme.
NinjaScript uses compiled DLLs that run native, not interpreted, which provides
you with the highest performance possible.
A sample chart implementing the strategy is shown in Figure 10.
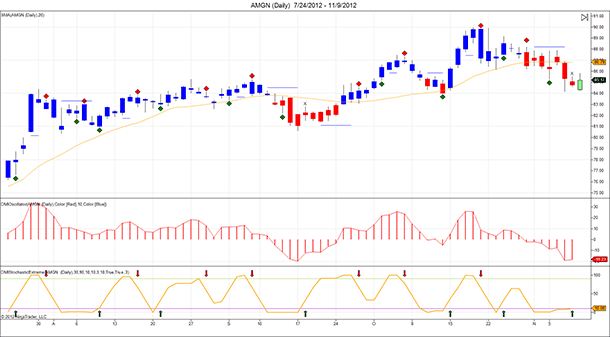
FIGURE 10: NINJATRADER. This screenshot shows the DMIOscillator
and DMI-StochasticExtreme applied to a daily chart of Amgen Inc. (AMGN).
—Raymond Deux & Ryan Millard
NinjaTrader, LLC
www.ninjatrader.com
BACK TO LIST

UPDATA: JANUARY 2013 TRADERS’ TIPS
CODE
This tip is based on “The DMI Stochastic” by
Barbara Star in this issue.
In the article, Star derives two new indicators from the classic directional
movement index (DMI). The first is an oscillator based on the difference between
the +DI and -DI lines (DMI oscillator). The second parameterizes the DMI oscillator
with a stochastic. The end result is two oscillators that capture three technical
analysis basics: trend, momentum, and support/resistance, which can help to
time trade entries and exits better.
The Updata code for this indicator has been entered in the Updata Library
and may be downloaded by clicking the Custom menu and then Indicator Library.
Those who cannot access the library due to a firewall may paste the code shown
here into the Updata Custom editor and save it.
PARAMETER "DirMov Period" #Period=14
PARAMETER "Stoch. Period" #StochPer=10
PARAMETER "Stoch. Avg." #AvgPer=3
PARAMETER "Stoch. Buy" #StochBUY=10
PARAMETER "Stoch. Sell" #StochSELL=90
DISPLAYSTYLE 7LINES
INDICATORTYPE TOOL
INDICATORTYPE5 Chart
PLOTSTYLE CANDLE
COLOUR6 RGB(200,0,0)
COLOUR7 RGB(200,0,0)
@DirMovPlusDI=0
@DirMovMinusDI=0
@DirMovOsc=0
@Num=0
@Denom=0
@StochHigh=0
@StochLow=0
@StochAvg=0
NAME "DMI-Osc Candles" ""
NAME5 "DMI-Stoch. Avg. [" #Period "|" #AvgPer "]" ""
FOR #CURDATE=#Period To #LASTDATE
   @DirMovPlusDI=DirMov(#Period,PlusDI)
   @DirMovMinusDI=DirMov(#Period,MinusDI)
   '1st Indicator
   @DirMovOsc=@DirMovPlusDI-@DirMovMinusDI
   @StochHigh=PHIGH(@DirMovOsc,#StochPer)
   @StochLow=PLOW(@DirMovOsc,#StochPer)
   @Num=SGNL(@DirMovOsc-@StochLow,#StochPer,M)*#StochPer
   @Denom=SGNL(@StochHigh-@StochLow,#StochPer,M)*#StochPer
   '2nd Indicator
   @StochAvg=SGNL(100*@Num/@Denom,#AvgPer,M)
   'Colour Candle According to DMI Osc
   If @DirMovOsc>0
      COLOUR RGB(0,0,200)
      @PlotOpen=Open
      @PlotHigh=High
      @PlotLow=Low
      @Plot=Close
   Else
      COLOUR RGB(200,0,0)
      @PlotOpen=Open
      @PlotHigh=High
      @PlotLow=Low
      @Plot=Close
   EndIf
   @Plot5=@StochAvg
   @Plot6=#StochBUY
   @PLot7=#StochSELL
NEXT
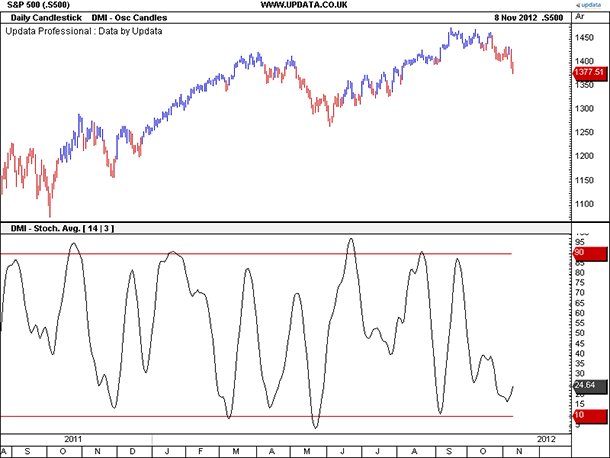
FIGURE 11: UPDATA. This chart shows the daily S&P
500 index with candles colored according to the DMI oscillator above/below
zero. The lower chart shows the 14-period DMI stochastic (smoothed three
periods).
—Updata support team
support@updata.co.uk
www.updata.co.uk
BACK TO LIST

TRADESIGNAL: JANUARY 2013 TRADERS’ TIPS
CODE
The indicators discussed in “The DMI Stochastic” by
Barbara Star in this issue can easily be used with our online charting tool
at www.tradesignalonline.com. Just check the Infopedia section for our lexicon.
You will see the indicator and the functions, which you can make available
for your personal account. Click on it and select “open script.” You
can then apply the indicator to any chart you wish (Figure 12).
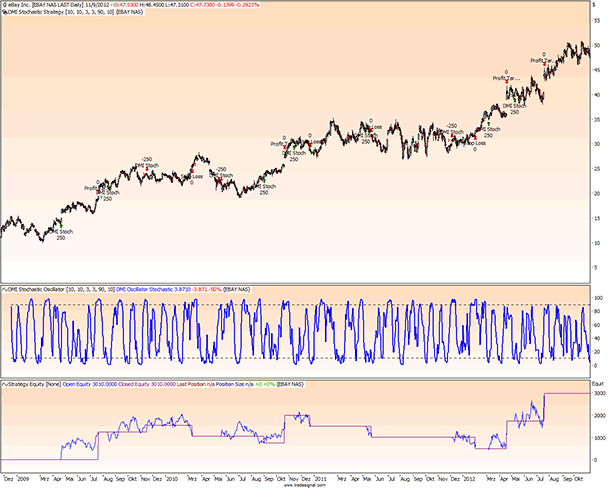
FIGURE 12: TRADESIGNAL ONLINE. Here, the DMI stochastic
oscillator and the DMI stochastic strategy are displayed on a daily chart
of eBay.
Source code for DMI
stochastic oscillator.eqi
Meta:
	Subchart( True ),
	Synopsis("The DMI Stochastic Oscillator based on Barbara Stars 01/2013 Article in Technical Analysis of Stocks and Commodities"),
	Weblink("https://www.tradesignalonline.com/lexicon/edit.aspx?id=19093");

Inputs:
	DMI_Period( 10 , 1 ),
	STO_Period( 10 , 1 ),
	STO_Fast_Smooth( 3 , 1 ),
	STO_Slow_Smooth( 3 , 1 ),
	Overbought_Level( 90 , 1 ),
	Oversold_Level( 10 , 1 );

Vars:
	dmiOscillator, dmiStochastic;

dmiOscillator = DMO( DMI_Period );
StochasticExp( dmiOscillator, dmiOscillator, dmiOscillator, STO_Period, STO_Fast_Smooth, STO_Slow_Smooth, dmiStochastic, value1 );

DrawLine( dmiStochastic, "DMI Oscillator Stochastic", StyleSolid, 2, Blue );
DrawLIne( Overbought_Level, "Over Bought", StyleDash, 1, Black );
DrawLIne( Oversold_Level, "Over Sold", StyleDash, 1, Black );

// *** Copyright tradesignal GmbH ***
// *** www.tradesignal.com ***
Source code for DMI
stochastic strategy.eqs
Meta:
	Subchart( False ),
	Synopsis("The DMI Stochastic Oscillator Strategy based on Barbara Stars 01/2013 Article in Technical Analysis of Stocks and Commodities"),
	Weblink("https://www.tradesignalonline.com/lexicon/edit.aspx?id=19093");

Inputs:
	DMI_Period( 10 , 1 ),
	STO_Period( 10 , 1 ),
	STO_Fast_Smooth( 3 , 1 ),
	STO_Slow_Smooth( 3 , 1 ),
	Overbought_Level( 90 , 1 ),
	Oversold_Level( 10 , 1 );

Vars:
	dmiOscillator, dmiStochastic, longSig, shortSig;

dmiOscillator = DMO( DMI_Period );
StochasticExp( dmiOscillator, dmiOscillator, dmiOscillator, STO_Period, STO_Fast_Smooth, STO_Slow_Smooth, dmiStochastic, value1 );

longSig = dmiOscillator > 0 And dmiStochastic < Oversold_Level And Close > Open;
shortSig = dmiOscillator < 0 And dmiStochastic > Overbought_Level And Close < Open;

If longSig Then
	Buy("DMI Stoch") Next Bar at Market
Else If shortSig Then
	Short("DMI Stoch") Next Bar at Market;

// *** Copyright tradesignal GmbH ***
// *** www.tradesignal.com ***
—Henning Blumenthal, Tradesignal GmbH
support@tradesignalonline.com
www.TradesignalOnline.com, www.Tradesignal.com
BACK TO LIST

SHARESCOPE: JANUARY 2013 TRADERS’ TIPS
CODE
We’ve provided two short scripts for the DMI oscillator and DMI stochastic
devised and discussed by Barbara Star in her article in this issue, “The
DMI Stochastic.” A dialog box enables you to adjust the period length
of each indicator if you prefer.
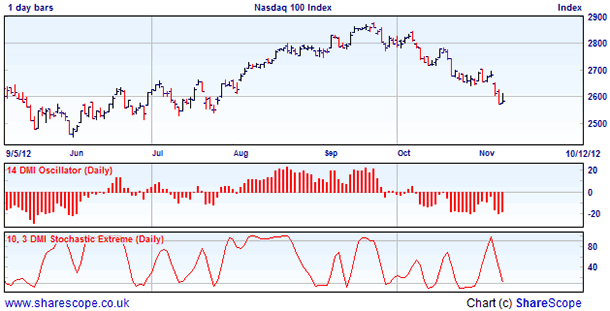
FIGURE 13: SHARESCOPE. Here’s an example of the
DMI oscillator and DMI stochastic implemented in ShareScope.
When adding indicators to a chart in ShareScope (Figure 13), it is normal
to use the same price periods as the main chart (daily, weekly, or monthly).
However, you can add daily, weekly, and monthly indicators to the chart if
it aids analysis.
DMI
Oscillator
//@Name:DMI Oscillator
//@Description:As described on Stocks & Commodities magazine, Jan 2013 issue.
var period = 14;
function init(status){
	if (status == Loading || status == Editing)
		period = storage.getAt(0);
	if (status == Adding || status == Editing){
		dlg = new Dialog("Settings...", 145, 55);
		dlg.addOkButton();
		dlg.addCancelButton();
		dlg.addIntEdit("INT1",8,-1,-1,-1,"","Period",period,2,1000);
		if (dlg.show()==Dialog.Cancel)
			return false;
		period = dlg.getValue("INT1");
		storage.setAt(0, period);
	}
	setSeriesColour(0, Colour.Red);
	setSeriesChartType(0, ChartType.Histogram);
	setTitle(period+" DMI Oscillator");
	setHorizontalLine(0);
}
function getGraph(share, data){
	var dmio = [];
	var adx1 = new ADX(period);
	for (var i=1; i<data.length; i++){
		adx1.next(data[i]);
		dmio[i] = adx1.getPDI()-adx1.getNDI();
	}
	return dmio;
}
DMI
Stochastic
//@Name:DMI Stoch Extreme
//@Description:DMI Stochastic Extreme. As described on Stocks & Commodities magazine, Jan 2013 issue.
var stochPeriod = 10;
var stochSlow = 3;
function init(status){
	if (status == Loading || status == Editing){
		stochPeriod = storage.getAt(0);
		stochSlow = storage.getAt(1);
	}
	if (status == Adding || status == Editing){
		dlg = new Dialog("Settings...", 165, 55);
		dlg.addOkButton();
		dlg.addCancelButton();
		dlg.addIntEdit("INT1",8,-1,-1,-1,"","DMI Stoch Period",stochPeriod,2,1000);
		dlg.addIntEdit("INT2",8,-1,-1,-1,"","DMI Stoch Slow",stochSlow,1,1000);
		if (dlg.show()==Dialog.Cancel)
			return false;
		stochPeriod = dlg.getValue("INT1");
		stochSlow = dlg.getValue("INT2");
		storage.setAt(0, stochPeriod);
		storage.setAt(1, stochSlow);
	}
	setSeriesColour(0, Colour.Red);
	setTitle(stochPeriod+", "+stochSlow+" DMI Stochastic Extreme");
	setHorizontalLine(90);
	setHorizontalLine(10);
}
function getGraph(share, data){
	var adx1 = new ADX(stochPeriod);
	var stoc1 = new StochOsc(stochPeriod,stochSlow,2);
	var dmise = [];
	for (var i=1; i<data.length; i++){
		adx1.next(data[i]);
		var dmio = adx1.getPDI()-adx1.getNDI();
		var temp = {open:dmio,high:dmio,low:dmio,close:dmio,volume:0};
		stoc1.next(temp);
		dmise[i] = stoc1.getMain();
	}
	return dmise;
}
—Tim Clarke
ShareScope
www.sharescript.co.uk
BACK TO LIST

TRADE NAVIGATOR: JANUARY 2013 TRADERS’ TIPS
CODE
Trade Navigator offers everything needed to recreate the indicators and highlight
bars discussed in “The DMI Stochastic” by
Barbara Star in this issue.
The TradeSense code for the indicators and highlight bars, as well as step-by-step
instructions for inputting the TradeSense code into Trade Navigator and displaying
the indicator on a chart (Figure 14), are shown below.
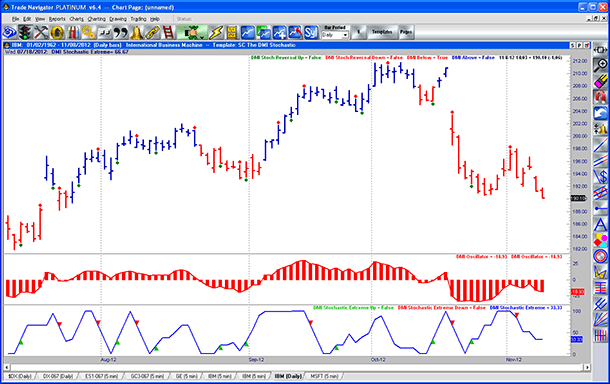
FIGURE 14: TRADE NAVIGATOR. Here’s an example of
the DMI stochastic and highlight bars on a Trade Navigator chart.
First, open the Trader’s Toolbox, click on the Functions tab
and click the New button.
DMI Above (Highlight Bar):
Type in the following code:
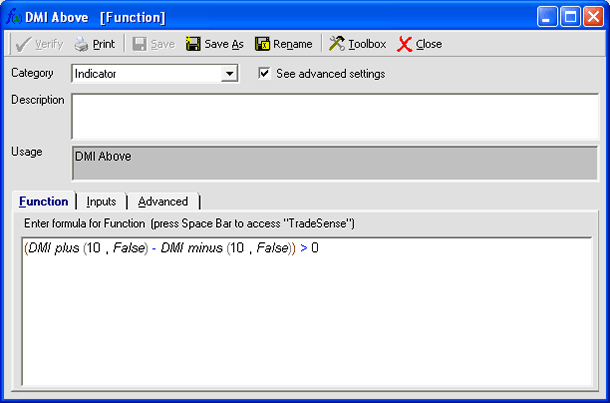
(DMI plus (10 , False) - DMI minus (10 , False)) > 0
Click the Verify button.
When you are finished, click on the Save button, type a name
for your new function and click OK.
Repeat these steps for the DMI Below, DMI Oscillator, DMI
Stoch Reversal Down, DMI Stoch Reversal Up, DMI
Stochastic Extreme, DMI Stochastic Extreme Down and DMI
Stochastic Extreme Up functions using the following code.
DMI Below (Highlight Bar):
(DMI plus (10 , False) - DMI minus (10 , False)) < 0
DMI Oscillator (Indicator):
DMI plus (10 , False) - DMI minus (10 , False)
DMI Stoch Reversal Down (Highlight Bar):
Crosses Below (MovingAvg (Stochastic Custom (DMI plus (10 , False) - DMI minus (10 , False) , 3) , 3) , MovingAvg (MovingAvg (Stochastic Custom (DMI plus (10 , False) - DMI minus (10 , False) , 3) , 3) , 3))
DMI Stoch Reversal Up (Highlight Bar):
Crosses Above (MovingAvg (Stochastic Custom (DMI plus (10 , False) - DMI minus (10 , False) , 3) , 3) , MovingAvg (MovingAvg (Stochastic Custom (DMI plus (10 , False) - DMI minus (10 , False) , 3) , 3) , 3))
DMI Stochastic Extreme (Indicator):
MovingAvg (Stochastic Custom (DMI plus (10 , False) - DMI minus (10 , False) , 3) , 3)
DMI Stochastic Extreme Down (Highlight Bar):
Crosses Below (MovingAvg (Stochastic Custom (DMI plus (10 , False) - DMI minus (10 , False) , 3) , 3) , 91)
DMI Stochastic Extreme Up (Highlight Bar):
Crosses Above (MovingAvg (Stochastic Custom (DMI plus (10 , False) - DMI minus (10 , False) , 3) , 3) , 10)
When you are finished, click on the Save button, type a name
for your new function and click OK.
Creating the Chart
Now that we have the functions, on a daily chart go to the Add to Chart window
by clicking on the chart and typing A on the keyboard.
Click on the Indicators tab, find the DMI Oscillator indicator
in the list and either double click on it or highlight the name and click the Add button.
Repeat these steps for the DMI Stochastic Extreme indicators.
Add a second copy of the DMI Oscillator.
Click on the name of one of the the DMI Oscillator indicators
on the chart and drag it into the same pane as the other DMI Oscillator.
Go to the Add to Chart window again. Click on the HighlightBars tab.
Find the DMI Above, DMI Below, DMI
Stoch Reversal Down and DMI Stoch Reversal Up Highlight
bars and add them to the chart. When you are adding the DMI Stoch Reversal
Down and DMI Stoch Reversal Up Highlight bars change
them to Highlight Markers.
Type the letter ‘E’ on your keyboard to bring
up the Chart Settings window.
Highlight each indicator and/or highlight bar and change it to the desired
color in the chart settings window.
Select one of the DMI Oscillator indicators and change the
type to Histogram.
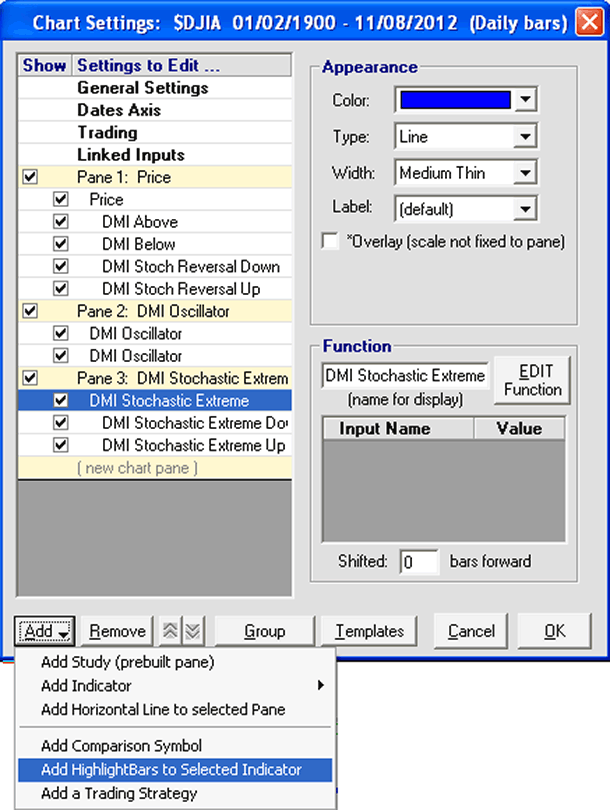
Highlight the DMI Stochastic Extreme indicator, then click
the Add button at the bottom of the Chart Settings window,
and select Add HighlightBars to Selected Indicator.
Highlight the DMI Stochastic Extreme Down and DMI
Stochastic Extreme Up in the list and click the Add button.
Once you have the indicators and highlight bars set the way you want them
you can click the OK button.
You can create Studies of each of the panes on the chart. Go back into the
Chart Settings window. Highlight the pane title you wish to make into a study.
With the pane selected click the Save Study button at the
bottom of the Chart Settings window. Type a name for the study and a description
then click Save.
Now that you have the chart the way you want it, click on the Templates button
in the toolbar and select <Manage chart templates>, click the New button,
type a name for your template and click OK.
Genesis Financial Technologies is providing a library called “DMI Stochastic” that
includes the custom indicators, highlight bars, and studies discussed in Star’s
article. It also contains a template and a chart page to make it easier for
you view these indicators. You can download the special file named “C201301” from
within Trade Navigator to get this library.
—Michael Herman
Genesis Financial Technologies
www.TradeNavigator.com
BACK TO LIST

VT TRADER: JANUARY 2013 TRADERS’ TIPS
CODE
Our Traders’ Tip this month is based on “The
DMI Stochastic” by Barbara Star in this issue. In this article,
Star introduces us to her DMI oscillator and DMI stochastic and describes
some of the trading techniques she uses with them.
We’ll be offering the DMI oscillator and DMI stochastic for download
in our VT client forums at https://forum.vtsystems.com along
with hundreds of other precoded and free indicators and trading systems. In
addition, instructions for recreating Star’s indicators in VT Trader
are shown below.
DMI Oscillator
- VT Trader’s Ribbon→Technical Analysis menu→Indicators group→Indicators
Builder→[New] button
- In the General tab, type the following text into each corresponding text
box:
Name: TASC - 01/2013 - DMI Oscillator
Function Name Alias: tasc_DmiOsc
Label Mask: TASC - 01/2013 - DMI Oscillator (%Pr%) = %Hist%
Placement: New Frame
Data Inspection Alias: DMI Osc
- In the Input Variable(s) tab, create the following variables:
[New] button...
Name: Pr
Display Name: DMI Periods
Type: integer
Default: 10
- In the Output Variable(s) tab, create the following variables:
[New] button...
Var Name: Hist
Name: (DMI Histogram)
Line Color: red
Line Width: 1
Line Type: histogram

[New] button...
Var Name: HistMa
Name: (Histogram 1-Period MA)
Line Color: red
Line Width: 1
Line Type: solid
- In the Horizontal Line tab, create the following horizontal lines:
[New] button...
Value: +20
Line Color: dark red
Line Width: thin
Line Type: dashed

[New] button...
Value: -20
Line Color: dark red
Line Width: thin
Line Type: dashed
- In the Formula tab, copy and paste the following formula:
{Provided By: Visual Trading Systems, LLC}
{Copyright: 2013}
{Description: TASC, January 2013 - "Getting Into The Game, The DMI Stochastic" by Barbara Star, PhD}
{File: tasc_DmiOsc.vtscr - Version 1.0}

{DMI Oscillator}

PlusDI:= vt_DMI(Pr).PlusDI;
MinusDI:= vt_DMI(Pr).MinusDI;
Hist:= PlusDI - MinusDi;
HistMa:= Mov(Hist,1,S);
- Click the “Save” icon in the toolbar to finish building the
DMI Oscillator indicator.
To attach the indicator to a chart click the right mouse button within the
chart window and then select “Add Indicator” → “TASC
- 01/2013 - DMI Oscillator” from the indicator list.
DMI Stochastic
- VT Trader’s Ribbon→Technical Analysis menu→Indicators group→Indicators
Builder→[New] button
- In the General tab, type the following text into each corresponding text
box:
Name: TASC - 01/2013 - DMI Stochastic
Function Name Alias: tasc_DmiStoch
Label Mask: TASC - 01/2013 - DMI Stochastic (%Pr%,%K%,%Sl%,%D%) = %DmiStDK%, %DmiStDD%
Placement: New Frame
Data Inspection Alias: DMI Stoch
- In the Input Variable(s) tab, create the following variables:
[New] button...
Name: Pr
Display Name: DMI Periods
Type: integer
Default: 10

[New] button...
Name: K
Display Name: DMI Stochastic Periods
Type: integer
Default: 10

[New] button...
Name: Sl
Display Name: DMI Stochastic %K Slowing Periods
Type: integer
Default: 3

[New] button...
Name: D
Display Name: DMI Stochastic %D MA Periods
Type: integer
Default: 3
- In the Output Variable(s) tab, create the following variables:
[New] button...
Var Name: DmiStDK
Name: (DMI Stochastic)
Line Color: dark blue
Line Width: 1
Line Type: solid

[New] button...
Var Name: DmiStDD
Name: (DMI Stochastic MA)
Line Color: blue
Line Width: 1
Line Type: dashed
- In the Horizontal Line tab, create the following horizontal lines:
[New] button...
Value: +90
Line Color: red
Line Width: thin
Line Type: dashed

[New] button...
Value: -10
Line Color: red
Line Width: thin
Line Type: dashed
- In the Formula tab, copy and paste the following formula:
{Provided By: Visual Trading Systems, LLC}
{Copyright: 2013}
{Description: TASC, January 2013 - "Getting Into The Game, The DMI Stochastic" by Barbara Star, PhD}
{File: tasc_DmiStoch.vtscr - Version 1.0}

{DMI Oscillator}

PlusDI:= vt_DMI(Pr).PlusDI;
MinusDI:= vt_DMI(Pr).MinusDI;
Hist:= PlusDI - MinusDi;

{DMI Stochastic}

DmiStK:= ((Hist-LLV(Hist,K))/(HHV(Hist,K)-LLV(Hist,K)))*100;
DmiStDK:= Mov(DmiStK,Sl,S);
DmiStDD:= Mov(DmiStDK,D,S);
- Click the “Save” icon in the toolbar to finish building the
DMI Stochastic indicator.
To attach the indicator to a chart click the right mouse button within the
chart window and then select “Add Indicator” → “TASC
- 01/2013 - DMI Stochastic” from the indicator list.
A sample chart is shown in Figure 15.
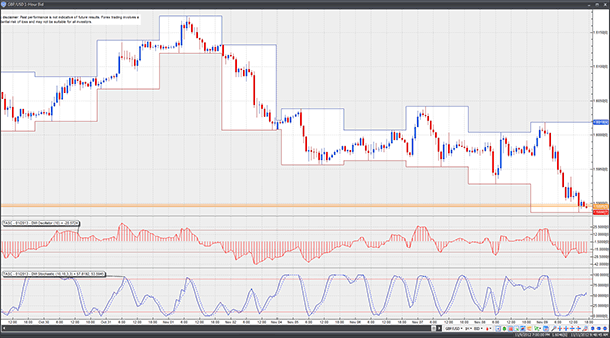
FIGURE 15: VT TRADER. Here, the DMI oscillator and DMI
stochastic are attached to a GBP/USD one-hour candlestick chart.
Risk disclaimer: Past performance is not indicative of future results.
Forex trading involves a substantial risk of loss and may not be suitable
for all investors.
—Visual Trading Systems, LLC
vttrader@vtsystems.com, www.vtsystems.com
BACK TO LIST
MICROSOFT EXCEL: JANUARY 2013 TRADERS’ TIPS
CODE
In “The DMI Stochastic” in this issue,
author Barbara Star’s approach is to use variations on the DMI to extract
a lot of information from the price action.
As you can see by the sample Excel chart in Figure 16, things get a little
busy when you put markers for all of Star’s indicators on the chart.
Thus, I have provided some checkbox controls to allow you to display various
combinations at your option.
Excel has no reasonable way to dynamically color candlesticks according to
conditions found in the data. As a workaround, I have used two dummy series
plotted as vertical bars to provide background coloration on the price chart
in the areas that correspond to Star’s blue and red price bars.
The spreadsheet file for this Traders’ Tip can be downloaded here.
To successfully download it, follow these steps:
- Right-click on the Excel file link, then
- Select “Save target as” to place a copy of the spreadsheet
file on your hard drive.
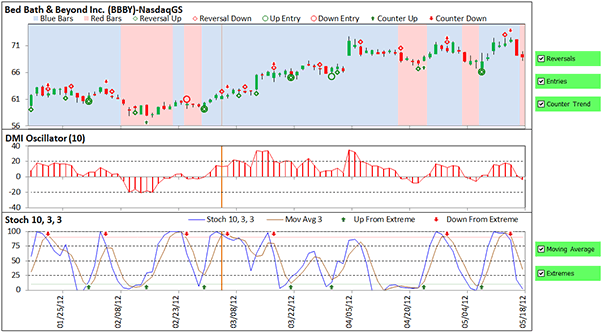
FIGURE 16: EXCEL. Things get a little busy if you include
all of the potential signal information that Barbara Star describes in her
article.
—Ron McAllister
Excel and VBA programmer
rpmac_xltt@sprynet.com
BACK TO LIST
Originally published in the January 2013 issue of
Technical Analysis of Stocks & Commodities magazine.
All rights reserved. © Copyright 2012, Technical Analysis, Inc.
Return to
Contents


