TRADERS’ TIPS
Here is this month’s selection of Traders’ Tips, contributed by
various developers of technical analysis software to help readers more easily
implement some of the strategies presented in this and other issues.
Other code appearing in articles in this issue is posted in the Subscriber
Area of our website at https://technical.traders.com/sub/sublogin.asp.
Login requires your last name and subscription number (from mailing label).
Once logged in, scroll down to beneath the “Optimized trading systems” area
until you see “Code from articles.” From there, code can be copied
and pasted into the appropriate technical analysis program so that no retyping
of code is required for subscribers.
You can copy these formulas and programs for easy use in your spreadsheet
or analysis software. Simply “select” the desired text
by highlighting as you would in any word processing program, then use your
standard key command for copy or choose “copy” from the browser
menu. The copied text can then be “pasted” into any open spreadsheet
or other software by selecting an insertion point and executing a paste command.
By toggling back and forth between an application window and the open web
page, data can be transferred with ease.
For this month’s Traders’ Tips, the focus is Sylvain Vervoort’s article in this issue, “The 1-2-3 Wave Count.” Here we present the June 2013 Traders’ Tips code with possible implementations in various software.
Source code for NinjaTrader is already provided in Vervoort’s article, and subscribers will find this code in the Subscriber Area of our website, Traders.com. (Click on “Article Code” from our homepage.) Presented here is additional code and possible implementations for other software.

TRADESTATION: JUNE 2013 TRADERS’ TIPS CODE
In “The 1-2-3 Wave Count” in this issue, author Sylvain Vervoort describes the construction and use of an indicator to plot a zigzag of highs and lows. The author also provides information for numbering the waves as well as expectations for future moves of the security based on the wave patterns observed.
We are providing the code for an EasyLanguage indicator that draws the zigzag lines based on the data highs and lows, following the logic found in the NinjaTrader code given in Vervoort’s article. Inputs were coded to allow for adjustment of several calculation parameters as well as the color and thickness of the trendlines drawn on the chart.
To download the EasyLanguage code, first navigate to the EasyLanguage FAQs and Reference Posts Topic in the EasyLanguage support forum (https://www.tradestation.com/Discussions/Topic.aspx?Topic_ID=47452), scroll down, and click on the link labeled “Traders’ Tips, TASC.” Then select the appropriate link for the month and year. The ELD filename is “_SVEHLZZperc.ELD.” The code is also shown below.
A sample chart is shown in Figure 1.
_SVEHLZZperc (Indicator)

{ TASC Article, June 2013 }
{ "The 1-2-3 Wave Count" }
{ Sylvain Vervoort }

using elsystem ;

inputs:
	double ZZPercent( 5 ), { 0 = no influence; enter
	 in percentage points; for 1% enter 1, Not 0.01  }
	int ATRPeriod( 5 ), { number of bars for ATRCalc
	 calc }
	double ATRFactor( 1.5 ), { 0 = no ATR influence }
	int ZigZagColor( Cyan ), { trendline color }
	int LineWidth( 1 ) ; { trendline thickeness }

variables:
	double ATRCalc( 0 ),
	intrabarpersist int trend( 1 ), { confirmed trend
	 of current zigzag, 1 = up, -1 = down (assume
	 trend is up at the start) }
	int LHBDate( 0 ),
	int LHBTime( 0 ),
	intrabarpersist int uplineid( 0 ),
	int LLBDate( 0 ),
	int LLBTime( 0 ),
	intrabarpersist int downlineid( 0 ),
	intrabarpersist double HH( 0 ),
	intrabarpersist double LL( 0 ),
	intrabarpersist double HLPivot( 0 ) ;

method void DrawUpLine()
	begin
	uplineid = TL_New( LLBDate, LLBTime, LL, LHBDate,
	 LHBTime, HH ) ;
	FormatTL( uplineid ) ;
	end ;

method void DrawDnLine()
	begin
	downlineid = TL_New( LHBDate, LHBTime, HH,
	 LLBDate, LLBTime, LL ) ;
	FormatTL( downlineid ) ;
	end ;

method void FormatTL( int TLID )
	begin
	TL_SetColor( TLID, ZigZagColor ) ;
	TL_SetSize( TLID, LineWidth ) ;
	end ;

once
	begin
	if ATRPeriod <= 0 then
		RaiseRuntimeError( "ATRPeriod input must " +
		 "be greater than 0." ) ;
	LLBDate = Date ;
	LLBTime = Time ;
	LHBDate = Date ;
	LHBTime = Time ;
	LL = Low ;
	HH = High ;
	end ;

ATRCalc = AvgTrueRange( ATRPeriod ) ;

if ATRFactor = 0 then { only use percent setting }
	HLPivot = ZZPercent * 0.01
else if ZZPercent = 0 then { only use ATR }
	HLPivot = ATRCalc / Close * ATRFactor
else { use ATR and ZZPercent }
	HLPivot = ZZPercent * 0.01 + ATRCalc / Close *
	 ATRFactor ;

{ look for swing points and draw lines }
if trend > 0 then { trend is up, look for new swing
 low }
	begin
	if High >= HH then { new higher high detected }
		begin
		HH = High ;
		LHBDate = Date ;
		LHBTime = Time ;
		if uplineid <> 0 then
			TL_Delete( uplineid ) ;
		DrawUpLine() ;
		end
	else if Low < HH - HH * HLPivot then { found a
	 swing low }
		begin
		LL = Low ;
		LLBDate = Date ;
		LLBTime = Time ;
		trend = -1 ;
		DrawDnLine() ;
		end ;
	end
else { trend is down, look for new swing high }
	begin
	if Low <= LL then { new lower low detected }
		begin
		LL = Low ;
		LLBDate = Date ;
		LLBTime = Time ;
		if downlineid > 0 then
			TL_Delete( downlineid ) ;
		DrawDnLine() ;
		end
	else if High > LL + LL * HLPivot then { found a
	 swing high }
		begin
		HH = High ;
		LHBDate = Date ;
		LHBTime = Time ;
		trend = 1 ;
		DrawUpLine() ;
		end ;
	end ;
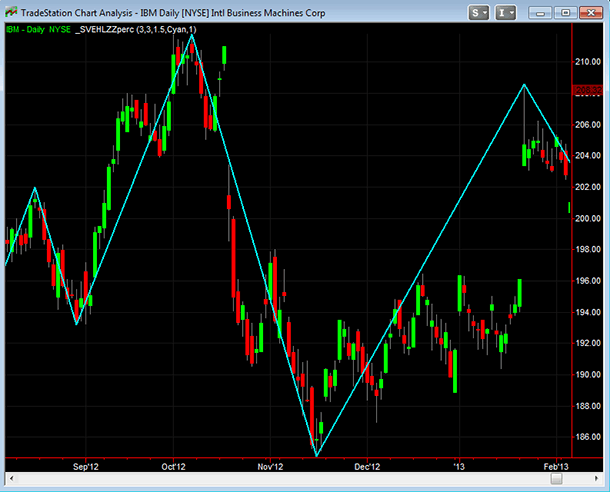
FIGURE 1: TRADESTATION. Here is a daily chart of IBM with the indicator to plot a zigzag of highs and lows applied to the chart. The indicator input settings can be seen in the status line at the top of the chart just to the right of the symbol and bar interval.
This article is for informational purposes. No type of trading or investment recommendation, advice, or strategy is being made, given, or in any manner provided by TradeStation Securities or its affiliates.
—Chris Imhof
TradeStation Securities, Inc.
www.TradeStation.com
BACK TO LIST

eSIGNAL: JUNE 2013 TRADERS’ TIPS CODE
For this month’s Traders’ Tip, we’ve provided the formula SVEHLZZPercent.efs based on Sylvain Vervoort’s article in this issue, “The 1-2-3 Wave Count.”
The study contains formula parameters to set the zigzag percent, ATR lookback period, zigzag ATR factor, and color of zigzag line and line width, which may be configured through the Edit Chart window.
To discuss this study or download a complete copy of the formula code, please visit the EFS Library Discussion Board forum under the forums link from the support menu at www.esignal.com or visit our EFS KnowledgeBase at https://www.esignal.com/support/kb/efs/. The eSignal formula scripts (EFS) are also available for copying and pasting below.
A sample chart is shown in Figure 2.
/*********************************
Provided By:
    Interactive Data Corporation (Copyright © 2013)
    All rights reserved. This sample eSignal Formula Script (EFS)
    is for educational purposes only. Interactive Data Corporation
    reserves the right to modify and overwrite this EFS file with
    each new release.

Description:
    High-Low ZigZag indicator

Version:            1.00  10/04/2013

Formula Parameters:                     Default:
ZigZag percent                          5
ATR Look back Period                    5
ZigZag ATR factor                       1.5
Color of ZigZag lines                   blue
Lines Width                             1

Notes:
    The related article is copyrighted material. If you are not a subscriber
    of Stocks & Commodities, please visit www.traders.com.

**********************************/


var pArray = new Array();

function preMain()
{

    setStudyTitle("High-Low ZigZag indicator");
    setComputeOnClose();
    setPriceStudy(true);

    var x = 0;

    pArray[x] = new FunctionParameter("fpZigZagPercentage", FunctionParameter.NUMBER);
    with(pArray[x++])
    {
      setName("ZigZag percent");
      setLowerLimit(0);
      setDefault(5);
    }

    pArray[x] = new FunctionParameter("fpATRPeriod", FunctionParameter.NUMBER);
    with(pArray[x++])
    {
      setName("ATR Look back Period");
      setLowerLimit(1);
      setDefault(5);
    }

    pArray[x] = new FunctionParameter("fpATRFactor", FunctionParameter.NUMBER);
    with(pArray[x++])
    {
      setName("ZigZag ATR factor");
      setLowerLimit(0);
      setDefault(1.5);
    }

    pArray[x] = new FunctionParameter("fpZigZagColor", FunctionParameter.COLOR);
    with(pArray[x++])
    {
      setName("Color of ZigZag lines");
      setDefault(Color.blue);
    }

    pArray[x] = new FunctionParameter("fpLineWidth", FunctionParameter.NUMBER);
    with(pArray[x++])
    {
      setName("Lines Width");
      setLowerLimit(1);
      setDefault(1);
    }
}

var nTrend = 0;

var nLHb = 0;
var nLLb = 0;

var nHH = 0;
var bLL = 0;

var nDownlineID = 0;
var nUplineID = 0;

var nHLPivot = 0;

var xATR = null;

var bInit = false;
var bVersion = null;

function main(fpZigZagPercentage, fpATRPeriod, fpATRFactor, fpZigZagColor, fpLineWidth)
{
    if (bVersion == null) bVersion = verify();
    if (bVersion == false) return;

    if(!bInit)
    {
        xATR = atr(fpATRPeriod);

        bInit = true;
    }

    var nBarNumber = getCurrentBarCount();

    if(nBarNumber < 2)
    {
        bLL = low(0);
        nHH = high(0);
        nLLb = nLHb = 1;
        nUplineID = nDownlineID = nBarNumber;
        nTrend = 1;
        return;
    }

    var nATR = xATR.getValue(0);

    if (nATR == null)
        return;

    if(fpATRFactor == 0)
    {
        nHLPivot = fpZigZagPercentage * 0.01;
    }
    else
    {
        if (fpZigZagPercentage == 0)
        {
            nHLPivot = nATR / close(0) * fpATRFactor;
        }
        else
        {
            nHLPivot = fpZigZagPercentage * 0.01 + nATR / close(0) * fpATRFactor;
        }
    }

    if (nTrend > 0)
    {
        if (high(0) >= nHH)
        {
            nHH = high(0);
            nLHb = nBarNumber;

            drawLineRelative(-(nBarNumber - nLLb), bLL, 0, nHH, PS_SOLID, fpLineWidth, fpZigZagColor, nUplineID);
        }
        else if (low(0) < nHH - nHH * nHLPivot)
        {
            bLL = low(0);
            nLLb = nBarNumber;
            nDownlineID = nBarNumber;
            nTrend = -1;

            drawLineRelative(-(nBarNumber - nLHb), nHH, 0, bLL, PS_SOLID, fpLineWidth, fpZigZagColor, nDownlineID);
        }
    }
    else
    {
        if (low(0) <= bLL)
        {
            bLL = low(0);
            nLLb = nBarNumber;

            drawLineRelative(-(nBarNumber - nLHb), nHH, 0, bLL, PS_SOLID, fpLineWidth, fpZigZagColor, nDownlineID);
        }
        else if (high(0) > bLL + bLL * nHLPivot)
        {
            nHH = high(0);
            nLHb = nBarNumber;
            nUplineID = nBarNumber;
            nTrend = 1;

            drawLineRelative(-(nBarNumber - nLLb), bLL, 0, nHH, PS_SOLID, fpLineWidth, fpZigZagColor, nUplineID);
        }
    }
}

function verify()
{
    var b = false;
    if (getBuildNumber() < 779)
    {
        drawTextAbsolute(5, 35, "This study requires version 8.0 or later.",
            Color.white, Color.blue, Text.RELATIVETOBOTTOM|Text.RELATIVETOLEFT|Text.BOLD|Text.LEFT,
            null, 13, "error");
        drawTextAbsolute(5, 20, "Click HERE to upgrade.@URL=https://www.esignal.com/download/default.asp",
            Color.white, Color.blue, Text.RELATIVETOBOTTOM|Text.RELATIVETOLEFT|Text.BOLD|Text.LEFT,
            null, 13, "upgrade");
        return b;
    }
    else
    {
        b = true;
    }

    return b;
}
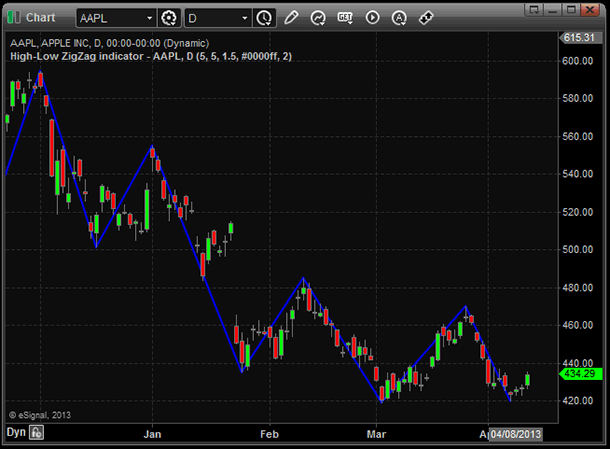
FIGURE 2: eSIGNAL. Zigzag applied to a chart of Apple.
—Jason Keck
eSignal, an Interactive Data company
800 779-6555, www.eSignal.com
BACK TO LIST

THINKORSWIM: JUNE 2013 TRADERS’ TIPS CODE
In “The 1-2-3 Wave Count” in this issue, author Sylvain Vervoort uses classic wave ideas to display turning points in the market (Figure 3). For thinkorswim users, we have created a study in our proprietary scripting language, thinkScript. You can adjust the parameters of the study within the Edit Studies window to fine-tune your periods calculated.
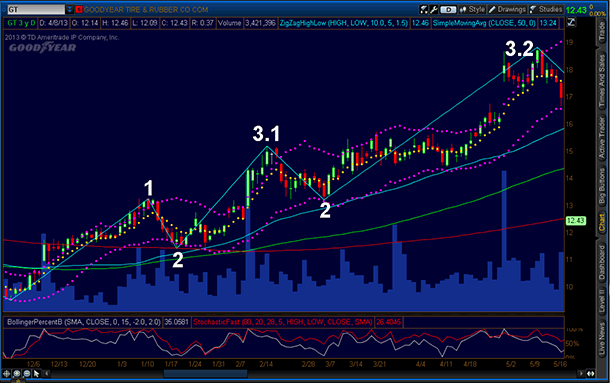
FIGURE 3: THINKORSWIM. Zigzag of highs and lows applied to a chart of Goodyear Tire & Rubber.
The study:
- From TOS charts, select Studies → Edit studies
- Select the “Studies” tab in the upper left-hand corner
- Select “New” in the lower left-hand corner
- There are three studies this month separated by #s
- Name the study (such as “ZigZagHighLow”)
- Click in the script editor window, remove “plot data = close” and paste in the following code:
###################
input priceH = high;
input priceL = low;
input zzPercent = 5.0;
input atrLength = 5;
input atrFactor = 1.5;

Assert(zzPercent >= 0, "'zz percent' must not be negative: " + zzPercent);
Assert(atrFactor >= 0, "'atr factor' must not be negative: " + atrFactor);
Assert(zzPercent != 0 or atrFactor != 0, "Both 'zz percent' and 'atr factor' cannot be zero");

def hlPivot = if zzPercent != 0 then zzPercent / 100 else 0 + if atrFactor != 0 then ATRWilder(atrLength) / close * atrFactor else 0;
def state = {default init, undefined, uptrend, downtrend};
def maxPriceH;
def minPriceL;
def newMax;
def newMin;

if GetValue(state, 1) == GetValue(state.init, 0) {
    maxPriceH = priceH;
    minPriceL = priceL;
    newMax = yes;
    newMin = yes;
    state = state.undefined;
} else if GetValue(state, 1) == GetValue(state.undefined, 0) {
    if priceH >= GetValue(maxPriceH, 1) {
        state = state.uptrend;
        maxPriceH = priceH;
        minPriceL = GetValue(minPriceL, 1);
        newMax = yes;
        newMin = no;
    } else if priceL <= GetValue(minPriceL, 1) {
        state = state.downtrend;
        maxPriceH = GetValue(maxPriceH, 1);
        minPriceL = priceL;
        newMax = no;
        newMin = yes;
    } else {
        state = state.undefined;
        maxPriceH = GetValue(maxPriceH, 1);
        minPriceL = GetValue(minPriceL, 1);
        newMax = no;
        newMin = no;
    }
} else if GetValue(state, 1) == GetValue(state.uptrend, 0) {
    if priceL <= GetValue(maxPriceH, 1) - GetValue(maxPriceH, 1) * hlPivot {
        state = state.downtrend;
        maxPriceH = GetValue(maxPriceH, 1);
        minPriceL = priceL;
        newMax = no;
        newMin = yes;
    } else {
        state = state.uptrend;
        if (priceH >= GetValue(maxPriceH, 1)) {
            maxPriceH = priceH;
            newMax = yes;
        } else {
            maxPriceH = GetValue(maxPriceH, 1);
            newMax = no;
        }
        minPriceL = GetValue(minPriceL, 1);
        newMin = no;
    }
} else {
    if priceH >= GetValue(minPriceL, 1) + GetValue(minPriceL, 1) * hlPivot {
        state = state.uptrend;
        maxPriceH = priceH;
        minPriceL = GetValue(minPriceL, 1);
        newMax = yes;
        newMin = no;
    } else {
        state = state.downtrend;
        maxPriceH = GetValue(maxPriceH, 1);
        newMax = no;
        if (priceL <= GetValue(minPriceL, 1)) {
            minPriceL = priceL;
            newMin = yes;
        } else {
            minPriceL = GetValue(minPriceL, 1);
            newMin = no;
        }
    }
}

def barNumber = BarNumber();
def barCount = HighestAll(If(IsNaN(priceH), 0, barNumber));
def newState = GetValue(state, 0) != GetValue(state, 1);
def offset = barCount - barNumber + 1;

def lastH;
if state == state.uptrend and priceH == maxPriceH and offset > 1 {
    lastH = fold iH = 1 to offset with tH = priceH while !IsNaN(tH) and !GetValue(newState, -iH) do if GetValue(newMax, -iH) or iH == offset - 1  then Double.NaN else tH;
} else {
    lastH = Double.NaN;
}

def lastL;
if state == state.downtrend and priceL == minPriceL and offset > 1 {
    lastL = fold iL = 1 to offset with tL = priceL while !IsNaN(tL) and !GetValue(newState, -iL) do if GetValue(newMin, -iL) or iL == offset - 1 then Double.NaN else tL;
} else {
    lastL = Double.NaN;
}

plot ZZ;
if barNumber == 1 {
    ZZ = fold iF = 1 to offset with tP = Double.NaN while IsNaN(tP) do if GetValue(state, -iF) == GetValue(state.uptrend, 0) then priceL else if GetValue(state, -iF) == GetValue(state.downtrend, 0) then priceH else Double.NaN;
} else if barNumber == barCount {
    ZZ = if state == state.uptrend and priceH == maxPriceH then priceH else if state == state.downtrend and priceL == minPriceL then priceL else if state == state.uptrend and priceH < maxPriceH then priceL else if state == state.downtrend and priceL > minPriceL then priceH else Double.NaN;
} else {
    ZZ = if !IsNaN(lastH) then lastH else if !IsNaN(lastL) then lastL else Double.NaN;
}
ZZ.SetDefaultColor(GetColor(1));
ZZ.EnableApproximation();< AvgCumAD, name = "AdvanceDeclineCumAvgLX");
—thinkorswim
A division of TD Ameritrade, Inc.
www.thinkorswim.com
BACK TO LIST

WEALTH-LAB: JUNE 2013 TRADERS’ TIPS CODE
The IRSTS 1-2-3 rule presented by author Sylvain Vervoort in his article in this issue, “The 1-2-3 Wave Count,” originates from classic swing trading philosophy. With our simplified rendition of Vervoort’s quite complex system in our C# code, based on fixed-percentage swings, we laid out a framework for detecting the 1-2-3 waves.
The system marks each wave on the chart, connecting them with colored lines, and enters on pullbacks in the direction of the primary trend (Wave 1). Its exits are derived from simple profit targets and stop-losses based on optimizable percentages. Motivated trading system developers are welcome to experiment with adding other entry/exit rules and tweaking the swing detection routine.
For example, consider range-bound markets. Wave 3, breaking through its father Wave 1’s extreme price, gets interrupted with a correction Wave 2 and then with Wave 1 in the opposite direction, signaling a potential trend change. In this case, the size of a correction wave may be taken as a factor when defining a new Wave 1: penetrations may only be considered significant if the preceding wave’s extreme is broken by a multiple of the wave’s magnitude. In our opinion, this has a chance of improving overall performance of the technique in choppy markets, protecting from changing direction too soon.
C# Code

using System;
using System.Collections.Generic;
using System.Text;
using System.Drawing;
using WealthLab;
using WealthLab.Indicators;

namespace WealthLab.Strategies
{
	public class IRSTS123Strategy : WealthScript
	{
		private StrategyParameter paramPercent;
		private StrategyParameter paramPT;
		private StrategyParameter paramSL;

		public IRSTS123Strategy()
		{
			paramPercent = CreateParameter("Reversal %",5.0, 1.0, 50.0, 1.0);
			paramPT = CreateParameter("Profit Target %",20.0,1.0,50.0,1.0);
			paramSL = CreateParameter("Stop Loss %",5.0,1.0,20.0,1.0);
		}

		protected override void Execute()
		{
			double percent = paramPercent.Value, target = paramPT.Value, stop = paramSL.Value;
			const string t = "\t";
			ZZBuilder zz = new ZZBuilder( Bars, percent );
			List<ZigZag> lst = zz.ZigZags;

			for(int bar = 1; bar < Bars.Count; bar++)
			{
				if (IsLastPositionActive)
				{
					Position p = LastPosition;
					double ProfitTgt = 0, StopPrice = 0;
					if ( p.PositionType == PositionType.Long ) {
						ProfitTgt = p.EntryPrice * (1 + target / 100.0d);
						StopPrice = p.EntryPrice * (1 - stop / 100.0d);
					}
					else {
						ProfitTgt = p.EntryPrice * (1 - target / 100.0d);
						StopPrice = p.EntryPrice * (1 + stop / 100.0d);
					}

					if(!ExitAtStop(bar + 1, p, StopPrice, "Stop Loss"))
						ExitAtLimit(bar + 1, p, ProfitTgt, "Profit Target");
				}
				else
				{
					if( lst != null ) {
						if( lst.Count > 0 ) {
							int idx = 0;
							foreach( ZigZag z in lst ) {
								if( z.barDetected == bar ) {
									if( z.wave == Wave.W2 ) {
										SetBackgroundColor( bar, !z.isMoveUp ? Color.FromArgb(30,Color.Green) : Color.FromArgb(30,Color.Red) );
										Position p = !z.isMoveUp ? BuyAtMarket( bar+1 ) : ShortAtMarket( bar+1 );
										if( p != null ) {
											p.Tag = idx;
										}
									}
								}
							}
						}
					}
				}
			}

			HideVolume(); SetBarColors(Color.Silver,Color.Silver);
		}
	}

	public enum Wave {W1, W2, W3}

	public class ZigZag
	{
		public int barDetected { get; set; }
		public bool isMoveUp { get; set; }
		public int zigBar { get; set; }
		public int zagBar { get; set; }
		public double inPrice { get; set; }
		public double outPrice { get; set; }
		public double magnitude { get; set; }

		public Wave wave { get; set; }
		public int leg3Count { get; set; }

		public ZigZag(int barDetected, bool isMoveUp, int zigBar, int zagBar, double inPrice, double outPrice, double magnitude)
		{
			this.barDetected = barDetected;
			this.isMoveUp = isMoveUp;
			this.zigBar = zigBar;
			this.zagBar = zagBar;
			this.inPrice = inPrice;
			this.outPrice = outPrice;
			this.magnitude = magnitude;
			this.leg3Count = 0;
		}
	}

	public class ZZBuilder
	{
		private bool Initialized = false;
		public Bars bars { get; private set; }
		public double percent { get; private set; }
		public List<ZigZag> ZigZags { get; private set; }

		public ZZBuilder( Bars b, double pct )
		{
			this.bars = b;
			this.percent = pct;

			BuildZZ();
			IRSTS123WaveRule();
		}

		private void BuildZZ()
		{
			try
			{
				PeakTroughMode mode = WealthLab.Indicators.PeakTroughMode.Percent;
				PeakBar pb = PeakBar.Series(bars.Close,percent,mode);
				TroughBar tb = TroughBar.Series(bars.Close,percent,mode);
				Trough tr = Trough.Series(bars.Close,percent,mode);
				Peak pk = Peak.Series(bars.Close,percent,mode);
				List<ZigZag> lst = new List<ZigZag>();
				double t1 = 0, p1 = 0, inPrice, outPrice = 0, magnitude = 0;
				int tb1 = 0, pb1, barDetected = 0, zigBar = 0, zagBar = 0;
				bool detected = false;

				for(int bar = 1; bar < bars.Count; bar++)
				{
					detected = false;

					t1 = tr[bar];
					tb1 = (int)tb[bar];
					if (tb1 == -1) continue;

					p1 = pk[bar];
					pb1 = (int)pb[bar];
					if (pb1 == -1) continue;

					if( tb[bar] > tb[bar-1] && pb[bar] > -1){
						detected = true;
					}

					if( pb[bar] > pb[bar-1] && tb[bar] > -1 ){
						detected = true;
					}

					if( detected ) {

						bool isMoveUp = (tb1 < pb1);
						magnitude = Math.Abs( bars.High[pb1] - bars.Low[tb1] );

						if( isMoveUp ) {
							zigBar = tb1; zagBar = pb1; inPrice = t1; outPrice = p1;
						}
						else {
							zigBar = pb1; zagBar = tb1; inPrice = p1; outPrice = t1;
						}

						lst.Add( new ZigZag( bar, isMoveUp, zigBar, zagBar, inPrice, outPrice, magnitude ) );
					}
				}

				ZigZags = lst;

				Initialized = true;
			}
			catch
			{
			}
		}

		private void IRSTS123WaveRule()
		{
			if( ZigZags.Count > 0 )
			{
				ZigZags[0].wave = Wave.W1;

				for( int i = 1; i < ZigZags.Count; i++ )
				{
					ZigZag prev = ZigZags[i - 1];
					ZigZag w = ZigZags[i];

					switch (prev.wave)
					{
						case Wave.W1:
							if( i > 0 ) {
								if( prev.isMoveUp ) {	// W2 breaks down through W1's base = new W1 down
									w.wave = ( w.outPrice < prev.inPrice ) ? Wave.W1 : Wave.W2;
								}
								else {	// W2 breaks out through W1's base = new W1 up
									w.wave = ( w.outPrice > prev.inPrice ) ? Wave.W1 : Wave.W2;
								}
							}
							break;
						case Wave.W2:
							if( w.isMoveUp ) { // prev Up, W1 = Down
								if( w.outPrice >= prev.outPrice )
									w.wave = Wave.W3;
							}
							else {				// prev Down, W1 = Up
								if( w.outPrice < prev.outPrice )
									w.wave = Wave.W3;
							}
							break;
						case Wave.W3:
							if( w.isMoveUp ) { // prev Up, W1 = Down
								if( w.outPrice > prev.outPrice )
									w.wave = Wave.W2;

								if( w.outPrice > prev.inPrice )
									w.wave = Wave.W1;
							}
							else {				// prev Down, W1 = Up
								if( w.outPrice < prev.outPrice )
									w.wave = Wave.W2;

								if( w.outPrice < prev.inPrice )
									w.wave = Wave.W1;
							}
							break;

						default:
							if( prev.magnitude > w.magnitude )
								w.wave = Wave.W1;
							break;
					}
				}

				// Wave 3 Leg count
				int c = 1;
				for(int i = 0; i < ZigZags.Count; i++ ) {
					ZigZag zz = ZigZags[i];
					if( zz.wave == Wave.W3 ) {
						zz.leg3Count = c;
						c++;
					}
					else if( zz.wave == Wave.W1 )
						c = 1;
				}
			}
		}
	}
}
On a closing note, the companion SVEHLZZperc indicator has been added to the TASCIndicators library in Wealth-Lab. See Figure 4 for a sample application. Conceptually, it’s a variation of the well-known trailing reverse method with a twist that combines fixed-percentage swings and volatility reversals.
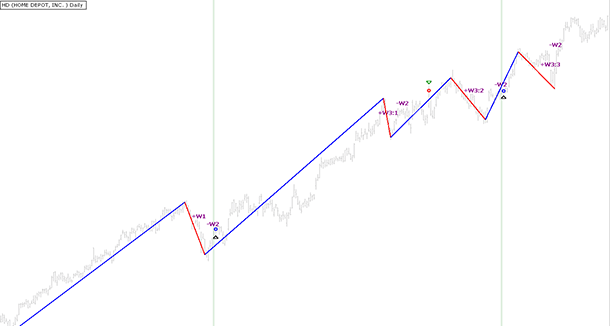
FIGURE 4: WEALTH-LAB. Here is a Wealth-Lab 6 chart illustrating application of the IRSTS 1-2-3 rule on a chart of Home Depot (HD).
—Eugene & Wealth-Lab team
MS123, LLC
www.wealth-lab.com
BACK TO LIST

AMIBROKER: JUNE 2013 TRADERS’ TIPS CODE
In “The 1-2-3 Wave Count” in this issue, author Sylvain Vervoort presents a modified high-low zigzag indicator that is based on percent price change and ATR-based volatility measure.
We have created a ready-to-use AmiBroker formula for the indicator, shown here. The code avoids unnecessary and redundant plots by combining lines into an array that is plotted at once while all trendlines are found. To display the indicator, simply type them into the formula editor and press “apply indicator.” You can modify the ZZPercent, ATRPeriod, and ATRFactor parameters by right-clicking the chart and selecting “parameters” from the context menu.
A sample chart is shown in Figure 5.
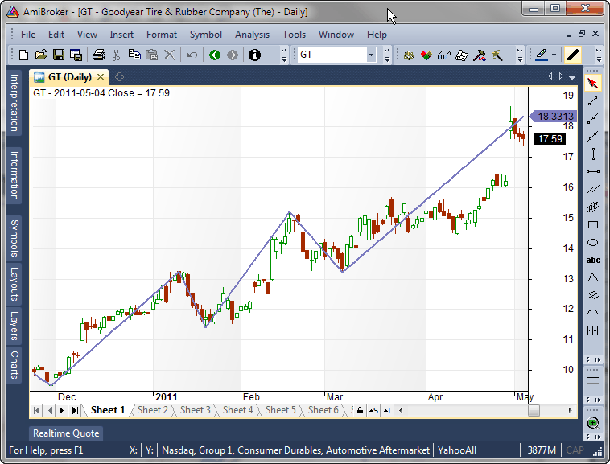
FIGURE 5: AMIBROKER. Here is a price chart of GT with a high-low zigzag overlay reproducing the results from Vervoort’s article.
LISTING 1.
ZZPercent = Param("ZZPercent", 5 );
ATRPeriod = Param("ATRPeriod", 5 );
ATRFactor = Param("ATRFactor", 1.5, 0, 5 );

HLPivot = ZZPercent * 0.01 + ATRFactor * ATR( ATRPeriod )/Close;

Ll = Low[ 0 ];
Hh = High[ 0 ];
Llb = Lhb = 0;

if( High[ 1 ] >= Hh )
{
  Hh = High[ 1 ];
  Lhb = trend = 1;
}
else
{
  Ll = Low[ 1 ];
  Llb = 1;
  trend = -1;
}

Line = Null;

for( i = 2; i < BarCount; i++ )
{
  if( trend > 0 )
  {
    if( High[ i ] >= Hh )
    {
      Hh = High[ i ];
      Lhb = i;
      Curline = LineArray( Llb, Ll, Lhb, Hh );
      Line = IIf( IsNull( CurLine ), Line, CurLine );
    }
    else
    if( Low[ i ] < Hh - Hh * HLPivot[ i ] )
    {
      Ll = Low[ i ];
      Llb = i;
      trend = -1;
      CurLine = LineArray( Lhb, Hh, Llb, Ll );
      Line = IIf( IsNull( CurLine ), Line, CurLine );
    }
 }
 else
 {
    if( Low[ i ] <= Ll )
    {
      Ll = Low[ i ];
      Llb = i;
      CurLine = LineArray( Lhb, Hh, Llb, Ll );
      Line = IIf( IsNull( CurLine ), Line, CurLine );
    }
    else
    if( High[ i ] > Ll + Ll * HLPivot[ i ] )
    {
      Hh = High[ i ];
      lhb = i;
      trend = 1;
      CurLine = LineArray( Llb, Ll, Lhb, Hh );
      Line = IIf( IsNull( CurLine ), Line, CurLine );
    }
  }
}

Plot( Line, "", colorBlueGrey, styleThick );
Plot( Close, Date()+ " Close", colorDefault, styleCandle );
—Tomasz Janeczko, AmiBroker.com
www.amibroker.com
BACK TO LIST

NEUROSHELL TRADER: JUNE 2013 TRADERS’ TIPS CODE
The SVEHLZZPercent indicator presented by Sylvain Vervoort in his article in this issue, “The 1-2-3 Wave Count,” can be implemented in NeuroShell Trader using NeuroShell Trader’s ability to call external dynamic linked libraries (DLL). DLLs can be written in C, C++, Power Basic, or Delphi.
After coding an indicator in your preferred compiler and creating a DLL, you can insert the resulting SVEHLZZPercent indicator as follows:
- Select “New indicator...” from the Insert menu.
- Choose the External Program & Library Calls category.
- Select the appropriate External DLL Call indicator.
- Set up the parameters to match your DLL.
- Select the Finished button.
An alternative method to analyzing wave counts in NeuroShell Trader is to use the Turning Points add-on, which not only plots lines between peaks and valleys, but also plots peak/valley support & resistance lines; the support/resistance price oscillator; Fibonacci retracement lines; price, time and slope statistical measures; and the probability that the current price is a new peak or valley.
Users of NeuroShell Trader can go to the Stocks & Commodities section of the NeuroShell Trader free technical support website to download a copy of this or any past Traders’ Tips.
A sample chart is shown in Figure 6.
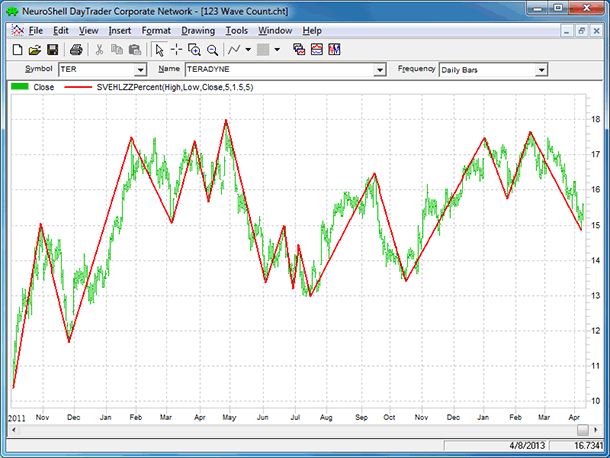
FIGURE 6: NEUROSHELL TRADER. This NeuroShell Trader chart displays the SVEHLZZPercent indicator.
—Marge Sherald, Ward Systems Group, Inc.
301 662-7950, sales@wardsystems.com
www.neuroshell.com
BACK TO LIST

AIQ: JUNE 2013 TRADERS’ TIPS CODE
For this month’s Traders’ Tip, I chose to provide AIQ code and methodology for the position-sizing technique presented in the August 2012 article by Oscar Cagigas, “Using Four Levels Of Risk.” The code for the position sizing is provided at www.TradersEdgeSystems.com/traderstips.htm. I was impressed by this new approach to position sizing, which is based on a “fixed” fraction but varies the fraction that is used in the sizing formula based on the most recent trade result. The approach is anti-Martingale and uses the standard deviation of the last four trades to determine whether to increase the fraction or decrease it.
Cagigas’ article is also interesting in that he applies the sizing to stocks and addresses the margin limitations that are encountered in the fixed-fractional method when applied to stocks. To code the position-sizing method, I created a simple trend-following system with these rules:
- Long only
- Trend is up = close greater than a long-term (200-bar) simple moving average and the short-term (20-bar) moving average is higher today than it was 10 bars ago
- A dip in the price has occurred = three-bar RSI is less than 10
- Sell if the close drops below the long-term moving average, or
- If the short-term moving average is lower than it was 10 bars ago.
I modified the risk levels to three due to issues with coding the author’s four-level approach. My formula uses 5% as the default, but if the last trade’s number of standard deviations is negative by more than one standard deviation, then the sizing is moved to the minimum of 2.5%. If it is positive by more than one standard deviation, then the maximum sizing of 10% is used. When it is within +/- one standard deviation then the 5% default is used.
The position-sizing formula also limits the size to the smaller of maximum leverage or the computed size using the fractional formula. The maximum leverage is one of the inputs that I set to “2” for a stock account to mirror the current margin requirements for stocks. Using my sizing code requires creating special data files that contain the percent return for each trade. To create the data files needed, follow these steps:
- For each stock or ETF that is to be traded, run a backtest of the system that will be sized
- Export the detailed backtest results to a .csv file
- Edit the .csv file so it can be imported into the volume field using the DTU utility program to a new data file (only the “profit%” field is used)
- The format must have all dates from the start of the backtest and have zeros between the trades with the percent return on the date the trade is closed. Add 100 to the returns to eliminate negative values, then multiply by 100. Inform the DTU utility program that the volume data is in 100s (see Figure 7 for the .csv import format)
- Import this along with the price data into a new file with the return data in the volume field.
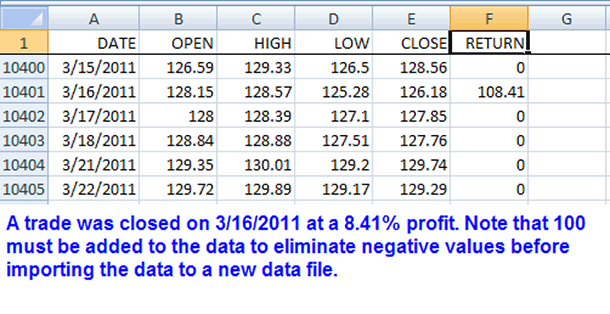
FIGURE 7: AIQ, CSV IMPORT FORMAT. This shows a portion of the .csv import file after reformatting the trade return data from the backtest and adding it to the price data from the stock to be traded and sized. This file is imported to a new stock data file that has been added to the database using the Datamanager.
I used the SPY in my example, and the new file’s symbol is SPYTTF. In my example, I am assuming that I will only be trading the SPY so I set the parameters for “number of stocks to trade” to 1. On the days when a buy signal is generated, the “buy” tab on the EDS report will show the SPY with the sizing to use for the next day’s entry. In Figure 8, I show several signals from different dates. Note that the sizing cannot be backtested with the AIQ software. My code will only provide the sizing for the next trade on a going-forward basis.
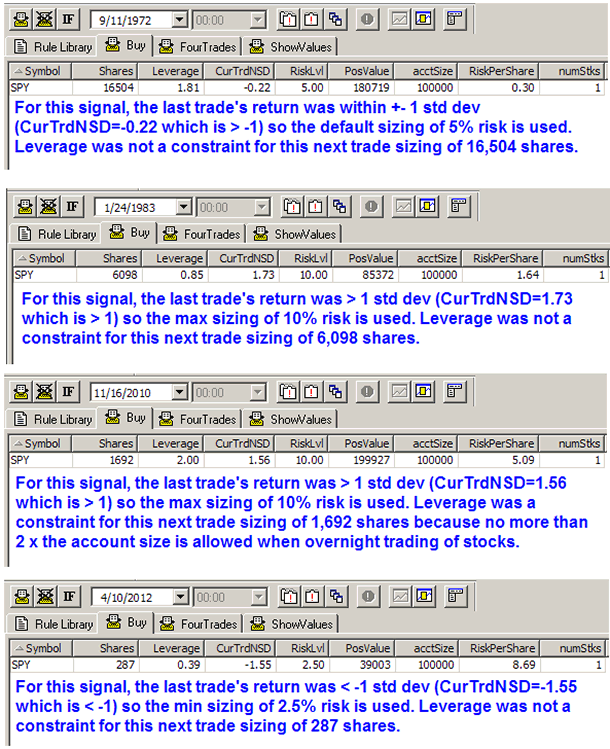
FIGURE 8: AIQ, SAMPLE BUY SIGNALS. Here are several sample buy signals from different dates illustrating the sizing computation and the leverage limitation.
To use this EDS code for sizing more than one stock, save the EDS file under a different name so you have two EDS files, then edit the inputs in both files. Repeat this for the number of stocks that will be traded for the system. Run all of these EDS files each night to generate signals and to get the sizing for the next trade. Be sure to create the required data file for each stock that will be traded. After each new trade is closed, update the special data file that holds the profit% data. This can be done in the data manager by editing the data file directly and manually inputting the profit%+100 into the volume field.
!USING FOUR LEVELS OF RISK STRATEGY
!Author: Oscar G. Cagigas, TASC August 2012
!Coded by: Richard Denning 4/7/13
!www.TradersEdgeSystems.com

!INPUTS
acctSize is 100000.	  !update this to match actual value as trading progresses
newDataFile is "SPYTTF".  !this file must contain the % return per trade in the volume field
tradedSymbol is "SPY".	  !this is the traded symbol and the one that will be sized for this EDS file
numStks is 1.
maLenST is 20.
maLenLT is 200.
rsiLen is 3.
maxLeverage is 2.
riskLvl1 is 2.5.
riskLvl2 is 5.0.
risklvl3 is 10.0.

!SYSTEM CODE:
smaST is simpleavg([close],maLenST).
smaLT is simpleavg([close],malenLT).

 !INDICATOR CODE: RSI WILDER
   U 	is [close]-val([close],1).
   D 	is val([close],1)-[close].
   rsiLen1 is 2 * rsiLen - 1.
   AvgU is expavg(iff(U>0,U,0),rsiLen1).
   AvgD is expavg(iff(D>=0,D,0),rsiLen1).
   rsi 	is 100-(100/(1+(AvgU/AvgD))).

Buy if symbol()=tradedSymbol and [close] > smaLT
	and smaST > valresult(smaST,10) and rsi < 10.
Sell if [close] < smaLT or smaST < valresult(smaST,10).
RiskPerShare is max([close]-smaLT, smaST-valresult(smaST,10)).

!POSITION SIZING CODE:
TRD is TickerUDF(newDataFile,[volume]).
OSD is offsettodate(month(),day(),year()).
os1 is scanany(TRD > 0,2000) then OSD .
os2 is scanany(TRD > 0,2000,∧os1+1) then OSD.
os3 is scanany(TRD > 0,2000,∧os2+1) then OSD.
os4 is scanany(TRD > 0,2000,∧os3+1) then OSD.

trd1 is valresult(TRD,∧os1)/100-100.
trd2 is valresult(TRD,∧os2)/100-100.
trd3 is valresult(TRD,∧os3)/100-100.
trd4 is valresult(TRD,∧os4)/100-100.

avgTRD is (trd1 + trd2 + trd3 + trd4)/4.

dt1 is setdate(∧os1).
dt2 is setdate(∧os2).
dt3 is setdate(∧os3).
dt4 is setdate(∧os4).

x1 is power((trd1 - avgTRD),2).
x2 is power((trd2 - avgTRD),2).
x3 is power((trd3 - avgTRD),2).
x4 is power((trd4 - avgTRD),2).
stdev is sqrt((x1+x2+x3+x4)/4).

!RULE TO TEST THAT AT LEAST 4 TRADES HAVE OCCURED:
FourTrades if symbol()=tradedSymbol
	and ∧os1<∧os2 and ∧os1<∧os3
	and ∧os1<∧os4 and ∧os2<∧os3
	and ∧os2<∧os4 and ∧os3<∧os4.
CurTrdNSD is (trd1 - avgTRD)/stdev.
RiskLvl is iff(FourTrades=0,riskLvl2,iff(CurTrdNSD>1,riskLvl3,
	iff(CurTrdNSD<-1,riskLvl1,riskLvl2))).
SharesMax is (acctSize/numStks)*maxLeverage/[close].
PosValue is Shares*[close].
Leverage is PosValue/(acctSize/numStks).
Shares is floor(iff(Buy,min(SharesMax,
	(acctSize/numStks*RiskLvl/100)/RiskPerShare),0)).

ShowValues if symbol()=tradedSymbol.
—Richard Denning
info@TradersEdgeSystems.com
for AIQ Systems
BACK TO LIST

TRADERSSTUDIO: JUNE 2013 TRADERS’ TIPS CODE
For this month’s Traders’ Tip, I am providing TradersStudio code and methodology for the position-sizing technique presented in the August 2012 article by Oscar Cagigas, “Using Four Levels Of Risk.” The code for the position sizing, shown below, is provided at the following two websites:
The following code files are contained in the download:
- System: “FOUR_RISK_LVLS” is a system I devised to use for testing the position sizing described in Oscar Cagigas’ August 2012 article
- TradePlan: “FOUR_RISK_LVLS_SIZING” computes the size of each trade using Cagigas’ method of four risk levels.
The approach is anti-Martingale and uses the standard deviation of the last four trades to determine whether to increase the fraction or decrease it. Cagigas’ article is also interesting in that he applies the sizing to stocks and addresses the margin limitations that are encountered in the fixed-fractional method when applied to stocks. To code Cagigas’ position-sizing method, I created a simple trend-following system with the following rules:
- Long only
- Trend is up = close greater than a long-term (200-bar) simple moving average and the short-term (20-bar) moving average is higher today than it was 10 bars ago
- A dip in the price has occurred = three-bar RSI is less than 10
- Sell if the close drops below the long-term moving average, or
- If the short-term moving average is lower than it was 10 bars ago.
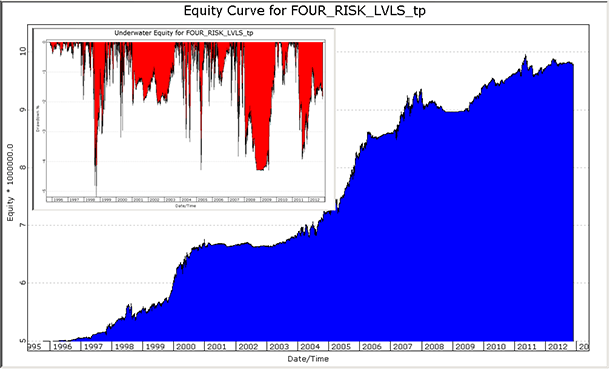
FIGURE 9: TRADERSSTUDIO, VARIABLE-RISK POSITION SIZING. Here are equity and underwater equity for the system trading the NASDAQ 100 stocks from 1995–2012 when risk is varied in an anti-Martingale manor using the last four trades to set the size of the next trade.
In Figure 9, I show the equity curve and underwater equity curve with the position sizing varying the risk from 2.5% up to 20% on the NASDAQ 100 stocks. In Figure 10, I show the same system run on the same data over the same time period but with the risk fixed at 5% for all trades. Although the return is slightly less with the variable-risk sizing, the underwater equity curve has a better shape and the profit factor is higher.
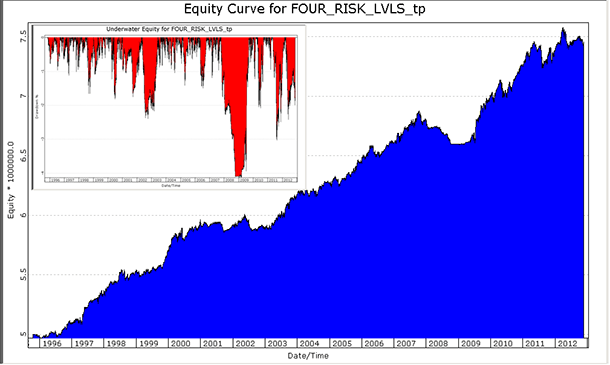
FIGURE 10: TRADERSSTUDIO, FIXED-PERCENTAGE POSITION SIZING. Here are equity and underwater equity for the system trading the NASDAQ 100 stocks from 1995–2012 when risk is held fixed at the initial level of 5% to size all of the trades.
'USING FOUR LEVELS OF RISK STRATEGY
'Author: Oscar G. Cagigas, TASC August 2012
'Coded by: Richard Denning 4/17/13
'www.TradersEdgeSystems.com

'SYSTEM CODE:
sub FOUR_RISK_LVLS(maLenST,maLenLT,rsiLen,rsiLvl)
'maLenST=20,maLenLT=200,rsiLen=3,rsiLvl=10
Dim smaST As BarArray
Dim smaLT As BarArray
Dim theRSI As BarArray
Dim riskPoints
smaLT = Average(C,maLenLT)
smaST = Average(C,maLenST)
theRSI = rsi(C,rsiLen,0)

If C > smaLT And smaST > smaST[10] And theRSI < rsiLvl Then
    Buy("LE",1,0,Market,Day)
    riskPoints = Max(C-smaLT, smaST-smaST[10])
    marketvar("riskPoints")=riskPoints
    marketvar("price")=C
End If
If C < smaLT Or theRSI > 95 Then ExitLong("LX","",1,0,Market,Day)
End Sub
'----------------------------------------------------------------

'TRADEPLAN POSITION SIZING CODE:
Sub FOUR_RISK_LVLS_SIZING(tradeLB,maxLev,riskLvl1,riskMult,maxUnits,sharesPerBlock)
'tradeLB=4,maxLev=2,riskLvl1=2.5,riskMult=20,maxUnits=-1,sharesPerBlock=100)
Dim riskLvl2 As BarArray
Dim riskLvl3 As BarArray
Dim riskLvl4 As BarArray
Dim pctRisk As BarArray
Dim rtrnPlus1 As Boolean
Dim rtrnMinus1 As Boolean
Dim fourTrds As Boolean
Dim maxPctEach
Dim riskPoints
Dim objM As TSProcessor.IMarket
Dim objS As TSProcessor.ISession
Dim iM, iT, iA
Dim units
Dim dollarSize
Dim pctOfEquity
Dim price
Dim maxPos
Dim Trades As Array
Dim avgTRD As BarArray
Dim sdTRD As BarArray
Dim curTrdNSD As BarArray

riskLvl2 = riskLvl1 * riskMult
riskLvl3 = riskLvl2 * riskMult
riskLvl4 = riskLvl3 * riskMult

rtrnPlus1 = False
rtrnMinus1 = False
fourTrds = False

'check that there is only one session
If TradePlan.SessionCount > 1 Then
    MsgBox("This TP is designed to run only one session-run halted.")
    StopRun()
End If

objS = TradePlan.Session(0)
maxPctEach = maxLev/ objS.MarketCount*100
maxPos = objS.MarketCount
For iM = 0 To objS.marketcount - 1  'loop A: through all markets
    objM = objS.Market(iM)
    If tradeplan.session(0).OpenTradeCount < maxPos And objM.ActiveOrderCount > 0 Then
        ' get information about trades
         ReDim (Trades, tradeLB)
        iA=0
        If objM.TradeCount>=tradeLB Then
            fourTrds = True
            For iT = objM.TradeCount-tradeLB To objM.TradeCount - 1
                iA = iT-(objM.TradeCount-tradeLB)
                Trades[iA] = objM.Trade(iT).Profit
            Next
            avgTRD=Average(Trades,tradeLB)
            sdTRD=StdDev(Trades,tradeLB,0)
            curTrdNSD = objM.Trade(iT-1).Profit/sdTRD
            If curTrdNSD > 1 Then rtrnPlus1=True Else rtrnPlus1=False
            If curTrdNSD < -1 Then rtrnMinus1=True Else rtrnMinus1=False
        End If
        riskPoints = objM.MarketVar("riskPoints")
        price = objM.MarketVar("price")
        pctRisk = IIF(fourTrds=False,riskLvl1,IIF(rtrnPlus1,Min(pctRisk[1]*riskMult,riskLvl4),IIF(rtrnMinus1,Max(pctRisk[1]/riskMult,riskLvl1),pctRisk[1])))
        If maxUnits = -1  Then
            If riskPoints <> 0 Then units = (((TradePlan.SummEquity/objS.MarketCount) * (pctRisk/100)) / riskPoints) / sharesPerBlock
        Else
            If riskPoints <> 0 Then units = Min(((TradePlan.SummEquity/objS.MarketCount) * (pctRisk/100)) / riskPoints, maxUnits) / sharesPerBlock
        End If
        dollarSize = units * sharesPerBlock * price
        pctOfEquity = dollarSize / TradePlan.SummEquity * 100
        If pctOfEquity > maxPctEach Then units = ((TradePlan.SummEquity/objS.MarketCount) * (maxPctEach/100) / price) / sharesPerBlock
        dollarSize = units * sharesPerBlock * price
        pctOfEquity = dollarSize / TradePlan.SummEquity * 100
        objM.EntryNumUnits = Round(units,0)
    Else
        objM.EntryNumUnits = 0
    End If
Next 'end loop A

sizefortotalexits()
End Sub
—Richard Denning
info@TradersEdgeSystems.com
for TradersStudio
BACK TO LIST

UPDATA: JUNE 2013 TRADERS’ TIPS CODE
Our Traders’ Tip for this month is based on the article by Sylvain Vervoort in this issue, “The 1-2-3 Wave Count.” (See Figure 11.)
In the article, Vervoort delivers some rules for swing trading based on counting common wave patterns in financial data. The code shown in this section deals with transitions between up waves and down waves via the breaking of some ATR-based threshold from extremities (point- and percentage-based transitions are already hardcoded within Updata).
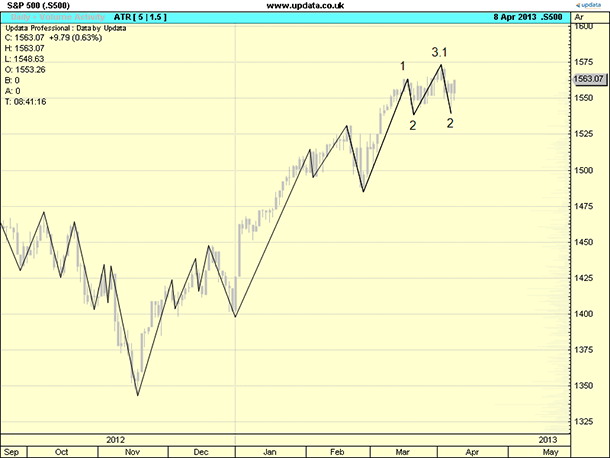
FIGURE 11: UPDATA. This chart shows the daily S&P 500 plotted with its 1-2-3 wave — currently on a wave 2, anticipating where a 3.2 might be — indicating a rally from its April 8th level.
The Updata code for this indicator has been added to the Updata library and may be downloaded by clicking the custom menu and then “Indicator library.” Those who cannot access the library due to a firewall may paste the code shown below into the Updata custom editor and save it.
PARAMETER "ATR Period" #PERIOD=5
PARAMETER "ATR Mult." @MULT=1.5
INDICATORTYPE TOOL
NAME "ATR [" #PERIOD "|" @MULT "]" ""
@PeriodHighPrice=0
@PeriodLowPrice=0
#PeriodHighBars=0
#PeriodLowBars=0
@MODE=0
@HLPivot=0
FOR #CURDATE=#PERIOD TO #LASTDATE
   #PeriodHighBars=#PeriodHighBars+1
   #PeriodLowBars=#PeriodLowBars+1
   @HLPivot=@MULT*ATR(#PERIOD)/CLOSE
   If @MODE>0
      If HIGH>PHIGH(HIGH(1),#PERIOD)
         @PeriodHighPrice=HIGH
         #PeriodHighBars=1
      ElseIf LOW<@PeriodHighPrice-(@PeriodHighPrice*@HLPivot)
         @PeriodLowPrice=LOW
         DRAWLINE #PeriodHighBars-1,@PeriodHighPrice,#PeriodLowBars-1,LOW(#PeriodLowBars-1)
         #PeriodLowBars=1
         @MODE=-1
      EndIf
   Else
      If LOW<PLOW(LOW(1),#PERIOD)
         @PeriodLowPrice=LOW
         #PeriodLowBars=1
      ElseIf HIGH>@PeriodLowPrice+(@PeriodlowPrice*@HLPivot)
         @PeriodHighPrice=HIGH
         DRAWLINE #PeriodLowBars-1,@PeriodLowPrice,#PeriodHighBars-1,HIGH(#PeriodHighBars-1)
         #PeriodHighBars=1
         @MODE=1
      EndIf
   EndIf
NEXT
—Updata support team
support@updata.co.uk
www.updata.co.uk
BACK TO LIST

TRADESIGNAL: JUNE 2013 TRADERS’ TIPS CODE
The indicators described in Sylvain Vervoort’s article in this issue, “The 1-2-3 Wave Count,” can easily be used with our online charting tool at www.tradesignalonline.com. Just check the Infopedia section for our lexicon. You will see the indicator and the functions, which you can make available for your personal account. Click on it and select “open script.” You can then apply the indicator to any chart you wish (Figure 12).
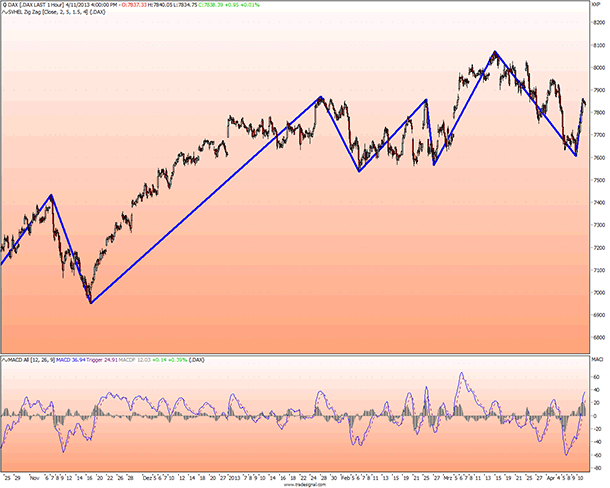
FIGURE 12: TRADESIGNAL ONLINE. Here is a sample TradeSignal Online chart displaying the zigzag indicator on the one-hour chart of the German DAX.
Source Code for SVHEL Zig Zag.eqi
Meta:
	ShortCode( "ZIG" ),
	SubChart( False ),
	WebLink( "https://www.tradesignalonline.com/lexicon/edit.aspx?id=19785" );

Inputs:
	Price( Close ),
	ZZPercent( 5.0 ),
	ATRPeriod( 5 , 1 ),
	ATRFactor( 1.5 ),

	ShowReversalLevel( True ),
	Color( ColorBlue ),
	Width( 1, 1, 10 ),
	Style( Solid, Dash, Dot, DashDot, DashDotDot ) = Solid;

Variables:
	zigzagPrice( Invalid ),
	zigzagDatetime,
	trend( 0 ),
	action( 0 ),
	line(-1),
	reversalPrice, reversalTrigger;


if ATRFactor = 0 Then
	reversalTrigger = ( ZZPercent * 0.01 * Close )
else if ZZPercent = 0 Then
	reversalTrigger = AvgTrueRange( ATRPeriod ) / Close * ATRFactor
else reversalTrigger = ( ( ZZPercent * 0.01 * Close ) + ( AvgTrueRange( ATRPeriod ) / Close ) ) * ATRFactor;

IND_ZigZag( High, Low, reversalTrigger, StyleSolid, Width, Color, reversalPrice, value1, value1, value1, value1 );

// *** Copyright tradesignal GmbH ***
// *** www.tradesignal.com ***
Source Code for IND_ZigZag.eqf
Inputs:
	PriceHighSeries( NumericSeries ),
	PriceLowSeries( NumericSeries ),
	ThreshHold( NumericSimple ),
	LineStyle( NumericSimple ),
	LineWidth( NumericSimple ),
	LineColor( NumericSimple ),
	ReversalPrice( ByRef ),
	ResistLevel( ByRef ),
	SupportLevel( Byref ),
	BarsSinceResist( ByRef ),
	BarsSinceSupport( BYRef );

Vars:
	trendDirection, firstLoop(True), maxLevel, minLevel, upperBarCounter, lowerBarCounter,
	lineID, data1::zigZagTrend, data1::zigZagReversalPrice, data1::zigZagSupportLevel, data1::zigZagResistLevel,
	data1::zigZagBarsSinceResist, data1::zigZagBarsSinceSupport;

If firstLoop Then
	Begin
		firstLoop = False;

		maxLevel = PriceHighSeries;
		minLevel = PriceLowSeries;

		If Close > Close[1] Then
			Begin
				trendDirection = 1;
				reversalPrice = maxLevel - ThreshHold;
				lineID = DrawTrendLine( DateTime, maxLevel, DateTime, minLevel, LineStyle, LineWidth, LineColor, ToolDrawInBackground );
			End
		Else
			Begin
				trendDirection = -1;
				reversalPrice = minLevel + ThreshHold;
				lineID = DrawTrendLine( DateTime, minLevel, DateTime, maxLevel, LineStyle, LineWidth, LineColor, ToolDrawInBackground );
			End;
	End;

upperBarCounter = upperBarCounter + 1;
lowerBarCounter = lowerBarCounter + 1;

BarsSinceResist = upperBarCounter;
BarsSinceSupport = lowerBarCounter;

If PriceHighSeries > maxLevel Then
	Begin
		maxLevel = PriceHighSeries;
		upperBarCounter = 0;
		ToolSetEnd( lineID, DateTime, maxLevel );

		If trendDirection = 1 Then
			reversalPrice = MinList( maxLevel - ThreshHold, PriceLowSeries );
	End;

If trendDirection = 1 Then
	Begin
		If PriceLowSeries < reversalPrice Then
			Begin
				trendDirection = -1;
				minLevel = PriceLowSeries[1];
				//DrawSymbol[upperBarCounter]( maxLevel, "Reversal D", SymbolDot, 6, Red, Red );
				ReversalPrice = MaxLIst( minLevel + ThreshHold, PriceHighSeries );

				lowerBarCounter = 0;
				ToolSetEnd( lineID, DateTime[upperBarCounter], maxLevel );
				lineID = DrawTrendLine( DateTime, minLevel, DateTime[upperBarCounter], maxLevel, LineStyle, LineWidth, LineColor, ToolDrawInBackground );

				ResistLevel = maxLevel;
			End;
	End;

If PriceLowSeries < minLevel Then
	Begin
		minLevel = PriceLowSeries;
		lowerBarCounter = 0;
		ToolSetEnd( lineID, DateTime, minLevel );

		If trendDirection = -1 Then
			ReversalPrice = MaxLIst( minLevel + ThreshHold, PriceHighSeries );
	End;

If trendDirection = -1 Then
	Begin
		If PriceHighSeries > reversalPrice Then
			Begin
				trendDirection = 1;
				maxLevel = PriceHighSeries[1];
				reversalPrice = MinList( maxLevel - ThreshHold, PriceLowSeries );
				upperBarCounter = 0;
				//DrawSymbol[lowerBarCounter ]( minLevel, "Reversal U", SymbolDot, 6, DarkGreen, DarkGreen );
				ToolSetEnd( lineID, DateTime[lowerBarCounter], minLevel );
				lineID = DrawTrendLine( DateTime[lowerBarCounter ], minLevel, DateTime, maxLevel, LineStyle, LineWidth, LineColor, ToolDrawInBackground );

				SupportLevel = MinLevel;
			End;
	End;

data1::zigZagTrend = trendDirection;
data1::zigZagReversalPrice = ReversalPrice;
data1::zigZagSupportLevel = SupportLevel;
data1::zigZagResistLevel = ResistLevel;
data1::zigZagBarsSinceResist = upperBarCounter;
data1::zigZagBarsSinceSupport = lowerBarCounter;

IND_ZigZag = trendDirection;

// *** Copyright tradesignal GmbH ***
// *** www.tradesignal.com ***
—Henning Blumenthal, Tradesignal GmbH
support@tradesignalonline.com
www.TradesignalOnline.com, www.Tradesignal.com
BACK TO LIST
MICROSOFT EXCEL: JUNE 2013 TRADERS’ TIPS CODE
In “The 1-2-3 Wave Count” in this issue, author Sylvain Vervoort has provided an easy-to-compute algorithm to identify significant turning (swing) points for a price series. The sensitivity controls can be adjusted to filter out (or include) smaller swings (which may just be noise).
Figure 13 approximates the pattern shown in Vervoort’s Figure 15 in his article.
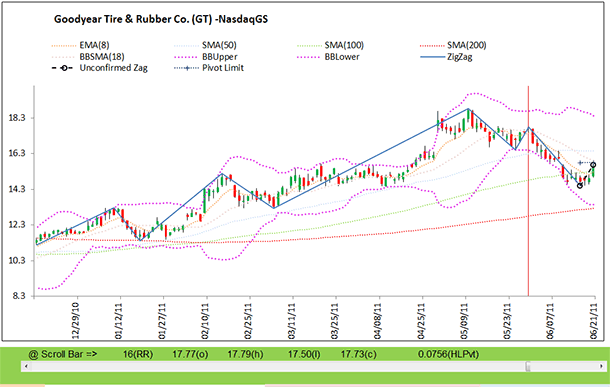
FIGURE 13: EXCEL, ZIGZAG. Here is a sample zigzag plot.
The three zigzag-related indicator series are calculated by way of a VBA subroutine that the user initiates by way of the “refresh zigzag” button (Figure 14).

FIGURE 14: EXCEL, CONTROL SETTINGS. Here are the control settings used to produce the calculations and plot shown in Figure 13 above.
The three zigzag-related indicators are placed on the chart using “scatter plot” as the chart type. This allows for a slightly faster calculation in the VBA routine. We need only determine the turning points, since the graph engine takes care of plotting the lines connecting the scatter points.
I designed the zigzag calculation routine so that it can actively show progress on the chart.
The computations are fairly intensive, so it takes some time to complete the plot. Much of this time is taken up by the graph engine trying to plot the series updates. It’s possible to speed things up by as much as a factor of six to seven times if we turn off the screen-updating checkbox prior to initiating the zigzag calculation.
On my computer with screen-updating turned on, the plot progress is relatively jerky, with the occasional sudden leap of several bars. I attribute this to the graph engine falling behind with the flood of value changes as the calculations progress. The graph engine appears to be combining several intermediate-value update cycles into one display update.
The spreadsheet file for this Traders’ Tip can be downloaded here. To successfully download it, follow these steps:
- Right-click on the Excel file link here, then
- Select “Save Target As” to place a copy of the spreadsheet file on your hard drive.
—Ron McAllister
Excel and VBA programmer
rpmac_xltt@sprynet.com
BACK TO LIST

TRADING BLOX: JUNE 2013 TRADERS’ TIPS CODE
In “The 1-2-3 Wave Count” in this issue, Sylvain Vervoort presents a zigzag indicator based on his experience that 99% of the time, any move in the financial markets is composed of three or more up or down waves. The indicator can be used as an entry signal when the expected wave is a 1 or a 3, which move in the direction of the trend (Figures 15 & 16).
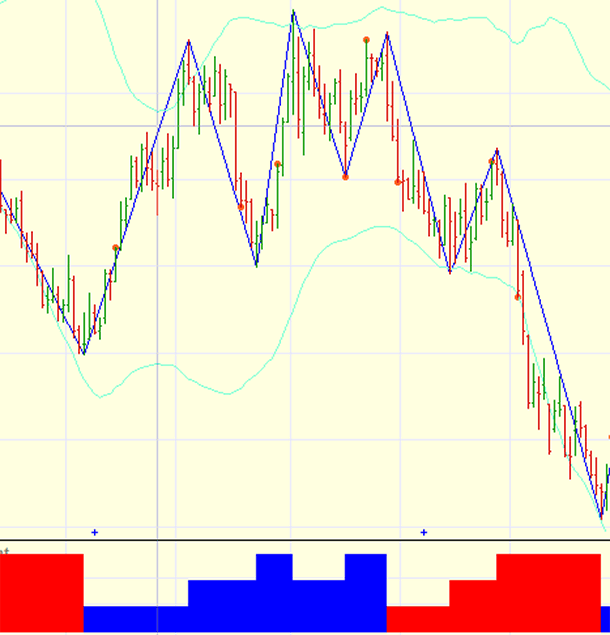
FIGURE 15: TRADING BLOX, WAVE COUNT. The 1-2-3 wave indicator is shown in the price chart. The wave count is shown in the indicator window below. The orange dots are the points where each wave confirms.
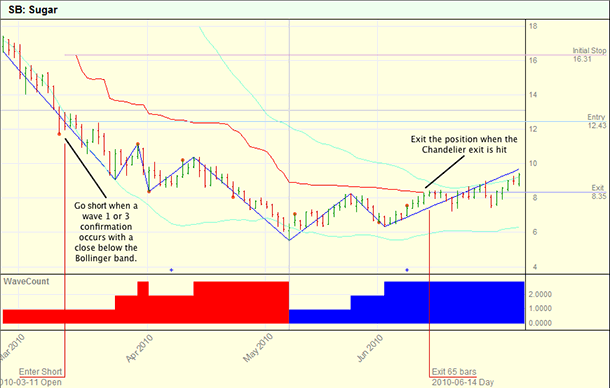
FIGURE 16: TRADING BLOX, 1-2-3 WAVE SYSTEM. The orange dot on the left side of the chart is the point of confirmation of a wave 1 in a downtrend. The light green line is the Bollinger Band. The red line above the price is the chandelier exit. When price touches the chandelier level, the position is exited.
The system rules look for the confirmation of a wave 1 or 3 along with a close outside of the two standard deviation Bollinger Bands and takes a position at market on the open of the following day. The stop-loss used is Trading Blox’s built-in chandelier exit, which trails the position at a factor of the average true range from the highest high since entry for long positions, and lowest low since entry for short positions.
The portfolio used is the “all-liquid” portfolio of futures markets that comes loaded as sample data (Figures 17 & 18). Trading Blox’s built-in fixed-fractional money manager is used to size each trade at 2% of equity. This money manager sizes positions based on a percentage of simulated account value and the distance from trade entry to the stop-loss or exit point.
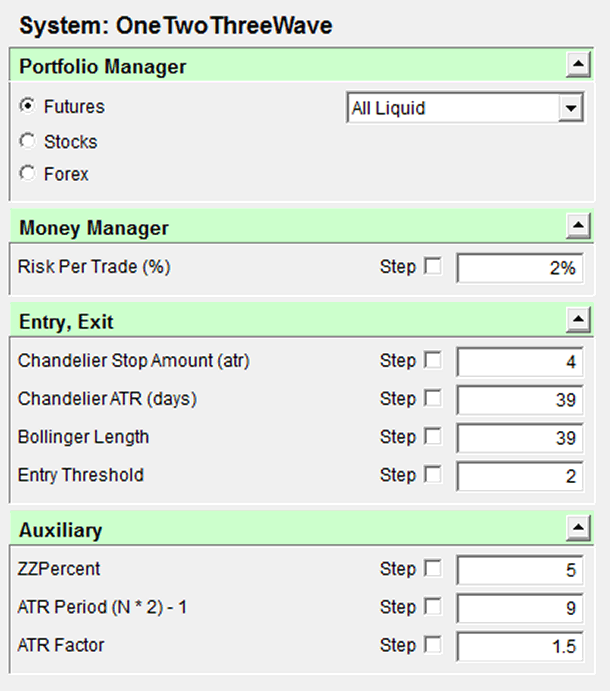
FIGURE 17: TRADING BLOX, SYSTEM PARAMETERS. Parameters are set to the defaults given in Vervoort’s article. ATR period is based on J. Welles Wilder smoothing, which uses N*2–1 rather than N.
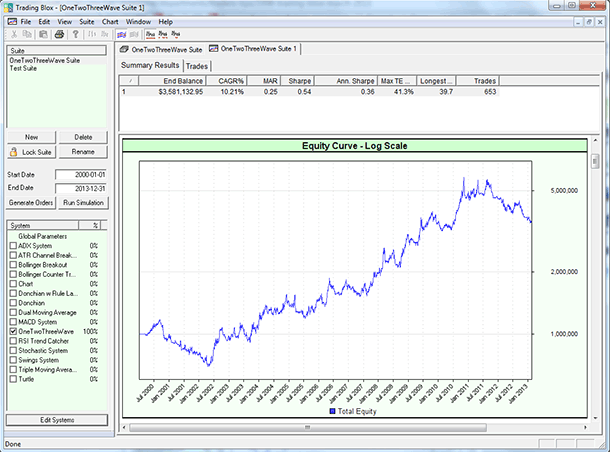
FIGURE 18: TRADING BLOX, SYSTEM RESULTS. Here are sample performance results for the 1-2-3 wave system.
A zipped file of the 123waveCount system Trading Blox files is available here.
—Trading Blox
tradingblox.com
BACK TO LIST
Originally published in the June 2013 issue of
Technical Analysis of Stocks & Commodities magazine.
All rights reserved. © Copyright 2013, Technical Analysis, Inc.
Return to
Contents


