INDICATORS
Riding The Zigzags
In this second part of a seven-article series, find out about the 1-2-3 wave count system that’s part of the indicator rules for a swing trading strategy (IRSTS).
I have found that about 99% of the time, any move in the financial markets is composed of three or more up or down waves. The 1-2-3 wave count is based on this finding. To help count these waves, I will introduce a high-low zigzag indicator that is based on a fixed-percent price change between high and low prices, or that uses an average true range (ATR) volatility factor. I have found that a combination of both methods makes a good indicator.
HIGH-LOW ZIGZAG
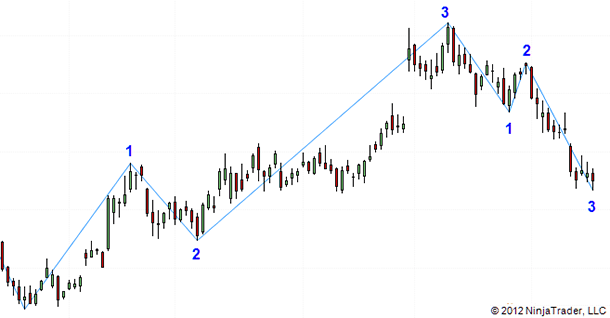
In Figure 1 you see an example of a zigzag between the lowest low and highest high levels at the turning points. The minimum change required in this example is the sum of a 3% price change and a three-period ATR multiplied by a factor of 1.5.

FIGURE 1: HIGH-LOW ZIGZAG. Here you see an example of a zigzag between the lowest low and highest high levels at the turning points.
I call this zigzag indicator “SVEHLZZperc” and use NinjaTrader’s NinjaScript to implement it. I keep the last lowest low value in parameter ll and the last highest high value in parameter hh. I need to store the bar position of this highest high or lowest low value. To do this, I use the last highest bar lhb and last lowest bar llb as the parameters.
PROGRAMMING THE ZIGZAG
Here are all the parameters I use:
I will begin with a special action for the first two data bars — I store the last low and high price to find out if prices are moving up or down.