TRADERS’ TIPS
August 2013

For this month’s Traders’ Tips, the focus is Sylvain Vervoort’s article in this issue, “Within The Volatility Band.” Here we present the August 2013 Traders’ Tips code with possible implementations in various software.
Code for NinjaTrader is already provided in Vervoort’s article. Subscribers will find that code at the Subscriber Area of our website. Presented here is an overview of possible implementations for other software.
Traders’ Tips code is provided to help the reader implement a selected technique from an article in this issue. The entries are contributed by various software developers or programmers for software that is capable of customization.

TRADESTATION: AUGUST 2013 TRADERS’ TIPS CODE
In “Within The Volatility Band” in this issue, author Sylvain Vervoort describes the construction of volatility bands and a simple trading idea based on the bands. Provided here is a multiple-output function that returns the band values (midline, upper band, and lower band), an indicator that plots the bands, and a sample strategy. The strategy enters long when price closes above the upper band, and sells short when the price closes below the lower band. The strategy is provided for illustrative purposes only.
To download the EasyLanguage code, first navigate to the EasyLanguage FAQs and Reference Posts Topic in the EasyLanguage support forum (https://www.tradestation.com/EL-FAQ), scroll down, and click on the link labeled “Traders’ Tips, TASC.” Then select the appropriate link for the month and year. The ELD filename is “_SVEVolatilityBands.ELD.” The code is also shown below.
_SVEVolatilityBand_Func (Series Function)

{ TASC - August, 2013 }
{ Within The Volatility Band }
{ Sylvain Vervoort }

inputs:
	int AverageLen( numericsimple ), { band average
	 length }
	int VolPeriod ( numericsimple ), { volatility
	 summing period }
	double DevFact( numericsimple ), { deviation
	 factor }
	double LowBandAdjust( numericsimple ), { lower
	 band adjustment factor }
	double oMidLine( numericref ),
	double oUpperBand( numericref ),
	double oLowerBand( Numericref ) ;

variables:
	double devhigh( 0 ),
	double devlow( 0 ),
	double BarTypicalPrice( 0 ),
	double typical( 0 ),
	double deviation( 0 ),
	double MedianAverage( 0 ) ;

BarTypicalPrice = TypicalPrice ;

if BarTypicalPrice >= BarTypicalPrice[1] then
	typical = BarTypicalPrice - Low[1]
else
	typical = BarTypicalPrice[1] - Low ;

{ basic deviation based on "typical" over a period and
  a factor }
deviation = Summation( typical, VolPeriod ) /
 VolPeriod * DevFact ;

devhigh = XAverage( deviation, AverageLen ) ;
devlow = XAverage( deviation, AverageLen ) *
 LowBandAdjust ;

MedianAverage = XAverage( BarTypicalPrice,
 AverageLen ) ; { the middle average reference }

oMidLine = Average( MedianAverage, AverageLen ) ;
oUpperBand = XAverage( MedianAverage, AverageLen ) +
 devhigh ;
oLowerBand = XAverage( MedianAverage, AverageLen ) -
 devlow ;

_SVEVolatilityBand_Func = 1 ;

{
MULTIPLE-OUTPUT FUNCTIONS

A multiple-output function has two types of parameters
or "inputs" - input parameters and input/output
parameters.  The values of the input parameters are
passed into the multiple-output function, but not
modified by the function.  The values of the input/
output parameters are passed into the multiple-output
function, modified by it, and the modified values are
then inherited by - or output to - the calling routine.

The input/output parameters are often used for output
purposes only, i.e., the incoming values are ignored.
The outputs are in addition to the function return.
In multiple-output functions, the function return is
generally used to return an error code, though
sometimes the return may simply be a dummy value.

The input/output parameters are declared with a "ref"
suffix (such as "numericref") in the multiple-output
function's declaration statements.  For further
clarity, the names of the input/output parameters are
generally prefixed with an "o" in the function as
well as in all the routines that call the function.

The built-in single-return WRAPPER FUNCTIONS that call
the multiple-output functions are specialized calling
routines designed to offer simplified, alternate
pathways to the functionality of the underlying
multiple-output functions.  In the wrapper functions,
the input/output parameters are declared as local
variables and generally initialized to zero.  They are
passed through to the multiple-output function without
further modification.  After the call, the wrapper
function picks out the single output of interest and
assigns it as the return of the wrapper function.
}

_ SVEVolatilityBand_Ind (Indicator)

{ TASC - August, 2013 }
{ Within The Volatility Band }
{ Sylvain Vervoort }

inputs:
	int AverageLen( 8 ), { band average length }
	int VolPeriod (13 ), { volatility summing period }
	double DevFact( 3.55 ), { deviation factor }
	double LowBandAdjust( 0.9 ) ; { lower band
	 adjustment factor }

variables:
	double MidLine( 0 ),
	double UpperBand( 0 ),
	double LowerBand( 0 ) ;

Value1 = _SVEVolatilityBand_Func( AverageLen,
 VolPeriod, DevFact, LowBandAdjust, MidLine,
 UpperBand, LowerBand ) ;

{ plots - show only after calculations are stable }
if CurrentBar > AverageLen * 3 + 2 * VolPeriod  then
	begin
	Plot1( MidLine, "Median" ) ;
	Plot2( UpperBand, "Upper" ) ;
	Plot3( LowerBand, "Lower" ) ;
	end ;


_ SVEVolatilityBand _Strat (Strategy)

{ TASC - August, 2013 }
{ Within The Volatility Band }
{ Sylvain Vervoort }

inputs:
	int AverageLen( 8 ), { band average length }
	int VolPeriod (13 ), { volatility summing period }
	double DevFact( 1 ), { deviation factor }
	double LowBandAdjust( 0.9 ) ; { lower band
	 adjustment factor }

variables:
	bool OkToTrade( false ),
	double MidLine( 0 ),
	double UpperBand( 0 ),
	double LowerBand( 0 ) ;

Value1 = _SVEVolatilityBand_Func( AverageLen,
 VolPeriod, DevFact, LowBandAdjust, MidLine,
 UpperBand, LowerBand ) ;

{ allow trading after calculations are stable }
OkToTrade = CurrentBar > AverageLen * 3 +
 2 * VolPeriod ;

if OkToTrade then
	begin
	if Close crosses over UpperBand then
		Buy ( "SVE Vol LE" ) next bar market ;

	if Close crosses under LowerBand then
		SellShort ( "SVE Vol SE" ) next bar market ;
	end ;
A sample chart is shown in Figure 1.
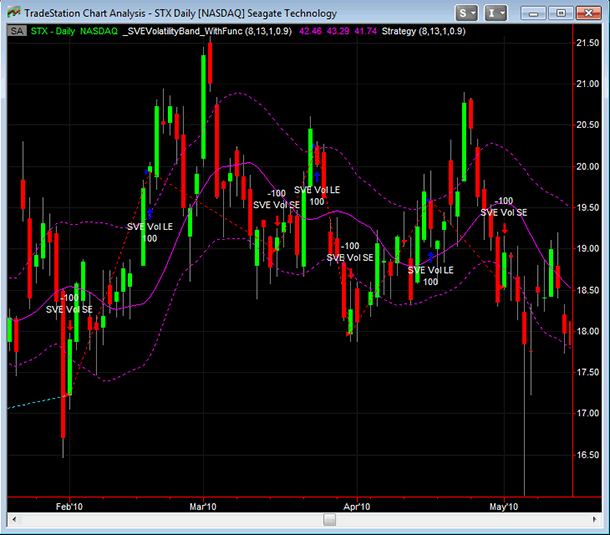
FIGURE 1: TRADESTATION. Shown here is a daily chart of STX with the indicator and strategy based on Sylvain Vervoort’s article in this issue applied. To align the strategy and indicator, “DevFact” inputs were both set to 1.
This article is for informational purposes. No type of trading or investment recommendation, advice, or strategy is being made, given, or in any manner provided by TradeStation Securities or its affiliates.
—Chris Imhof
TradeStation Securities, Inc.
www.TradeStation.com
BACK TO LIST

eSIGNAL: AUGUST 2013 TRADERS’ TIPS CODE
For this month’s Traders’ Tip, we’ve provided the formula SVEVolatilityBand.efs based on the formula code from Sylvain Vervoort’s article in this issue, “Within The Volatility Band.”
The study contains formula parameters to set the values for the band average, summing period, deviation factor, and lower band adjustment, which may be configured through the Edit Chart window (right-click on chart and select “Edit chart”).
To discuss this study or download a complete copy of the formula code, please
visit the EFS Library Discussion Board forum under the forums link from the
support menu at www.esignal.com, or visit our EFS KnowledgeBase at https://www.esignal.com/support/kb/efs/.
The eSignal formula scripts (EFS) are also available for copying and pasting
below.
/*********************************
Provided By:
    Interactive Data Corporation (Copyright © 2013)
    All rights reserved. This sample eSignal Formula Script (EFS)
    is for educational purposes only. Interactive Data Corporation
    reserves the right to modify and overwrite this EFS file with
    each new release.

Description:
    SVEVolatilityBand

Version:            1.00  06/06/2013

Formula Parameters:                     Default:
Band Average                            8
Summing Period                          13
Deviation Factor                        3.55
Lower Band Adjust                       0.9

Notes:
    The related article is copyrighted material. If you are not a subscriber
    of Stocks & Commodities, please visit www.traders.com.

**********************************/


var fpArray = new Array();

function preMain()
{
    setPriceStudy(true);
    setStudyTitle("SVEVolatilityBand");

    setCursorLabelName("Upper", 0);
    setCursorLabelName("Median", 1);
    setCursorLabelName("Lover", 2);

    setDefaultBarFgColor(Color.blue, 1);
    setDefaultBarFgColor(Color.red, 0);
    setDefaultBarFgColor(Color.green, 2);

    setPlotType(PLOTTYPE_DOT, 0);
    setPlotType(PLOTTYPE_LINE, 1);
    setPlotType(PLOTTYPE_DOT, 2);

    setDefaultBarThickness(2, 0);
    setDefaultBarThickness(1, 1);
    setDefaultBarThickness(2, 2);

    var x = 0;

    fpArray[x] = new FunctionParameter("fpBandAverage", FunctionParameter.NUMBER);
    with(fpArray[x++])
    {
        setName("Band Average");
        setLowerLimit(1);
        setDefault(8);
    }

    fpArray[x] = new FunctionParameter("fpSummingPeriod", FunctionParameter.NUMBER);
    with(fpArray[x++])
    {
        setName( "Summing Period" );
        setLowerLimit(1);
        setDefault(13);
    }

    fpArray[x] = new FunctionParameter("fpDeviationFactor", FunctionParameter.NUMBER);
    with(fpArray[x++])
    {
        setName( "Deviation Factor" );
        setDefault(3.55);
    }

    fpArray[x] = new FunctionParameter("fpLowerBandAdjust", FunctionParameter.NUMBER);
    with(fpArray[x++])
    {
        setName( "Lower Band Adjust" );
        setDefault(0.9);
    }
}

var bInit = false;
var bVersion = null;

var xHLC3 = null;
var xLow = null;

var xTypical = null;
var xDeviation = null;
var xDev = null;

var xMedianAverage = null;
var xMedianEMA = null;
var xMedianSMA = null;

function main(fpBandAverage, fpSummingPeriod, fpDeviationFactor, fpLowerBandAdjust)
{
    if (bVersion == null) bVersion = verify();
    if (bVersion == false) return;

    if (!bInit)
    {
        xHLC3 = hlc3();
        xLow  = low();

        xTypical = efsInternal("Calc_TypicalSeries", xHLC3, xLow);
        xDeviation = efsInternal("Calc_DeviationSeries", xTypical, fpSummingPeriod, fpDeviationFactor);
        xDev = ema(fpBandAverage, xDeviation);

        xMedianAverage = ema(fpBandAverage, xHLC3);
        xMedianEMA = ema(fpBandAverage, xMedianAverage);
        xMedianSMA = sma(fpBandAverage, xMedianAverage);

        bInit = true;
    }

    var nDev = xDev.getValue(0);

    if (nDev == null)
        return;

    var nDevHigh = nDev;
    var nDevLow = nDev * fpLowerBandAdjust;

    var nMedianEMA = xMedianEMA.getValue(0);
    var nMedianSMA = xMedianSMA.getValue(0);

    if (nMedianEMA == null || nMedianSMA == null)
        return;

    var nUpper = nMedianEMA + nDevHigh;
    var nLower = nMedianEMA - nDevLow;
    var nMedian = nMedianSMA;

    return [nUpper, nMedian, nLower];
}

function Calc_TypicalSeries(xHLC3, xLow)
{
    var nReturnValue = 0;

    var nHLC3 = xHLC3.getValue(0);
    var nHLC3_1 = xHLC3.getValue(-1);
    var nLow = xLow.getValue(0);
    var nLow_1 = xLow.getValue(-1);

    if(nHLC3_1 == null || nLow_1 == null)
        return;

    if (nHLC3 > = nHLC3_1)
        nReturnValue = nHLC3 - nLow_1;
    else
        nReturnValue = nHLC3_1 - nLow;

    return nReturnValue;
}


var xSMA = null;

function Calc_DeviationSeries(xSeries, nSummingPeriod, nDeviationFactor)
{
    if (getBarState() == BARSTATE_ALLBARS)
    {
        xSMA = sma(nSummingPeriod, xSeries);
    }

    var nSMA = xSMA.getValue(0);

    if (nSMA == null)
        return;

    return nSMA * nDeviationFactor;
}

function verify()
{
    var b = false;
    if (getBuildNumber() <  779)
    {
        drawTextAbsolute(5, 35, "This study requires version 8.0 or later.",
            Color.white, Color.blue, Text.RELATIVETOBOTTOM|Text.RELATIVETOLEFT|Text.BOLD|Text.LEFT,
            null, 13, "error");
        drawTextAbsolute(5, 20, "Click HERE to upgrade.@URL=https://www.esignal.com/download/default.asp",
            Color.white, Color.blue, Text.RELATIVETOBOTTOM|Text.RELATIVETOLEFT|Text.BOLD|Text.LEFT,
            null, 13, "upgrade");
        return b;
    }
    else
    {
        b = true;
    }

    return b;
}
A sample chart is shown in Figure 2.
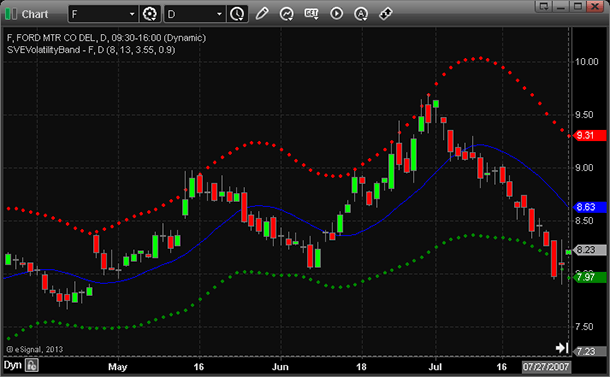
FIGURE 2: eSIGNAL, VOLATILITY BANDS. The EFS study contains formula parameters to set the values for the band average, summing period, deviation factor, and lower band adjustment.
—Jason Keck
eSignal, an Interactive Data company
800 779-6555, www.eSignal.com
BACK TO LIST

THINKORSWIM: AUGUST 2013 TRADERS’ TIPS CODE
In “Within The Volatility Band” in this issue, author Sylvain Vervoort continues with his fourth installment in his seven-part series. This month, he focuses on using historical price movements to define price volatility and builds price bands using those numbers. His price volatility is found by using a common technical analysis statistic, average true range. For thinkorswim users, we have created a strategy in our proprietary scripting language, thinkScript. You can adjust the parameters of the strategy within the Edit Studies window to fine tune the periods calculated.
A sample chart is shown in Figure 3.
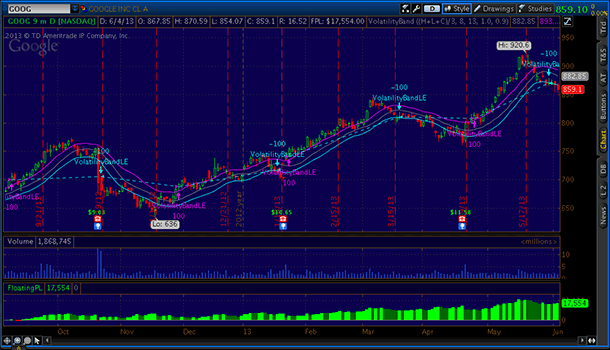
Figure 3: THINKORSWIM. Here is an example of a strategy implemented in thinkorswim based on Sylvain Vervoort’s article in this issue. The strategy is based on average true range and uses historical price movements to define price volatility. It builds price bands using those numbers.
The study:
- From TOS charts, select Studies → Edit studies
- Select the Studies tab in the upper left-hand corner
- Select “New” in the lower left-hand corner
- Name the study (such as “VolatilityBand”)
- Click in the script editor window, remove “addOrder(Order
Type.BUY_AUTO, no);” and paste in the following code:
input price = hlc3;
input averageLength = 8;
input volatilityLength = 13;
input deviationFactor = 3.55;
input lowBandAdjust = 0.9;

def typical = if price >= price[1] then price - low[1] else price[1] - low;
def deviation = deviationFactor * Average(typical, volatilityLength);
def devHigh = ExpAverage(deviation, averageLength);
def devLow = lowBandAdjust * devHigh;
def medianAvg = ExpAverage(price, averageLength);

plot MidLine = Average(medianAvg, averageLength);
plot UpperBand = ExpAverage(medianAvg, averageLength) + devHigh;
plot LowerBand = ExpAverage(medianAvg, averageLength) - devLow;

LowerBand.SetDefaultColor(GetColor(1));
MidLine.SetDefaultColor(GetColor(7));
UpperBand.SetDefaultColor(GetColor(0));

AddOrder(OrderType.BUY_AUTO, close > UpperBand, name = "VolatilityBandLE", tickcolor = GetColor(0), arrowcolor = GetColor(0));
AddOrder(OrderType.SELL_AUTO, close < LowerBand, name = "VolatilityBandLE", tickcolor = GetColor(1), arrowcolor = GetColor(1));
—thinkorswim
A division of TD Ameritrade, Inc.
www.thinkorswim.com
BACK TO LIST

WEALTH-LAB: AUGUST 2013 TRADERS’ TIPS CODE
This Traders’ Tip is based on “Within The Volatility Band” in this issue by Sylvain Vervoort. The strategy code we’re providing this month for a simple SAR (stop-and-reverse) system buys when the close price breaks through the upper volatility band, and sells short when the close slips under the lower band.
To make money with this approach, traders might want to enhance the system with a trend/range filter (like the ADX or Dreiss choppiness index). When a market becomes less directional, there’s not enough room for price reactions. For example, low-probability trades could be avoided when the ADX readings are low.
Motivated readers are welcome to make their own comparisons to similar volatility-based bands available in Wealth-Lab, like ATR bands or Keltner ATR bands, by plugging the DataSeries into the code.
To execute successfully in Wealth-Lab, the system requires the latest version of our TASCIndicators library. Please install (or update if you haven’t
done so already) the library from the www.wealth-lab.com site to its latest
version, 2013.07 or higher. The code is also shown below.
C# Code

using System;
using System.Collections.Generic;
using System.Text;
using System.Drawing;
using WealthLab;
using WealthLab.Indicators;
using TASCIndicators;

namespace WealthLab.Strategies
{
	public class SVEVolatilityBands : WealthScript
	{
		private StrategyParameter paramBandAvg;
		private StrategyParameter paramVolaSum;
		private StrategyParameter paramDevFact;
		private StrategyParameter paramLowBAdj;

		public SVEVolatilityBands()
		{
			paramBandAvg = CreateParameter("Band average", 8, 2, 100, 1);
			paramVolaSum = CreateParameter("Vola Sum period", 13, 2, 100, 1);
			paramDevFact = CreateParameter("Deviation factor", 3.55, 2, 10, 0.1);
			paramLowBAdj = CreateParameter("Low Band Adj.", 0.9, 0.1, 3.0, 0.1);
		}

		protected override void Execute()
		{
			int average = paramBandAvg.ValueInt;
			int volperiod = paramVolaSum.ValueInt;
			double devfact = paramDevFact.Value;
			double lowbandadjust = paramLowBAdj.Value;
			EMACalculation m = EMACalculation.Modern;

			AveragePriceC TypicalPrice = AveragePriceC.Series( Bars );
			EMA emaMedianAvg = EMA.Series(EMA.Series(TypicalPrice,average,m),average,m);
			SVEVolatilityBandUpper UpperBand = SVEVolatilityBandUpper.Series( Bars, average, volperiod, devfact, lowbandadjust );
			SVEVolatilityBandLower LowerBand = SVEVolatilityBandLower.Series( Bars, average, volperiod, devfact, lowbandadjust );

			for(int bar = GetTradingLoopStartBar(average * 3); bar < Bars.Count; bar++)
			{
				// Detect crossover/crossunder and store state in a variable
				bool xo = CrossOver(bar, Close, UpperBand);
				bool xu = CrossUnder(bar, Close, LowerBand);

				// The first trade
				if (Positions.Count == 0){
					if ( xo )
						BuyAtClose( bar );
					else if( xu )
						ShortAtClose( bar );
				}
					// Subsequent trades
				else
				{
					Position p = LastPosition;
					if ( p.PositionType == PositionType.Long )
					{
						if ( xu )
						{
							SellAtClose( bar, p );
							ShortAtClose( bar );
						}
					}
					else if ( xo )
					{
						CoverAtClose( bar, p );
						BuyAtClose( bar );
					}
				}
			}

			PlotSeries(PricePane, emaMedianAvg, Color.Silver, LineStyle.Solid, 2);
			PlotSeriesFillBand(PricePane, UpperBand, LowerBand, Color.Silver, Color.Transparent, LineStyle.Solid, 2);
			HideVolume();
		}
	}
}
A sample chart is shown in Figure 4.
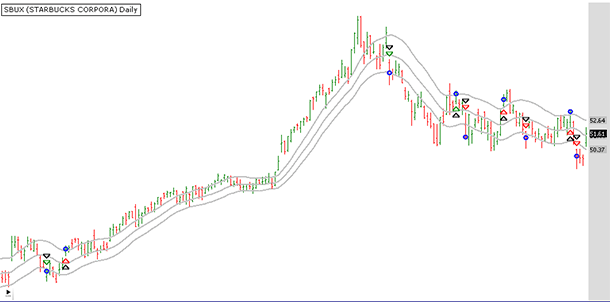
FIGURE 4: WEALTH-LAB. In this sample Wealth-Lab 6 chart, the trend-following system shows a market mood shift from preferable to suboptimal.
—Eugene & Wealth-Lab team
MS123, LLC
www.wealth-lab.com
BACK TO LIST

AMIBROKER: AUGUST 2013 TRADERS’ TIPS CODE
In “Within The Volatility Band” in this issue, author Sylvain Vervoort presents a volatility band component of his swing trading strategy. Ready-to-use AmiBroker code for the indicator is presented here. To display the indicator, simply enter it in the formula editor and press apply indicator. The averaging period and other parameters can be changed by right-clicking the chart and selecting parameters from the context menu.
A sample chart is shown in Figure 5.
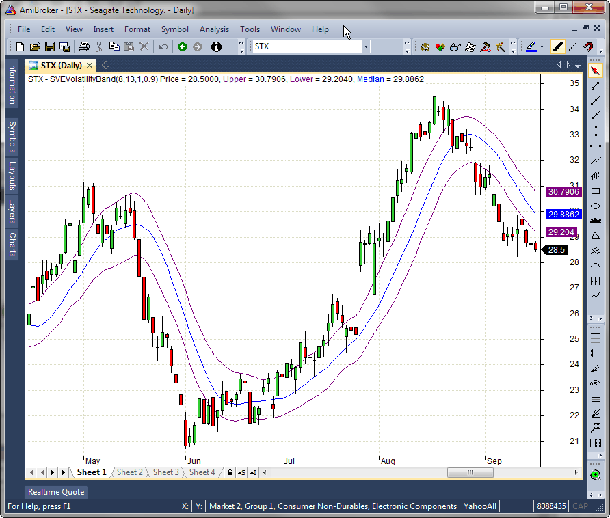
FIGURE 5: AMIBROKER, VOLATILITY BANDS. This price chart of Seagate Technology (STX) with the SVEVolatilityBand overlay replicates results from Sylvain Vervoort’s article elsewhere in this issue.
LISTING 1
average = Param("Band average", 8, 1 );
Volperiod = Param("VolPeriod", 13, 1 );
devfactor = Param("Devfactor", 3.55, 0, 10, 0.01 );
Lowbandadjust = Param("Low band adj.", 0.9, 0, 5, 0.01 );

Typical = ( High + Low + Close )/3;

AdjTyp = IIf( Typical > Ref( Typical, -1 ),
              Typical - Ref( Low, -1 ),
              Ref( Typical, -1 ) - Low );

Deviation = Sum( AdjTyp , VolPeriod )/ VolPeriod * devfactor;

DevHigh = EMA( deviation, average );
DevLow = EMA( deviation, average ) * Lowbandadjust;

Medianaverage = EMA( Typical, average );

Plot( C, "SVEVolatilityBand" + _PARAM_VALUES() + " Price", colorDefault, styleCandle );

Plot( EMA( Medianaverage, average ) + DevHigh, "Upper", colorViolet );
Plot( EMA( Medianaverage, average ) - DevLow, "Lower", colorViolet );
Plot( MA( Medianaverage, average ), "Median", colorBlue );
—Tomasz Janeczko, AmiBroker.com
www.amibroker.com
BACK TO LIST

NEUROSHELL TRADER: AUGUST 2013 TRADERS’ TIPS CODE
The SVEVolatilityBands described by Sylvain Vervoort in his article in this issue, “Within The Volatility Band,” can be implemented with a few of NeuroShell Trader’s 800+ indicators. Simply select “New indicator” from the Insert menu and use the indicator wizard to create the following indicators:
TypicalPrice:  	Average3( High, Low, Close )
TypicalRange:	If ( A>=B( TypicalPrice, Lag(TypicalPrice,1), Subtract(TypicalPrice, Lag(Low,1), Subtract( Lag(TypicalPrice), Low ) )

Deviation:  	Multiply( SimpleMovAvg( TypicalRange, 13), 3.55
MedianAvg:  	ExpAvg( TypicalPrice, 8 )

UpperBand:  	Add2( ExpAvg(MedianAvg, 8 ), ExpAvg( Deviation, 8 ) )
LowerBand:  	Subtract(ExpAvg(MedianAvg, 8 ), Multiply( ExpAvg( Deviation, 8 ), 0.9) )
MedianBand:  	SimpleMovAvg( MedianAvg, 8 )
Users of NeuroShell Trader can go to the Stocks & Commodities section of the NeuroShell Trader free technical support website to download a copy of this or any previous Traders’ Tips.
A sample chart is shown in Figure 6.
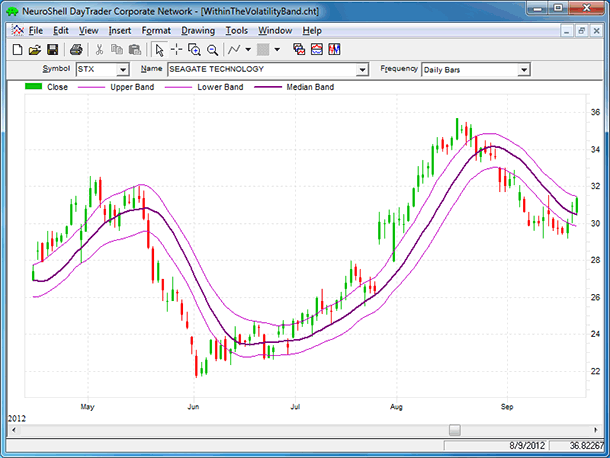
FIGURE 6: NEUROSHELL TRADER, VOLATILITY BANDS. This NeuroShell Trader chart displays Sylvain Vervoort’s SVEVolatilityBands with a deviation factor of 1.
—Marge Sherald, Ward Systems Group, Inc.
301 662-7950, sales@wardsystems.com
www.neuroshell.com
BACK TO LIST

AIQ: AUGUST 2013 TRADERS’ TIPS CODE
The AIQ code I am providing this month is based on Sylvain Vervoort’s article in this issue, “Within The Volatility Band.”
Figure 7 shows a chart of CVR Partners LP (UAN) with the setup (yellow circle), the buy signal (green circle), and the exit (red circle). Vervoort’s article states that a valid buy signal does not occur unless the closing price has penetrated the lower band and then closes above the upper band. On October 3, 2011, the close of 20.25 is below the lower band of 20.81 and then we have to wait until January 3, 2012 for the close of 26.48 to be above the upper band of 25.36. We would enter the next day at the opening price of 26.57. We would stay in the trade until the closing price is below the lower band. The exit does not occur for several months until May 9, 2012, when the close of 24.45 is below the lower band of 27.76. We would then exit the next day at the open of 24.41 for a loss of $2.07 plus commission and slippage. The highest close of the trade occurred on February 2, 2012, just a few weeks after the entry, for a high open profit of $4.35. The trade would have been profitable if we had used the middle band as the exit. Note that I did not code the suggested trading system, since Vervoort indicates that more is to come in future parts of his article series.
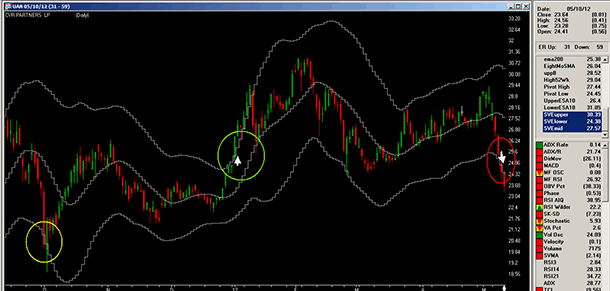
FIGURE 7: AIQ, VOLATILITY BANDS. Here is a sample chart of UAN with the SVE volatility bands and setup (yellow), entry (green), and exit (red) signals for the period October 3, 2011 to May 10, 2012.
The code and EDS file can be downloaded from www.TradersEdgeSystems.com/traderstips.htm, and is also shown below.
!WITHIN THE VOLATILITY BAND

!Author: Sylvain Vervoort

!Coded by: Richard Denning 6/7/2013

!www.TradersEdgeSystems.com


!INPUTS:

BANDAVG is 8.  !average=Band average

VOLASUM is 13. !volperiod=Volatility Summing period

DEVFAC is 3.55. !defac=Deviation factor

LBADJ is 0.9. !lowbandadjust=Low band adjustment factor


!FORMULAS:

H is [high].

L is [low].

L1 is valresult(L,1).

C is [close].

typPrice is (H+L+C)/3.

typPrice1 is valresult(typPrice,1).

typical is iff(typPrice>=typPrice1,typPrice-L1,typPrice1-L).

dev is sum(typical,VOLASUM)/VOLASUM*DEVFAC.

devHigh is expavg(dev,BANDAVG).

devLow is expavg(dev,BANDAVG)*LBADJ.

medAvg is expavg(typPrice,BANDAVG).

HD if hasdatafor(BANDAVG*3+2*VOLASUM)>= BANDAVG*3+2*VOLASUM.


!PLOT THE FOLLOWING AS SINGLE LINE INDICATORS IN THE UPPER PANEL:

SVEupper is iff(HD,expavg(medAvg,BANDAVG)+DevHigh,C).

SVElower is iff(HD,expavg(medAvg,BANDAVG)-DevLow,C).

SVEmid is iff(HD,simpleavg(medAvg,BANDAVG),C).
—Richard Denning
info@TradersEdgeSystems.com
for AIQ Systems
BACK TO LIST

TRADERSSTUDIO: AUGUST 2013 TRADERS’ TIPS CODE
The TradersStudio code based on “Within The Volatility Band” by Sylvain Vervoort in this issue is provided at the following websites:
The following code files are provided in the download:
- Function: “SVE_MID_BAND” is a function that returns the SVE middle band value and also returns by reference the upper band and lower band values
- Indicator plot: “SVE_VOLA_BAND_IND” is a plotting function that allows the SVE bands to be displayed on a chart.
Figure 8 shows a chart of the futures contract on the Australian dollar (AD) using data from Pinnacle Data with the setup (yellow circle), the sell short (red circle), and the exit short (green circle). Vervoort indicates that a valid buy signal does not occur unless the closing price has penetrated the lower band and then closes above the upper band. On October 13, 2000, there is a close above the upper band followed by a close below the lower band on January 28, 2000. We would sell the next day (January 29, 2013) at the open. We would stay in the trade until the closing price is above the upper band. The exit does not occur for several months until December 4, 2000, when the close is above the upper band. We would then exit the next day at the open. This is an excellent example of a profitable trend-following trade using Vervoort’s indicator.
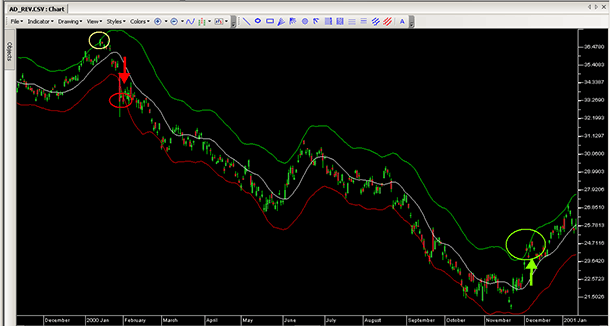
FIGURE 8: TRADERSSTUDIO, VOLATILITY BANDS. Here is a sample chart of ER with the SVE volatility bands and setup (yellow), entry (red), and exit (green) signals for the period December 2000–January 2001.
The code is as follows:
'WITHIN THE VOLATILITY BAND

'Author: Sylvain Vervoort

'Coded by: Richard Denning 6/10/2013

'www TradersEdgeSystems.com


Function SVE_MID_BAND(BANDAVG,VOLASUM,DEVFAC,LBADJ,ByRef SVEupper,ByRef SVElower)

Dim typPrice As BarArray

Dim typical As BarArray

Dim dev As BarArray

Dim devHigh As BarArray

Dim devLow As BarArray

Dim medAvg As BarArray


'INPUT DEFAULTS:

'BANDAVG  = 8   'average=Band average

'VOLASUM  = 13  'volperiod=Volatility Summing period

'DEVFAC  = 3.55  'defac=Deviation factor

'LBADJ  = 0.9  'lowbandadjust=Low band adjustment factor


typPrice = (H+L+C)/3

typical = IIF(typPrice>=typPrice[1],typPrice-L[1],typPrice[1]-L)

dev = Summation(typical,VOLASUM)/VOLASUM*DEVFAC

devHigh = XAverage(dev,BANDAVG)

devLow  = XAverage(dev,BANDAVG)*LBADJ

medAvg = XAverage(typPrice,BANDAVG)


SVEupper  = XAverage(medAvg,BANDAVG)+devHigh

SVElower  = XAverage(medAvg,BANDAVG)-devLow

SVE_MID_BAND  = Average(medAvg,BANDAVG)


End Function

'-------------------------------------------------------------------

'CODE TO PLOT THE BANDS ON A CHART:

sub SVE_VOLA_BAND_IND(BANDAVG,VOLASUM,DEVFAC,LBADJ)

Dim SVEmid As BarArray

Dim SVEupper As BarArray

Dim SVElower As BarArray

SVEmid = SVE_MID_BAND(BANDAVG,VOLASUM,DEVFAC,LBADJ,SVEupper,SVElower)

plot1(SVEupper)

plot2(SVEmid)

plot3(SVElower)

End Sub

'--------------------------------------------------------------------
—Richard Denning
info@TradersEdgeSystems.com
for TradersStudio
BACK TO LIST

NINJATRADER: AUGUST 2013 TRADERS’ TIPS CODE
Editor’s note: In Sylvain Vervoort’s article “Within The Volatility Band” in this issue, Vervoort already provides NinjaScript for his technique in a sidebar to the article. Here, NinjaTrader discusses a separate but related topic.
For this month’s Traders’ Tips, we will discuss standard error bands, which we are providing as an indicator that’s downloadable from www.ninjatrader.com/SC/August2013SC.zip.
Standard error bands can add a valuable and unique perspective to your charts. They are composed of a linear regression midline providing the best-fit trendline over the user-chosen lookback period, which is our period input in the NinjaScript study. We then place an envelope around this midline similar to the Bollinger Band/Keltner channel studies many traders are familiar with; however, in this case, we use the standard error and not the standard deviation to calculate the width of the envelope.
Without getting too deep into statistics, this will provide us with an interesting measurement allowing us to differentiate between trending vs. consolidation periods in our data. As the trending price action starts to unfold, the error will get smaller, since the results “stick” closer to our best-fit regression line, meaning we see a tightening of the bands.
On the other hand, choppy markets generally result in wider standard errors, offering the bands a chance to expand. Further, all band levels (here you have a choice to create two sets of width) can act as excellent support & resistance levels, assisting in trade selection and stop management.
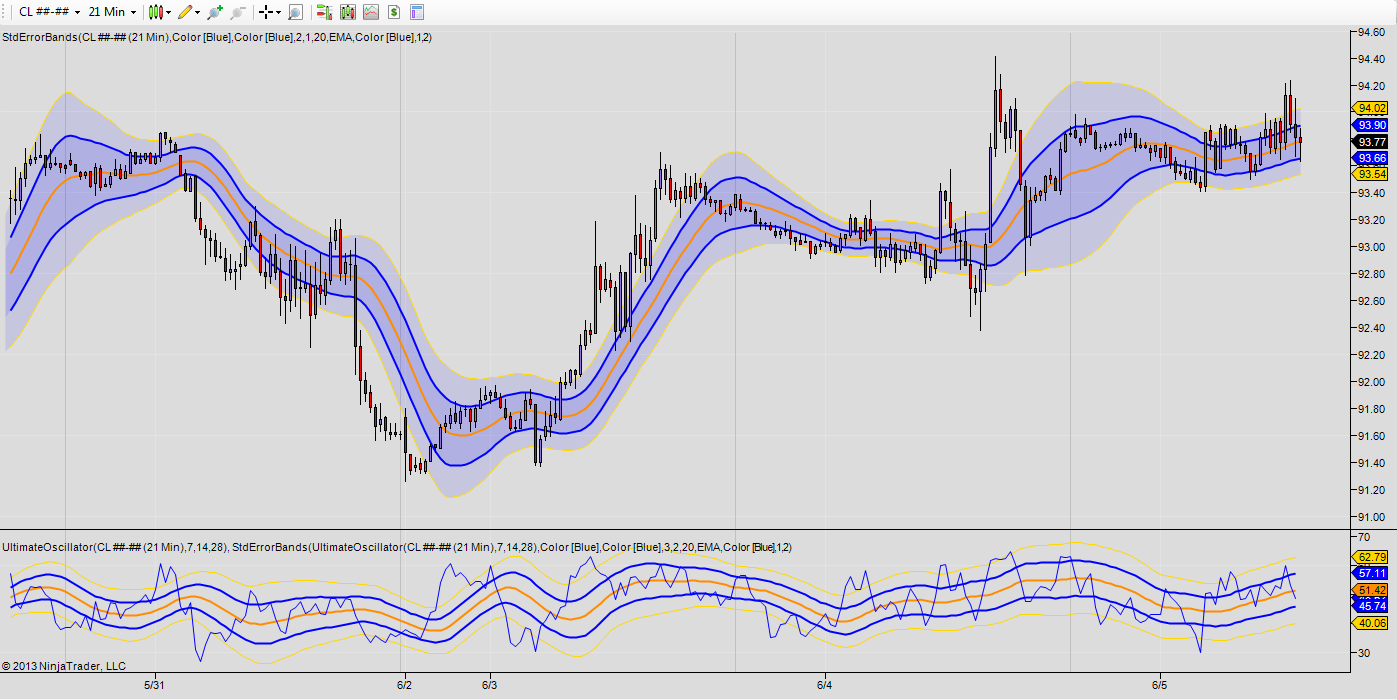
FIGURE 9: NINJATRADER, STANDARD ERROR BANDS. This screenshot shows standard error bands applied to a 21-minute chart of a CL light sweet crude oil continuous contract.
Figure 9 shows that analysis with these bands doesn’t need to be limited to a price series, but can be expanded to oscillator-type studies, for example, as well. In our screenshot, we use our ultimate oscillator supplied as a default in NinjaTrader. As an added benefit, various smoothing algorithms can be set by the SwithMAType user input, providing flexibility.
—Raymond Deux & Bertrand Wibbing
NinjaTrader, LLC
www.ninjatrader.com
BACK TO LIST

UPDATA: AUGUST 2013 TRADERS’ TIPS CODE
This Traders’ Tip is based on “Within The Volatility Band,” which is the fourth part of a seven-part series by Sylvain Vervoort. In this issue, Vervoort discusses volatility bands above and below a median average as levels for a buy & sell swing trading strategy. Breakouts from the upper volatility band signal long positions, and breaks from the lower volatility band indicate short signals. All parameters can be optimized within the system optimizer to determine the most profitable combinations. See Figure 10.
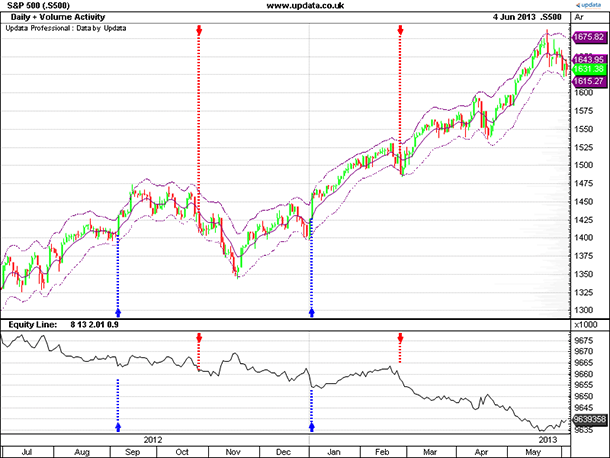
FIGURE 10: UPDATA. This chart shows the volatility band system as applied to the S&P 500 index of daily resolution.
The Updata code for this system has been made available in the Updata library and may be downloaded by clicking the custom menu and then system library. Those who cannot access the library due to a firewall may paste the code into the Updata custom editor and save it.
PARAMETER "Band Period" #BANDPERIOD=8
PARAMETER "Vol. Period" #VOLPERIOD=13
PARAMETER "Deviation Factor" @FACTOR=3.55
PARAMETER "Low Band Adjust" @ADJUST=0.9
NAME "" ""
DISPLAYSTYLE 3LINES
INDICATORTYPE TOOL
PLOTSTYLE LINE RGB(128,0,128)
PLOTSTYLE2 DOT RGB(128,0,128)
PLOTSTYLE3 DOT RGB(128,0,128)
@TypicalPrice=0
@Typical=0
@Deviation=0
@DevHigh=0
@DevLow=0
@MedianAverage=0
FOR #CURDATE=0 TO #LASTDATE
   @TypicalPrice=(HIGH+LOW+CLOSE)/3
   IF @TypicalPrice>HIST(@TypicalPrice,1)
      @Typical=@TypicalPrice-LOW(1)
   ELSE
      @Typical=HIST(@TypicalPrice,1)-LOW
   ENDIF
   @Deviation=SGNL(@Typical,#VOLPERIOD,M)*@FACTOR
   @DevHigh=SGNL(@Deviation,#BANDPERIOD,E)
   @DevLow=SGNL(@Deviation,#BANDPERIOD,E)*@ADJUST
   @MedianAverage=SGNL(@TypicalPrice,#BANDPERIOD,E)
   'Entries & Exits Upon Band Crossing
   IF HASX(CLOSE,@MedianAverage+@DevHigh,UP)
      COVER CLOSE
      BUY CLOSE
   ELSEIF HASX(CLOSE,@MedianAverage-@DevLow,DOWN)
      SELL CLOSE
      SHORT CLOSE
   ENDIF
   'Line Plots
   @PLOT=@MedianAverage
   @PLOT2=@MedianAverage+@DevHigh
   @PLOT3=@MedianAverage-@DevLow
NEXT
—Updata support team
support@updata.co.uk
www.updata.co.uk
BACK TO LIST

TRADESIGNAL: AUGUST 2013 TRADERS’ TIPS CODE
The indicators presented by Sylvain Vervoort in his article in this issue, “Within The Volatility Band,” which is the fourth part of a seven-part series on indicator rules for a swing trading strategy, can easily be used with our online charting tool at www.tradesignalonline.com.
To locate the indicators, just check the Infopedia section for our lexicon. There, you will find the indicator and the functions that you can make available for your personal account. Click on it and select open script. You can then apply it to any chart you wish (Figure 11).
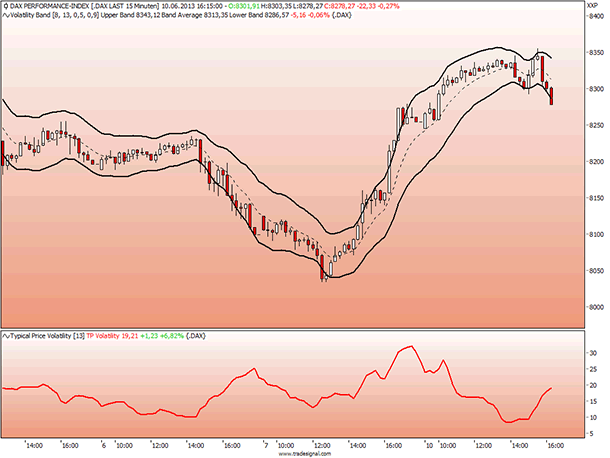
FIGURE 11: TRADESIGNAL ONLINE. This Tradesignal Online chart shows the volatility band and the typical price volatility indicator on an intraday chart of the German DAX.
Source Code for Typical Price Volatility.eqi

Meta:
	Synopsis("Volatility Oscillator derived from the Typical Price of the Period. Based on TAS&C 08 2013 'Within the volatility Band'"),
	WebLink("https://www.tradesignalonline.com/lexicon/edit.aspx?id=20071"),
	Subchart( True );

Inputs:
	Period_VolaBands( 8 , 1 ),
	Period_Vola( 13 , 1 );

Vars:
	volaValue, tpSeries, devHigh, devLow, midLine, upperBand, lowerBand;

tpSeries = IFF( TypicalPrice > = TypicalPrice[1], TypicalPrice - Low[1], TypicalPrice[1] - Low );
volaValue = Sum( tpSeries, Period_Vola ) / ( Period_Vola );

DrawLine( volaValue, "TP Volatility", StyleSolid, 2, red );

// *** Copyright tradesignal GmbH ***
// *** www.tradesignal.com ***


Source Code for Volatility Band .eqi


Meta:
	Synopsis("Volatility Oscillator derived from the Typical Price of the Period. Based on TAS&C 08 2013 'Within the volatility Band'"),
	WebLink("https://www.tradesignalonline.com/lexicon/edit.aspx?id=20071"),
	Subchart( False );

Inputs:
	Period_VolaBands( 8 , 1 ),
	Period_Vola( 13 , 1 ),
	Dev_Factor( 3.55 ),
	Low_Band_Adjust( 0.9 );

Vars:
	volaValue, tpSeries, devHigh, devLow, midLine, upperBand, lowerBand;

tpSeries = IFF( TypicalPrice > = TypicalPrice[1], TypicalPrice - Low[1], TypicalPrice[1] - Low );
volaValue = Sum( tpSeries, Period_Vola ) / ( Period_Vola * Dev_Factor );
devHigh = XAverage( volaValue, Period_VolaBands );
devLow = XAverage( volaValue, Period_VolaBands ) * Low_Band_Adjust;
midLine = XAverage( TypicalPrice, Period_VolaBands );

lowerBand = midLine - devLow;
upperBAnd = midLine + devHigh;

GR_DrawSetupTradingBands( upperBand, midLine, lowerBand );

// *** Copyright tradesignal GmbH ***
// *** www.tradesignal.com ***

Source Code for GR_DrawSetupTradingBands.eqf


Inputs:
	UpperBand( NumericSeries ),
	MidLine( NumericSeries ),
	LowerBand( NumericSeries );

DrawLIne( upperBand, "Upper Band", StyleSolid, 2, Black );

If midLine >  0 Then
	DrawLIne( MidLine, "Band Average", StyleDash, 1, Black );

DrawLIne( lowerBand, "Lower Band", StyleSolid, 2, Black );

GR_DrawSetupTradingBands = True;
—Tradesignal GmbH
support@tradesignalonline.com
www.TradesignalOnline.com, www.Tradesignal.com
BACK TO LIST

VT TRADER: AUGUST 2013 TRADERS’ TIPS CODE
This Traders’ Tip is based on “Within The Volatility Band” by Sylvain Vervoort in this issue.
We’ll be offering the SVE volatility band indicator for download in our VT client forums at https://forum.vtsystems.com along with many other precoded indicators and trading systems. A sample chart is shown in Figure 12.
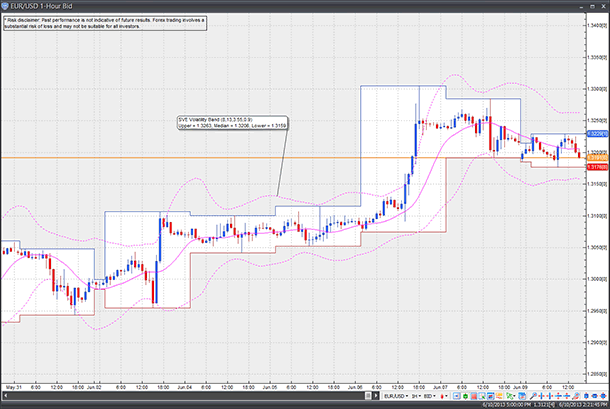
Figure 12: VT TRADER, VOLATILITY BANDS. Here is an example of the SVE volatility band indicator attached to a EUR/USD one-hour candlestick chart.
The VT Trader instructions for creating the aforementioned indicator are as follows:
- VT Trader’s Ribbon → Technical Analysis menu → Indicators group → Indicators Builder → [New] button
- In the General tab, type the following text into each corresponding text box:
Name: TASC - 08/2013 - SVE Volatility Band
Function Name Alias: tasc_SveVolBand
Label Mask:
SVE Volatility Band (%average%,%volperiod%,%devfact%,%lowbandadjust%)
Upper = %UpperBand%, Median = %MedianBand%, Lower = %LowerBand%Placement: Price Frame
Data Inspection Alias: SVE Volatility Band
- In the Input Variable(s) tab, create the following variables:
[New] button...
Name: average
Display Name: Band Average
Type: integer
Default: 8

[New] button...
Name: volperiod
Display Name: Volatility Summing Period
Type: integer
Default: 13

[New] button...
Name: devfact
Display Name: Deviation Factor
Type: float
Default: 3.55

[New] button...
Name: lowbandadjust
Display Name: Low Band Adjustment
Type: float
Default: 0.9
- In the Output Variable(s) tab, create the following variables:
[New] button...
Var Name: UpperBand
Name: Upper Band
Line Color: magenta
Line Width: 1
Line Type: dashed line

[New] button...
Var Name: LowerBand
Name: Lower Band
Line Color: magenta
Line Width: 1
Line Type: dashed line

[New] button...
Var Name: MedianBand
Name: Median Band
Line Color: magenta
Line Width: 1
Line Type: solid line
- In the Formula tab, copy and paste the following formula:
{Provided By: Visual Trading Systems, LLC}
{Copyright: 2013}
{Description: TASC, August 2013 - ""Within The Volatility band" by Sylvain Vervoort}
{File: tasc_SveVolBand.vtscr - Version 1.0}

{basic volatility in a new "typical" data series}
_typical:= if(TP()>ref(TP,-1),TP()-ref(L,-1),ref(TP(),-1)-L);

{basic deviation based on "typical" over a period and a factor}
deviation:= Sum(_typical,volperiod) / volperiod * devfact;

{the average deviation high and low adjusted band}
devhigh:= Mov(deviation,average,E);
devlow:= Mov(deviation,average,E) * lowbandadjust;

{the middle reference average}
medianaverage:= Mov(TP(),average,E);

{creation of the upper and lower band
and show only after it is stable}
_CalcIsStable:= BarCount() > (average * 3 + 2 * volperiod);
UpperBand:= If(_CalcIsStable=1,Mov(medianaverage,average,E) + devhigh,Null);
LowerBand:= If(_CalcIsStable=1,Mov(medianaverage,average,E) - devlow,Null);
MedianBand:= If(_CalcIsStable=1,Mov(medianaverage,average,S),Null);
To learn more about VT Trader, visit www.vtsystems.com.
Risk disclaimer: Past performance is not indicative of future results. Forex trading involves a substantial risk of loss and may not be suitable for all investors.
—Visual Trading Systems, LLC
vttrader@vtsystems.com, www.vtsystems.com
BACK TO LIST

TRADING BLOX: AUGUST 2013 TRADERS’ TIPS CODE
In “Within The Volatility Band” in this issue, author Sylvain Vervoort provides a method to calculate the SVE volatility band indicator, which may be used as a tool to help make buy & sell decisions within the context of a trading system.
To use the SVE bands in Trading Blox, we’ve created a block that defines them as indicators. This block may be dropped into a Trading Blox system along with other Blox that determine entry & exit rules, trade sizing, and so on, to provide a complete trading method.
To recreate the band indicators, we first set up a new block called “SVE Volatility Band Indicator.” Vervoort’s article instructs us to create four parameters that act as inputs to our calculations along with several expressions that apply some mathematical transformations to various data inputs. See Figure 13 for a list of the indicators and parameters we used.
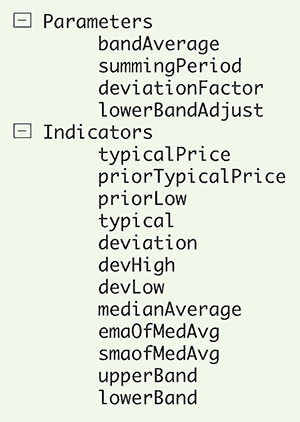
FIGURE 13: TRADING BLOX, SVE VOLATILITY BANDS INDICATOR BLOCK. The SVE band indicator block is made up of four parameters and 12 indicators.
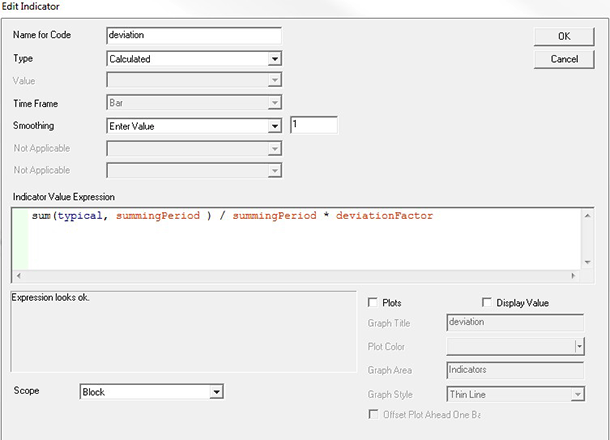
FIGURE 14: TRADING BLOX, DEVIATION FACTOR. Several of the expressions needed to calculate the bands are coded in Trading Blox as calculated indicators, as deviation is here.
No code needs to be written in the main scripting editor for this block, but some expressions are coded in the indicator value expression editor (Figure 14). They include:
- typicalPrice = High + Low + Close / 3
- priorTypicalPrice = typicalPrice[1]
- priorLow = instrument.low[1]
- typical = ifthenelse( typicalPrice >= priorTypicalPrice, typicalPrice - priorLow, priorTypicalPrice - instrument.low)
- deviation = sum(typical, summingPeriod ) / summingPeriod * deviationFactor
- devHigh = EMA( devHigh[1], bandAverage, deviation )
- devLow = EMA( devLow[1], bandAverage, deviation ) * lowerBandAdjust
- medianAverage = EMA( medianAverage[1], bandAverage, typicalPrice )
- emaOfMedAvg = EMA( emaOfMedAvg[1], bandAverage, medianAverage )
- smaofMedAvg = average( medianAverage, bandAverage )
- upperBand = emaOfMedAvg + devHigh
- lowerBand = emaOfMedAvg - devLow
Once they have been defined in this block, the bands may be plotted on a chart (Figure 15).
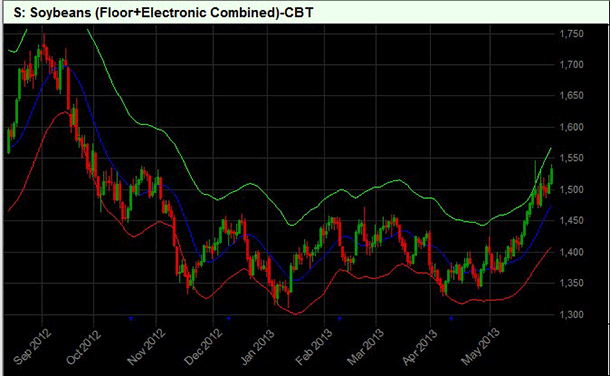
FIGURE 15: TRADING BLOX, SVE VOLATILITY BANDS. The upper band is shown in green, with the lower band in red, while the moving average of median average plots in between in blue.
A simple entry/exit block (see the “SVE Band Entry Exit” block in our code archive) consisting of the following code may be used to generate trading signals to go long when price closes above the upper band and short when price closes below the lower band.
-----------------------------------------------------------------------------------
SCRIPT: Entry Orders
-----------------------------------------------------------------------------------

if instrument.position != LONG then
	if instrument.close > upperBand then broker.enterLongOnOpen( lowerBand )
endif

if instrument.position != SHORT then
	if instrument.close < lowerBand then broker.enterShortOnOpen( upperBand )
endif

-----------------------------------------------------------------------------------
SCRIPT: Exit Orders
-----------------------------------------------------------------------------------
if instrument.position == LONG then
	if instrument.close < lowerBand then broker.exitAllUnitsOnOpen
endif

if instrument.position == SHORT then
	if instrument.close > upperBand then broker.exitAllUnitsOnOpen
endif
Combined with our built-in fixed fractional money manager block to provide the quantity to purchase or sell on each trade, we have a complete trading system that buys and sells a specific quantity on each signal (Figure 16).
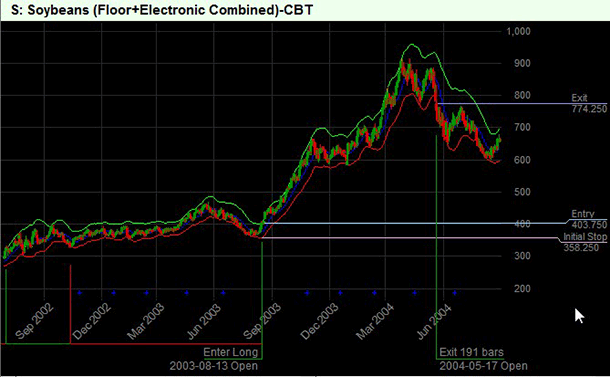
FIGURE 16: TRADING BLOX, SAMPLE TRADE. The system goes long when price closes above the green band and reverses to short when price closes below the red band. The entry price, the initial stop at the opposite volatility band, and the exit price are shown for the last trade on the chart.
More advanced entry/exit rules might be used to filter trade signals, trail a stop, or otherwise augment this basic timing mechanism.
—Trading Blox
tradingblox.com
BACK TO LIST
MICROSOFT EXCEL: AUGUST 2013 TRADERS’ TIPS CODE
In “Within The Volatility Band” in this issue, Sylvain Vervoort presents the fourth part of a seven-article series on indicator rules for a swing trading strategy (IRSTS). This month, he defines his volatility band indicator and explains some of the appropriate uses for it. The SVE volatility bands are shown in Figure 17.
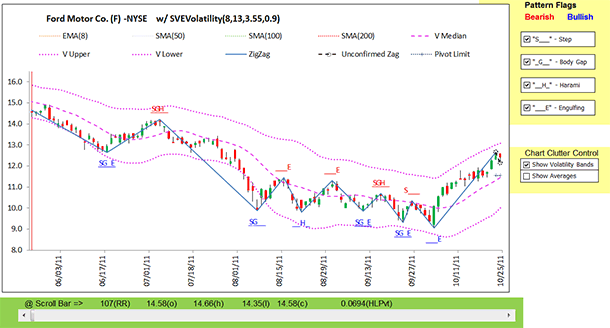
FIGURE 17: EXCEL, VOLATILITY BANDS. This sample chart shows the default volatility bands with zigzag.
This month’s Excel spreadsheet updates the one I presented last month for part 3 of Vervoort’s series to add the volatility band indicator.
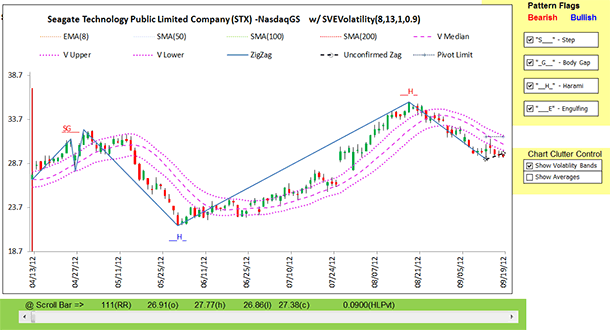
FIGURE 18: EXCEL, DEVIATION FACTOR OF 1. This chart shows the volatility bands with a deviation factor of 1, similar to Figure 4 from Sylvain Vervoort’s article in this issue.
Figure 18 shows volatility bands with a deviation factor of 1. Vervoort suggests that this setting can be used to define buy & sell triggers:
Buy: Closing price crossing above the upper band.
Long continues largely above the V median.
The lower band serves as a stop-loss level.
Sell: Closing price crossing below the lower band.
Short continues largely below the V median.
The upper band serves as a stop-loss level.
The spreadsheet file for this Traders’ Tip can be downloaded here. To successfully download it, follow these steps:
- Right-click on the Excel file link, then
- Select “Save target as” to place a copy of the spreadsheet file on your hard drive.
—Ron McAllister
Excel and VBA programmer
rpmac_xltt@sprynet.com
BACK TO LIST
Originally published in the August 2013 issue of
Technical Analysis of Stocks & Commodities magazine.
All rights reserved. © Copyright 2013, Technical Analysis, Inc.
Return to
Contents


