INDICATORS
Take It From The Top, Or Bottom
In this fourth part of a seven-part series, we look at catching reversals using the boundaries of volatility bands.
One of the indicator rules for my swing trading strategy (IRSTS) is to catch potential reversal points using the upper and lower boundaries of volatility bands. In this article, I will show you how to create volatility bands and use them to make buy & sell decisions.
MEASURING VOLATILITY
There are many ways to measure price volatility; one of the common ways is to use the average true range (ATR), originally developed by J. Welles Wilder and introduced in his book New Concepts In Technical Trading Systems. The true range indicator is the greatest of the following:
Simply put, a stock experiencing a high level of volatility will have a higher ATR, and a low volatility stock will have a lower ATR.
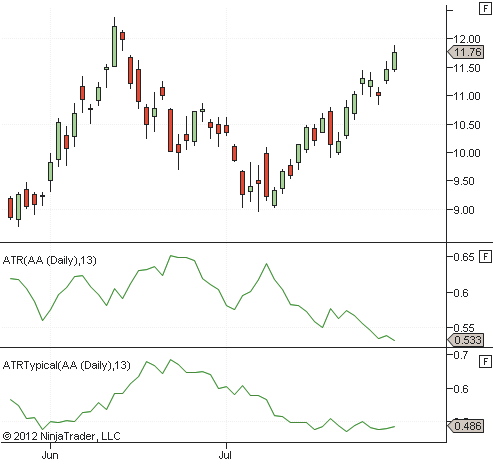
Personally, I prefer to smooth results right from the first data manipulation, which is why instead of using the closing price, I start with typical data, which is the high + low + close divided by three.
When the typical price of today is greater than or equal to yesterday’s typical price, I will then use the typical price of today minus the low price of yesterday. When the typical price of today is less than yesterday’s typical price, I will use the difference between the typical price of yesterday minus the low price of today.

FIGURE 1: 13-PERIOD ATR GRAPH (MIDDLE PANE) AND SMOOTHER ATR (BOTTOM PANE). The rising or falling volatility in a selected time period will usually be smoother than the Wilder ATR.
By default, I smooth this data by summing a 13-day period. In Figure 1 you can see the difference between a standard 13-period ATR graph in the middle and the smoother ATR typical graph at the bottom. The rising or falling volatility in a selected time period will usually be smoother than the Wilder ATR. This better suits the purpose behind the volatility band I want to create.