TRADING TECHNIQUES
'Tis The Season
Christmas Comes Early With The DJIA
by John L. Momsen
Diving into the Dow Jones Industrial Average is made easier with this seasonal timing trick.
On December 15, like all December 15s in the past 80 years, a gilt-edged invitation for seasonal trading profits will arrive at your door. You, along with millions of your fellow investors, will be asked to attend the most historically profitable equity trading opportunity of the year. Will you accept the invitation, or will you pass up this golden opportunity to learn the secret of the miracle market strategy that produced profits even during the disastrous decade of the Great Depression? Even veterans of the trading wars may have forgotten this goody.

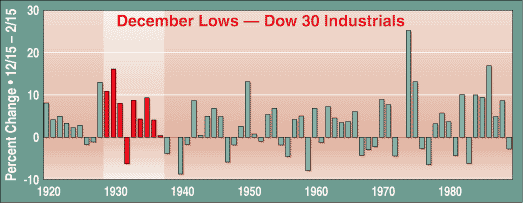
FIGURE 1: BUYING THE DOW. It's hard to lose if you buy the mid-December lows of stocks.
THE STRATEGY
What is this seasonal strategy that's been profitable 55 out of the last 80 years (1920-99)? It's a simple trading technique that Yale Hirsch in his Stock Trader's Almanac refers to as "Mid-December New Lows -- The Only Free Lunch On Wall Street." Hirsch has been following this seasonal technique since 1970 with great results. The strategy is simple: buy stocks making new lows during mid-December and exit the trade in mid-February (on or about February 15).
Figure 1 shows the historical results of the strategy from 1920 to 1989. This method even proved profitable in the 1930-40 period, the Great Depression. During that time, the Dow Jones Industrial Average (DJIA) plunged from 245.90 on December 15, 1929, to 148.20 on February 15, 1940, a loss of 97.70 points or 40%! This simple system actually produced profits of 79.96 points or 33%, while being in the market only 41 days per year.
I decided to construct a parallel technique that would be useful in trading futures indices. Here's how I did it.
THE BEGINNING
To begin my construction of the trading system, I had a few decisions to make. The first was what data to use for my tests. This was the easiest decision to make. My available data on the Dow 30 industrials cash index dates back to January 2, 1920, and includes many market recessions and transformations. It also includes the worst recession of all, the Great Depression of the 1930s. I set aside the data from March 3, 1990, to the present to use in out-of-sample testing.
John Momsen has been an active private trader for the last 25 years. He may be reached by E-mail at mumps@cyberg8t.com
Excerpted from an article originally published in the January 2001 issue of Technical Analysis of STOCKS & COMMODITIES magazine. All rights reserved. © Copyright 2000, Technical Analysis, Inc.
Return to January 2001 Contents