BASIC TECHNIQUES
Momentum Indicators Come In All Shapes And Forms
Trading Momentum:
Overbought And Oversold Levels
by Martin J. Pring
This veteran trader and market analyst starts a new series, this time discussing the basics of momentum trading.
Momentum measures the velocity of a price move and is a generic term that describes the oscillators plotted under the price series of many charts. The same way that the word fruit encompasses apples, oranges, grapes, bananas, and more, momentum embraces a host of individual indicators, such as rate of change, relative strength index (RSI), moving average convergence/divergence (MACD), and stochastics, as can be seen in Figure 1.
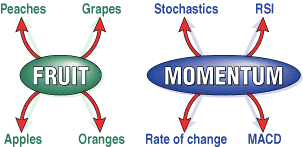
FIGURE 1: MOMENTUM INDICATORS. Like various forms of fruit, there are various forms of momentum indicators. These four indicators are the most popular for assessing momentum, but there are many more.
Each indicator has different attributes, but the principles of interpretation
apply to them all. Think of it this way: Fruit is typically sweet and is
almost always grown at the time of year when the climate is warmest. Each
has individual characteristics and grows only in specific climates and
seasons; some fruits are sweeter than others, some require hot temperatures,
and others a long growing season. Likewise, momentum indicators have some
common characteristics, but they differ in their interpretive properties.
Some momentum indicators are more suited to specific rules than others.
For example, the rate of change indicator lends itself to trendline construction, as does the stochastic indicator. It is not normally interpreted that way, however, because the stochastic is constructed from moving averages, which results in a smooth oscillator that is generally unsuitable for trendline construction. In this series of articles, I will examine several of these principles of momentum indicators, including their strengths and weaknesses.
TIME FRAMES
In technical analysis, we are concerned with identifying trend reversals relatively early and, assuming that the new trend continues, riding that trend until it reverses. I always assume that the prevailing trend is in force until the evidence proves otherwise; one isolated indicator pointing to a trend reversal is insufficient. All indicators, however good, can and do fail from time to time. We must take a consensus approach using several indicators, each confirming the other. When the majority of the indicators agree, we can be more confident that the trend has indeed reversed. In that regard, momentum indicators can provide us with a substantial amount of evidence.
Martin Pring is a principal at the International Institute for Economic Research. To contact him or for additional information, go to www.pring.com.
Excerpted from an article originally published in the January 2001 issue of Technical Analysis of STOCKS & COMMODITIES magazine. All rights reserved. © Copyright 2000, Technical Analysis, Inc.
Return to January 2001 Contents