| NEUROSHELL TRADER | |
| AIQ TRADINGEXPERT | |
| INVESTOR/RT | |
| TRADINGSOLUTIONS | |
| TECHNIFILTER PLUS | |
| SMARTTRADER | |
| WAVE WI$E MARKET SPREADSHEET |
or return to January 2001 Contents
You can copy these formulas and programs for easy use in your spreadsheet
or analysis software. Simply "select" the desired text by highlighting
as you would in any word processing program, then use your standard key
command for copy or choose "copy" from the browser menu. The copied text
can then be "pasted" into any open spreadsheet or other software by selecting
an insertion point and executing a paste command. By toggling back and
forth between an application window and the open Web page, data can be
transferred with ease.
This month's tips include formulas and programs for:
NEUROSHELL TRADER AIQ TRADINGEXPERT INVESTOR/RT TRADINGSOLUTIONS TECHNIFILTER PLUS SMARTTRADER WAVE WI$E MARKET SPREADSHEET or return to January 2001 Contents
GO BACKJayanthi Gopalakrishnan's range index described elsewhere in this issue is very easy to build in NeuroShell Trader using existing standard indicators that find the highest high, the lowest low, and the log.
NEUROSHELL TRADER
The first indicators you'll need are in the arithmetic category. First, insert the divide indicator. For the denominator of the divide indicator, insert the log indicator, setting the log operand equal to the number of time periods. For the numerator, insert the log indicator, and for the operand of the log, insert the subtract indicator.
Next, in the subtract indicator, insert the maximum value indicator as the first operand and the minimum value as the second operand. These are found in the basic category. Set the time series for the maximum value to the high, and set the time series for the minimum value to the low. That's it!
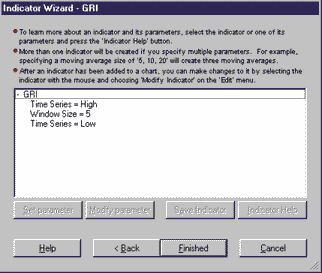
NEUROSHELL FIGURE 1: This screen displays the parameters for the GAPO once it has been saved as a custom indicator in NeuroShell Trader Professional.
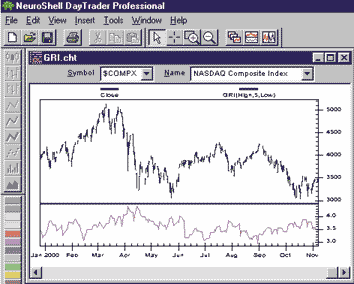
Users of NeuroShell Trader Professional and DayTrader Professional will want to optimize the time period of the Gopalakrishnan range index (GAPO). As a default, the optimizer is capable of optimizing the period parameters (n) separately in the highest high, the lowest low, and the log. However, that is probably not appropriate for the GAPO. To make the genetic algorithm optimizer, treat all of the periods as one value; you can save the GAPO you build as a custom indicator (Figure 1). While saving, use the "advanced" button to modify the second and third period parameters (n), applying them to the first period parameter (n). That way, all three period parameters become the same one so the value that the optimizer finds for one is the same value used by all. Figure 2 shows a sample NeuroShell Trader chart with the GAPO applied.
While you are saving, you can name the indicator whatever you want and give it its own category, too.NEUROSHELL FIGURE 2: This chart displays the custom indicator GAPO applied to the Nasdaq composite index in NeuroShell Trader Professional. Users of NeuroShell Trader can go to the STOCKS & COMMODITIES section of NeuroShell Trader's free technical support Website to download an example chart and the custom indicator template for GAPO that we have already built. For more information on NeuroShell Trader, visit www.NeuroShell.com.
--Marge Sherald, Ward Systems Group, Inc.301 662-7950
sales@wardsystems.com
https://www.neuroshell.com
Here is some EDS code for AIQ TradingExpert that implements the Gopalakrishnan range index:
GO BACK! Gopalakrishnan Range Index (GRI) ! or Range of Chaos Index (ROCI) ! AIQ EDS codes by Onnfoh Yu Define ChoaticPeriod 5. GRI is Log10(HiVal([Close],ChoaticPeriod) - LoVal([Close],ChoaticPeriod))/Log10(ChoaticPeriod).--Onnfoh Yu, AIQ TradingExpert user
Here is the Gopalakrishnan range index (GAPO) formula using Real Time Language in Investor/RT:
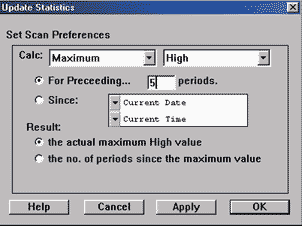
GO BACKwhere:(LOG( STATa-STATb ))/LOG( 5 )STATa is set to the highest high over five periods (Figure 3)
STATb is set to the lowest low over five periods.
FIGURE 3: INVESTOR/RT, GOPALAKRISHNAN RANGE INDEX. Set up a scan in Investor/RT to identify the maximum high and minimum low.
Here, the STAT token is used, allowing you to identify the maximum high and minimum low.--Eric HynnimanLinn Software
800 546-6842
404 733-5733
sales@linnsoft.com
https://www.linnsoft.com
TradingSolutions allows the user to enter custom formulas as function definitions that the user can apply to any stock or data series in his or her portfolio. These functions can also be exported to be shared with other users.
The Gopalakrishnan range index presented in Jayanthi Gopalakrishnan's article in this issue can be entered as:
GO BACKThis function is available in a function file that can be downloaded from our Website in the Solution Library section. It can then be imported into TradingSolutions using "Import Functions..." from the File menu.Div ( Ln ( Sub ( Highest ( High, Period ), Lowest ( Low, Period ) ) ), Ln ( Period ) )To apply one of these imported functions to a stock or group of stocks, select "Add new field..." from the context menu for the stock or group, select "Calculate a value...," then select the desired function from the "Traders Tips Functions" group.
--Gary Geniesse, TradingSolutions Project LeadNeuroDimension, Inc.
800 634-3327, 352 377-5144
info@tradingsolutions.com
https://www.tradingsolutions.com
GO BACKBelow is the TechniFilter Plus formula that computes the range index given in Jayanthi Gopalakrishnan's article in this issue. The formula uses the TechniFilter Plus U9-modifier to compute the logarithm required.
Visit RTR's Website at https://www.rtrsoftware.com to download this formula as well as program updates. Release 8.3 is now available for download.Formula for Gopalakrishnan Range Index NAME: GRI PARAMETERS: 5 FORMULA: ( HM&1 - LN&1)U9 / &1U9--Clay Burch, RTR Software919 510-0608
E-mail: rtrsoft@aol.com
https://www.rtrsoftware.com
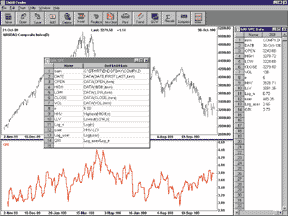
GO BACKCreating the Gopalakrishnan range index (GAPO) presented by Jayanthi Gopalakrishnan in her article in this issue is easy in SmarTrader. We will break the formula down into a few easy-to-chew pieces.
Begin by adding a Coef (coefficient), row 8 in Figure 4, with a value of 5, and named n. This is the number of periods used in the article. Rows 9 and 10 calculate the highest high (HHV) and lowest low (LLV) using functions of the same name found in the Functions menu. Both of these functions use the coefficient n for the number of periods to cover.
FIGURE 4: SMARTRADER. Here is the SmarTrader specsheet and sample chart implementing the Gopalakrishnan range index.
Row 11 calculates the log of n. Row 12 is a user formula row to calculate the difference of HHV and LLV. Row 12 uses the log function to get the log of the user formula, the difference of HHV and LLV. Row 14, also a user row, calculates the Gopalakrishnan range indexBy using a Coef for the value of n, it is easy to test varying numbers of periods, since HHV, LLV, and Log_n all use b for their number of periods.
Users of CompuTrac SNAP can also use this formula.
--Jim Ritter, Stratagem Software International504 885-7353, E-mail: Stratagem1@aol.com
Internet: https://www.stratagem1.com
GO BACKThe following WAVE WI$E formulas show how to compute the Gopalakrishnan range index for any time period.
A: DATE @TC2000(C:\TC2000V3\Data,SP-500,Standard & Poors 500,DB)
B: HIGH
C: LOW
D: CLOSE
E: OPEN
F: VOL
G: Period       30              ÔSet desired period
H: GRI          @LOG(@MAX(HIGH,PERIOD) - @MIN(LOW,PERIOD))/@LOG(PERIOD)
I:
J: chart        @CHART(1)
K:

==========End Formulas
--Peter Di Girolamo, Jerome Technology908 369-7503, E-mail: jtiware@aol.com
https://members.aol.com/jtiware