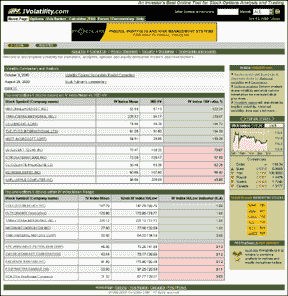
At IVolatility.com, you can find volatility data for all optionable
stocks in the US. After each trading day, the data is scanned and the top
results displayed on the homepage (Figure 1). You see the five top stocks
and the five bottom ones, ranked based on a number of measures such as
the implied volatility (IV) mean versus the 30-day historical volatility
(HV), the IV index mean range, stocks with the greatest IV change since
yesterday, and the volatility skew.
The mining and filtering technology behind IVolatility has been developed
by EGAR Technology. A click on any of the symbols will display a chart
of the underlying stock as well as volatility data. Price and volatility
charts are also displayed. These charts can be enlarged in a separate browser
window.
The features available include options analysis (which lets you view
a complete options analysis of any stock), data for historical volatility,
implied volatility, and a historical 30-day correlation against the Standard
& Poor's 500, and options data for both puts and calls.
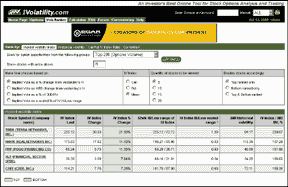
FIGURE 2: VOLATILITY RANKER. This feature ranks stocks
based on implied volatility index, historical volatility, call/put index
ratio, and correlation.
The volatility ranker (Figure 2) ranks stocks based on the implied volatility
index, historical volatility, call/put index ratio, and correlation. Scans
can be grouped by top 200 options volume, top 200 options open interest,
Dow Jones Industrial Average (DJIA) stocks, S&P 500 stocks, Nasdaq
100 stocks, European stocks, and Japanese stocks. European and Japanese
stock information is only available to those who have subscribed to the
service at $9.95 per month.
The option calculator automatically plugs in the previous day's closing
stock price, the at-the-money strike, the nearest expiration month, number
of days to expiration, dividends if applicable, the appropriate interest
rate and the implied volatility, and determines put and call option values
and all the greeks. All you have to do is enter the stock symbol. You can
go back and adjust any of the input variables and recalculate, as well
as choose between American and European option styles.
Other features include a forum for registered users and a commentary
section, which includes articles analyzing current market conditions.
Interested users should register to gain full access to the site. Ivolatility
does not redistribute any of your information, so you will not get bombarded
with e-spam mail, and the basic features of the site are free. Only subscribers
to the advanced features such as data download and special filtering tools
are charged for access. Subscribers simply select which services they want.
Fees range from $9.95 to $39.95.
Overall, there is a wealth of option volatility information available
on IVolatility.com. It is easy to use and contains useful, detailed information
that is free of charge, and there's even more information for the taking
if you're willing to subscribe. Overall, the Website's worth a look.
-- Jayanthi Gopalakrishnan
Technical Editor
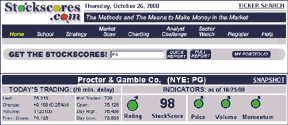
You're greeted with a home page (Figure 3), a graphic of the highest-scoring
stock sorted by price volume (price multipled by volume), a price history
chart, and the 10 most active stocks in the NYSE, Nasdaq, OTCBB, TSE, and
CDNX.
You then enter virtually any symbol from a range of markets and get
either a quick report or a full one. The quick report provides summary
information and a price chart for which the user is limited to specifying
two simple moving averages. The full report covers all the indicators,
and for some includes a color scheme and arrow to indicate degrees of bullishness
or bearishness.
The stock score is calculated with a proprietary model and ranges from
zero to 100, with zero being very bearish and 100 being very bullish. I
asked Stockscores to provide score histories for 10 securities. In response,
Stockscores provided me with scores for all 10 from May 30 through October
18 and included a 10-day exponential moving average of the scores to dampen
the ups and downs. Using the scores as buy and sell signals didn't work
well, especially with sell signals coming a bit late.
However, if the Stockscores history is treated as trend -- with increasing
scores indicating bullishness, scores staying in a range as a continuation
of bullishness or bearishness, and decreasing scores indicating bearishness
-- then better, if mixed, results came up.
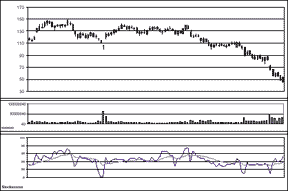
FIGURE 4: YAHOO. Stockscores is bullish just before YHOO
starts its dive.
As an example, Yahoo! is in a consolidation pattern for the first two-thirds
of the top chart in Figure 4 and then price starts down. Stockscores is
still bullish (point A). A sell signal is finally generated as Yahoo! goes
down to 122.
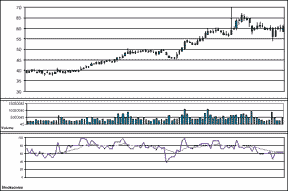
FIGURE 5: BOEING. BA's strength is reflected in a consistently
strong scoring.
Boeing, on the other hand, is a stock that has shown strength since May
30, 2000 (Figure 5). Stockscores reflects overall strength by having a
moving average of the scores that stays in a high range. Stockscores is
considering making the score history available to users. This may help
users, but still leaves the question of what the score is and how reliable
it is.
Stockscore provides screening across a range of indices, both American
and Canadian (AMEX, CDV, CDNX, MSE, Nasdaq, NYSE, OTCBB, and TSE). Most
indicators are predefined. Three interesting screening items are abnormal
activity, consolidations, and gaps. The screening techniques are proprietary.
Stockscores' gap search does just fine, and given the breadth of markets
covered, could be reason enough to visit this site.
Besides screening, Stockscores also scores sectors. The Dow Jones industrial,
transportation, and utilities averages are given, as well as those in the
Nasdaq 100 and 19 US indices plus a number of Canadian indices.
This site has some useful features, but is the score relevant? What
has the screening really produced? For users to make use of the scores,
they need knowledge of technical analysis, but this is what the site is
trying to avoid. Plus, since all the scoring is proprietary, none of the
work can be checked. In all, it will take a couple of years to see if this
black box can be profitable.
--Dennis D. Peterson
Staff Writer