NOVICE TRADER
by Thomas Bulkowski
At first, I thought double bottoms were just double tops flipped upside down, but I was wrong. It's not the formation that's the puzzle; it's the price trend leading to a double bottom. With double tops and many reversal patterns appearing near the top of a price series, the approach leading to the pattern is usually steep. Prices rise rapidly, execute a reversal pattern, then drop just as quickly. With bottom formations, you can still have that type of behavior -- a catastrophic decline that turns and the stock recovers. However, it is also possible that you could witness a quick decline, then a slower, torturous downtrend as prices continue to drop even further, spread out over many months.
To detect double bottoms automatically, I couldn't just flip around the computer code to detect tops. I had to change the algorithm to accommodate the possibility of a meandering decline. Once that was accomplished, the program I designed to search my database was correctly detecting double bottoms in many of the stocks I follow.
DOUBLE BOTTOMS
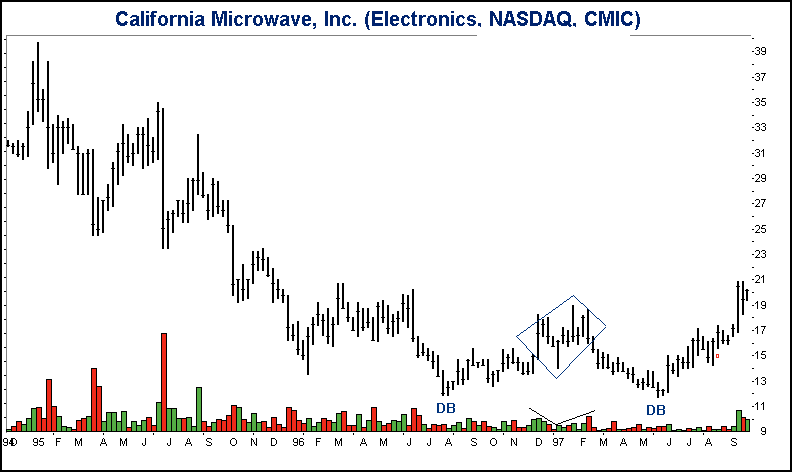
What exactly is a double bottom? Consider the charts of California Microwave [CMIC] and The Bombay Co. [BBA] shown in Figures 1 and 2, respectively. Both charts show double bottoms, but on different time scales. CMIC shows a steady but steep decline in the stock price on a weekly time scale. The stock declined from a high of $39-3/4 in early January 1995 and finally reached bottom in late July 1996 at $11-7/8, a decline of 70%. After hitting bottom, the stock made an unconvincing attempt at rising upward.
The rounding turn reached a high point in January 1997. Looking at the weekly chart, the price began forming a diamond reversal, somewhat irregular in shape, which completed in mid-February. Although the diamond may be classified as a head-and-shoulders formation, the unsymmetrical shoulders and V-shaped volume pattern suggests that the formation is better classified as a diamond. Either way, the prognosis was bearish.
After the reversal completed, prices headed down again. The diamond suggested that prices would decline by the measure rule for a diamond: The height of the diamond, in this case $5 ($19-14, measured high to low). However, there is an alternate measure for nearly all reversal formations. The reversal will carry back to the level where the trend began. The reversal must have something to reverse.
In this case, prices after the diamond reversal could be expected to decline to the prior bottom low, and that's just what happened. In late May 1997, prices declined back below the $12 level and the diamond measure was effectively fulfilled.
With prices declining to the same level, or close, a double bottom took shape. The volume pattern at either bottom was nothing spectacular and did not suggest that a rise in prices would follow. By June, however, prices started climbing once again and moved above the top level of the diamond reversal in mid-September on substantially higher volume. This confirmed the double bottom.

FIGURE 1: A TYPICAL DOUBLE BOTTOM ON A WEEKLY SCALE. After a long decline, the stock hits bottom, bounces, then starts rising again. The rare diamond reversal formation appears as a double top on the daily time scale.
Thomas Bulkowski uses his software engineering skills to further his full-time investment activities.