TRADING TECHNIQUES
by Daryl Guppy
Technical analysis is an adaptive process, pressing at the edges of possibility and developing new approaches from ideas glimpsed in passing. The multiple moving average (MMA) is an indicator developed from one such encounter. It uses core information generated from multiple time frames to capture and understand a concept of market dynamics rather than specific value readings.
As part of her search for high-probability swing trading points, technical trader Linda Bradford Raschke did some work with momentum-based oscillators to identify negative feedback setups. This was one of several steppingstones toward developing some solutions applicable to swing trading, fast-moving commodity markets, and discussed in her work Streets Smarts. Although her focus was on the relationship between range and momentum as a way of identifying the start of positive feedback loops, an observation about contraction points tripped off a series of associated thoughts for me.
The key relationship Raschke was looking for was the crossover of the momentum line plots. She saw this convergence as indicative of volatility ? of a change in price action ? and as a filter of market noise. The key relationship I wanted to explore further was the concept of multiple crossover points as a way to filter market noise. In my equity market segment, moving averages offered opportunities beyond those supplied by momentum oscillator values.
In its most basic form, a moving average signals a trend change when the fast moving average crosses above or below a slower moving average. In any moving average, no matter how calculated, the crossover point delivers two messages. The first is about a change in direction for price; most people concentrate on this and on ways of fine-tuning the signal. The second message shows us a moment of agreement about value from two different time frames. For one reason or another, we tend to ignore the second message.
MULTIPLE MOVING AVERAGES
In working with the concept, I chose an exponential moving average (EMA) to get a broad feel for the type of signal generated. As a rule, I prefer to use an EMA, and in this instance this preference was critical. The EMA throws forward the weighting of recent price action, a factor that delivered unexpected results when working with longer-term averages.
I selected a stock where there was proven strong breakout activity. In these first tests, I did not want to leave room for doubt, so I ensured that any backtest would be performed on known data. If this did not move, then I needed to limit the time expended on this approach and move on.
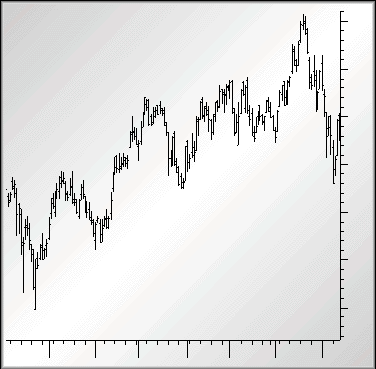
Figure 1 shows Cisco Systems as a daily bar chart. With two strong trend reversals, we have definite market moves to work with. The trend moves sharply upward at point 1 and reverses at point 2. If the indicator were to be useful, it needed to provide signals about these dominant turning points. A very useful indicator would help filter out the false collapse in November, keeping the trader safely in the trend.
As a starting point, I selected a group of moving averages based on approximately half-weekly periods, starting with a three-day EMA and moving to a five-day EMA. The next midweek point was eight days, and so on. So this first group of averages consisted of three-, five-, eight-, 10-, 12- and 15-day EMAs. The result can be seen in Figure 2 when applied to a daily price chart of Cisco Systems.
Intuitively, we expect to see a forward sloping lag as each moving average signals a crossover at a point further away from the actual point of trend change. Instead, we see significant convergence of all plotted moving averages immediately prior to and during changes in the trend. These are most obvious at the points marked on Figure 2 (as 1, A, B and C).

FIGURE 1: CISCO SYSTEMS BAR CHART. You would want a technical method to adequately warn the trader of reversals such as points 1 and 2.
I selected a stock where there was proven strong breakout activity. In these first tests, I did not want to leave room for doubt, so I ensured that any backtest would be performed on known data.
Daryl Guppy is a full-time private position trader. He is the author of several books, including Share Trading: An Approach to Buying and Selling (with editorial assistance from Alexander Elder) and Trading Tactics: An Introduction to Finding, Exploiting and Managing Profitable Share Trading Opportunities and Trading Asian Shares: Buying and Selling Asian Shares for Profit. He is a regular contributor to the Sydney Futures Exchange magazine, Your Trading Edge. He can be contacted via E-mail at www.ozemail.com.au/~guppy .